|
The Lower Mainland Real Estate Market Reports.
温哥华列治文加拿大不动产市场变动
| |
|
|
|
|
|
Hello Friends, It’s Bill Coughlin!
Have these Market Reports helped you?
💰 I’ve spent over $500,000 and 42 years creating the most accurate Real Estate Forecasts for Fraser Valley & Vancouver!
✅ If you find value in these reports — TEXT ME to let me know you want them to continue!
❓Need help understanding what this means for your property?
📞 Call me for your Free Market Analysis of your home.
📲 Text me now at 778-374-3744. I’m here to help put More Money in Your Pocket!
|
The Lower Mainland Real Estate Market analysis reports archives; all our weekly reports
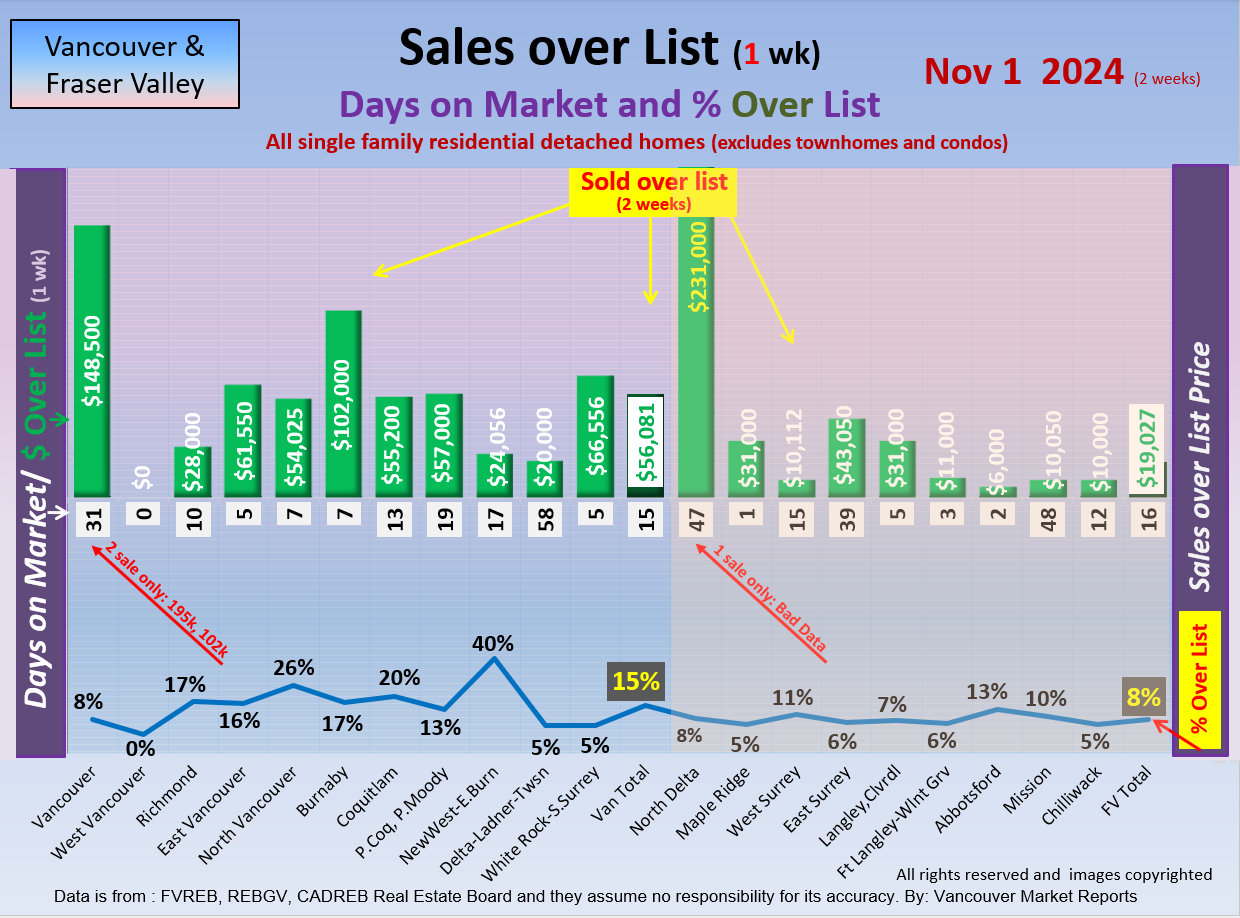
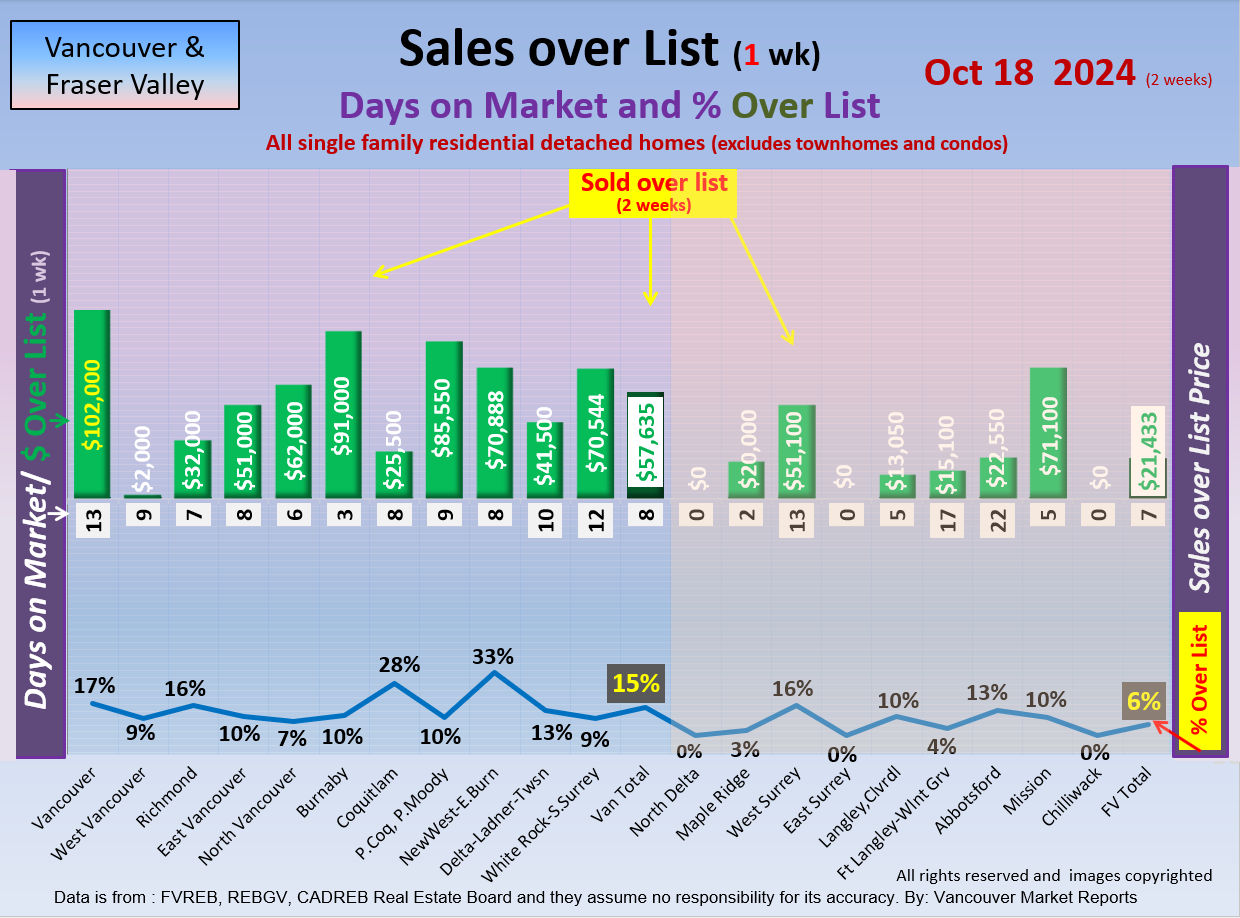
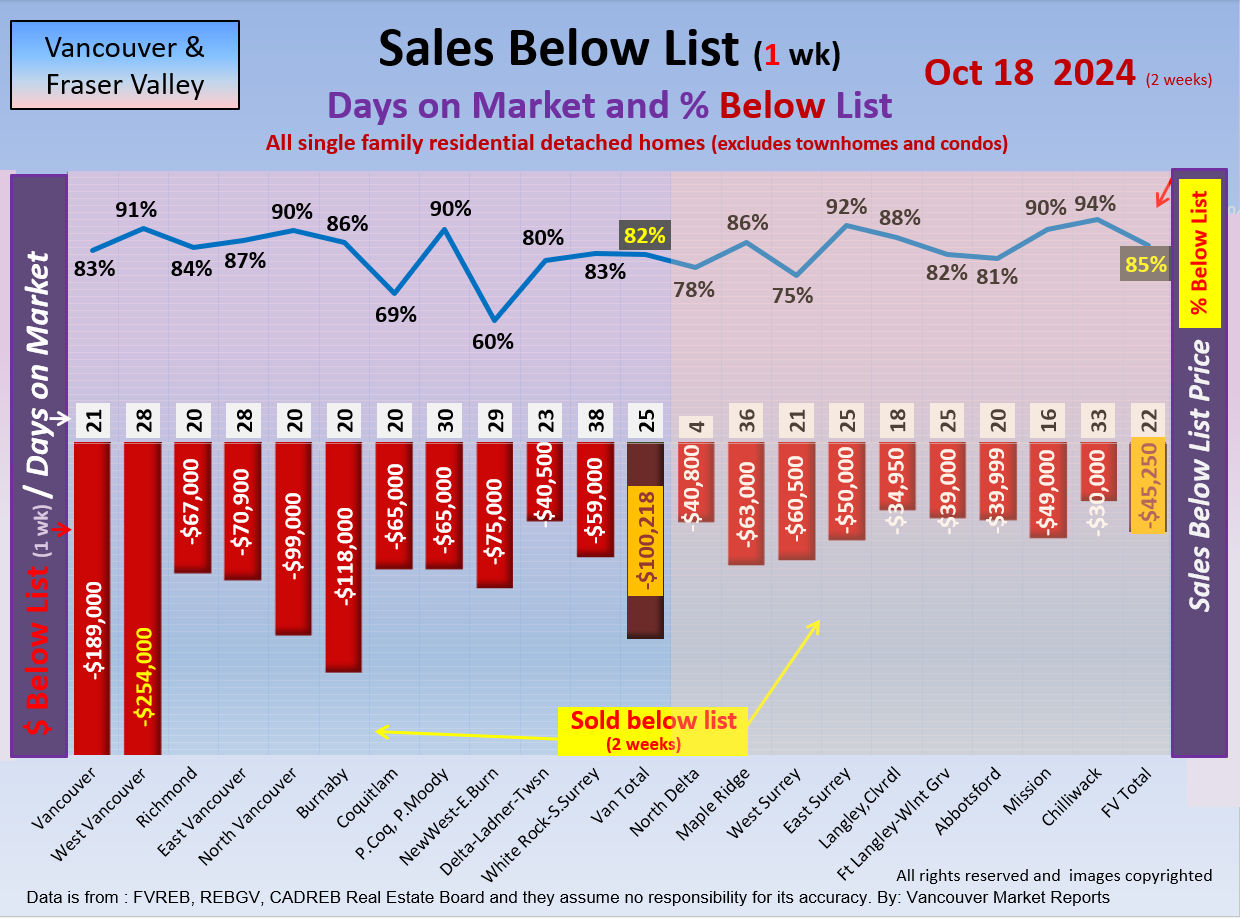
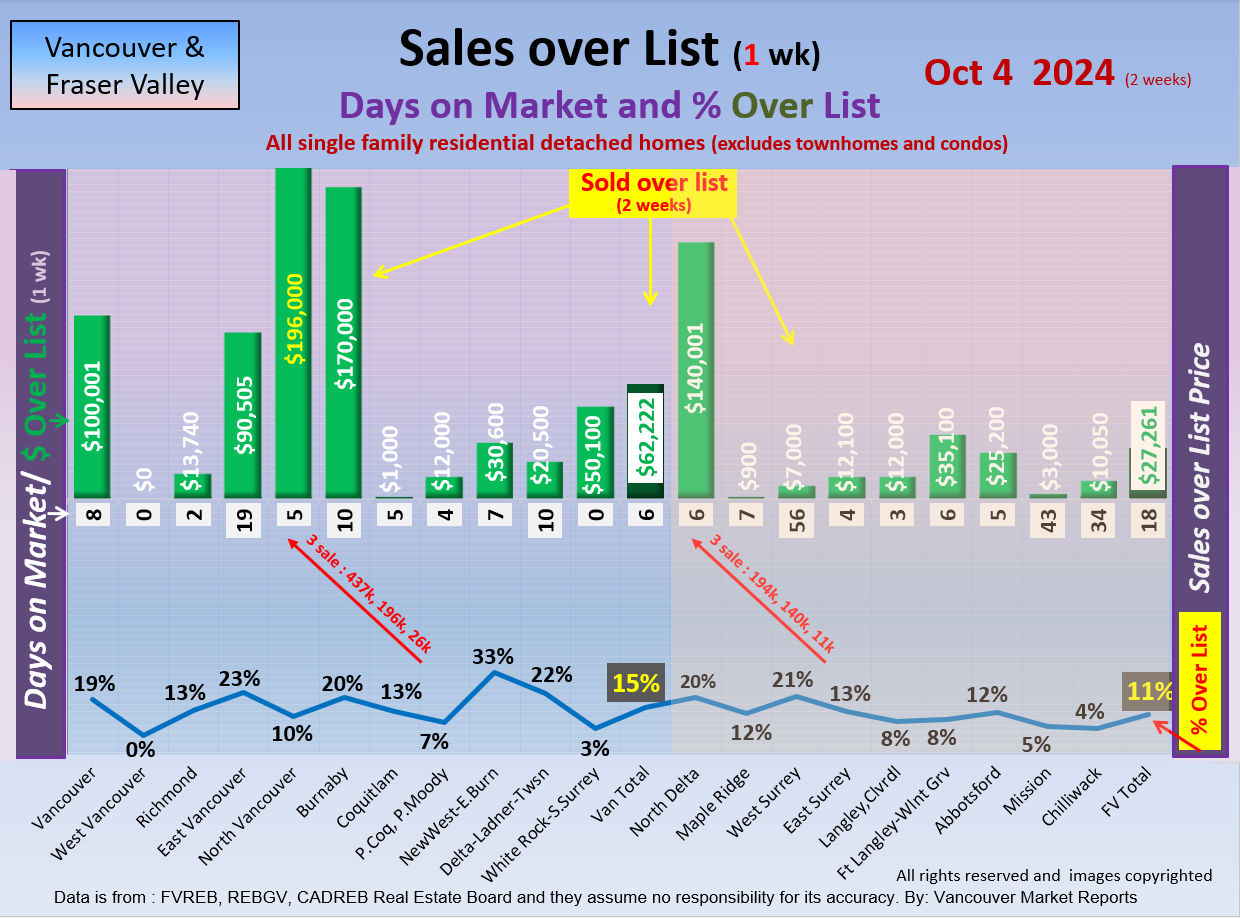
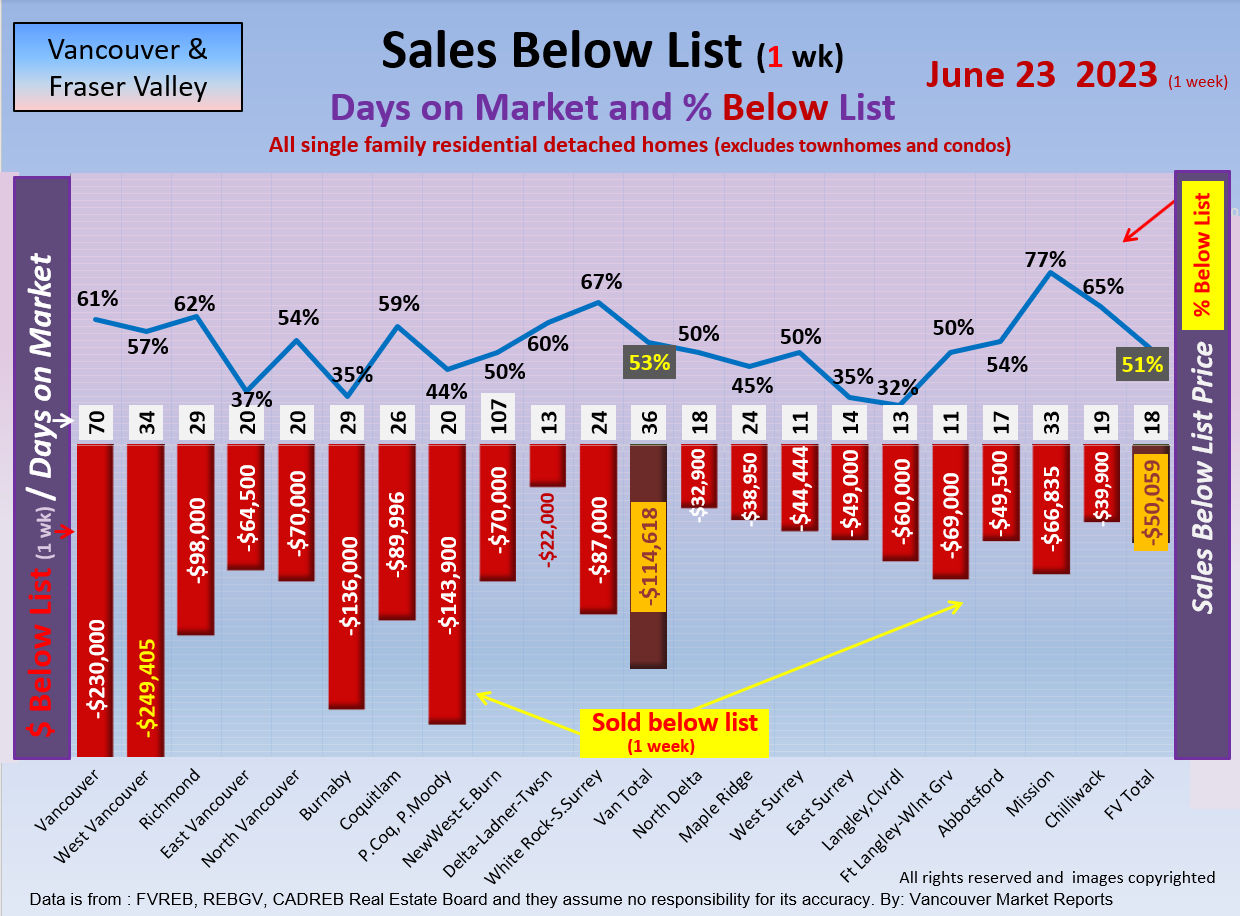
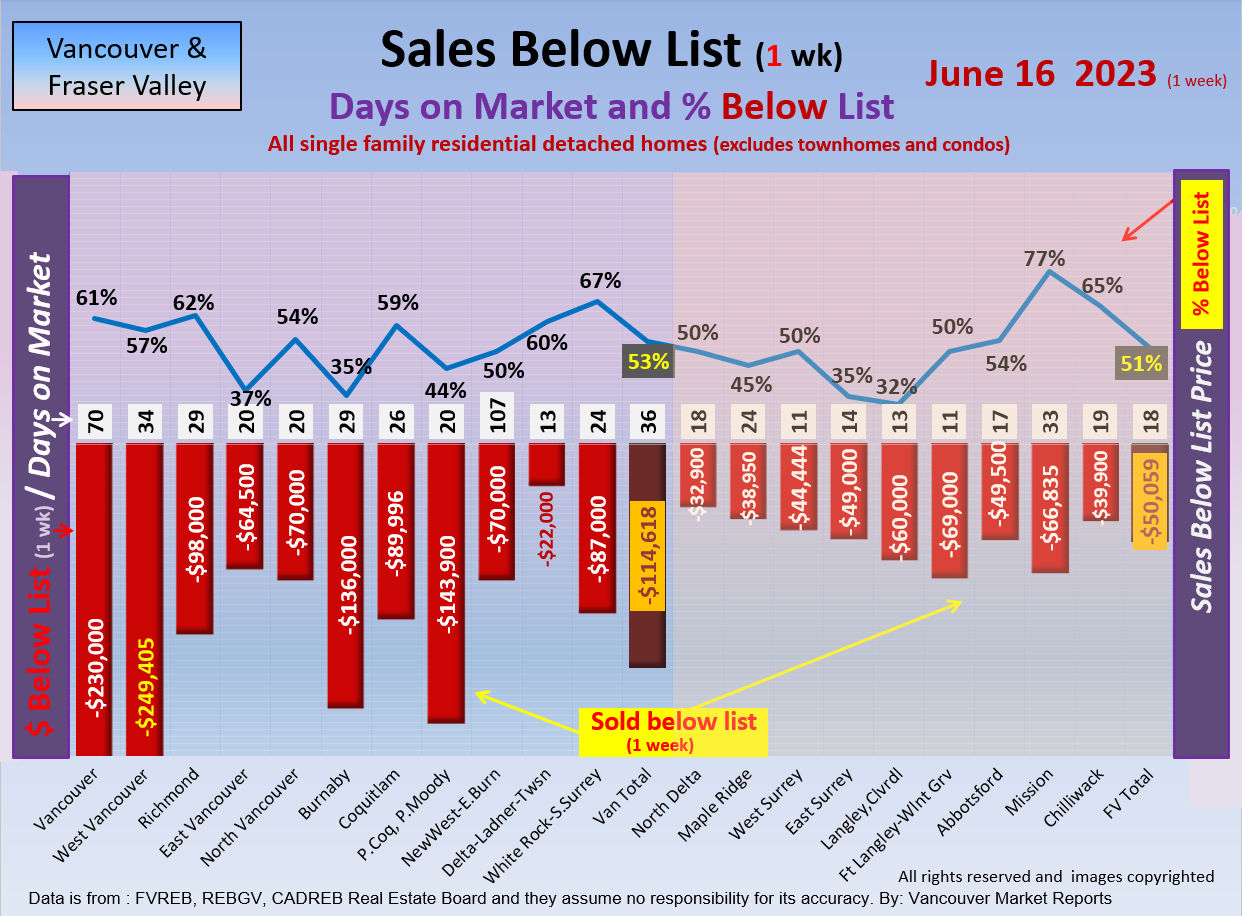
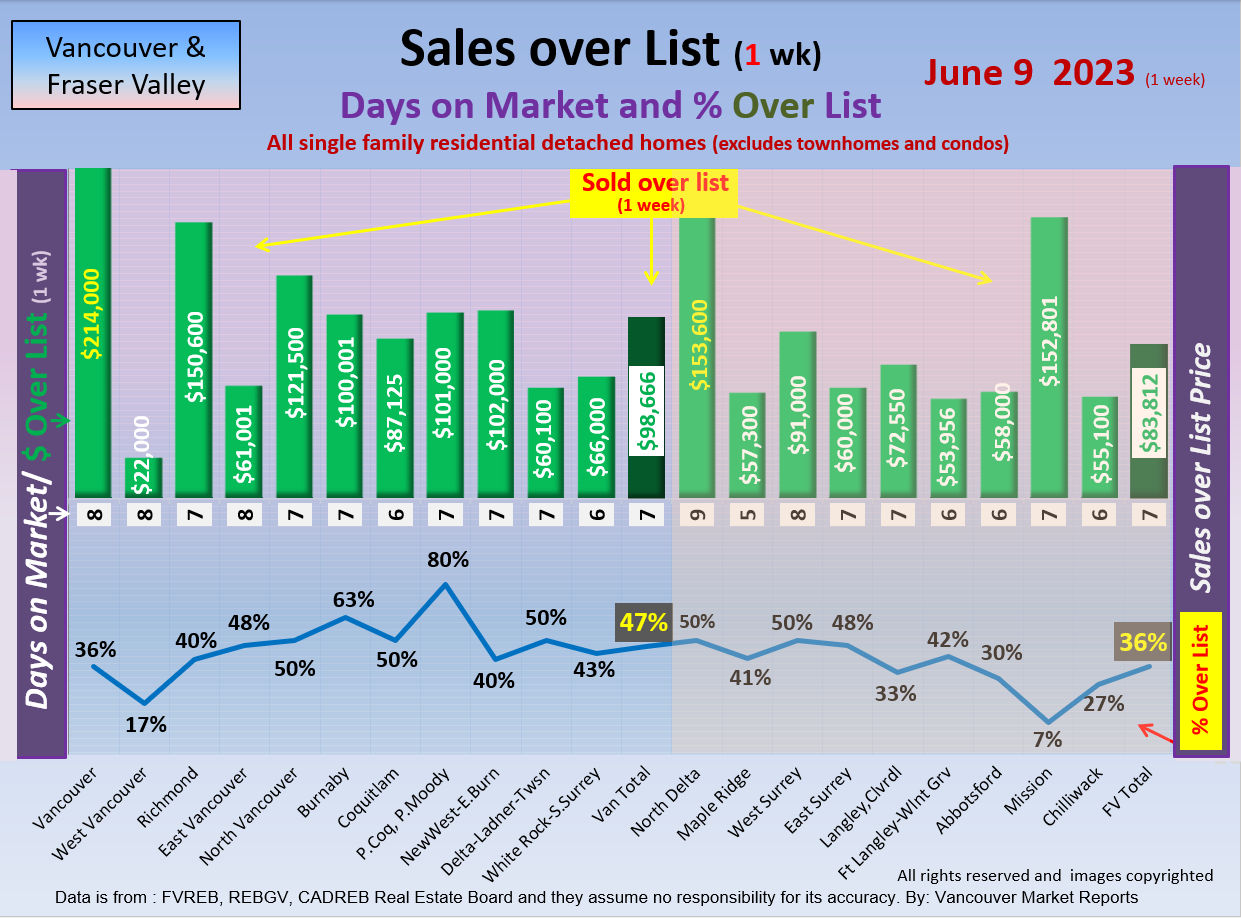
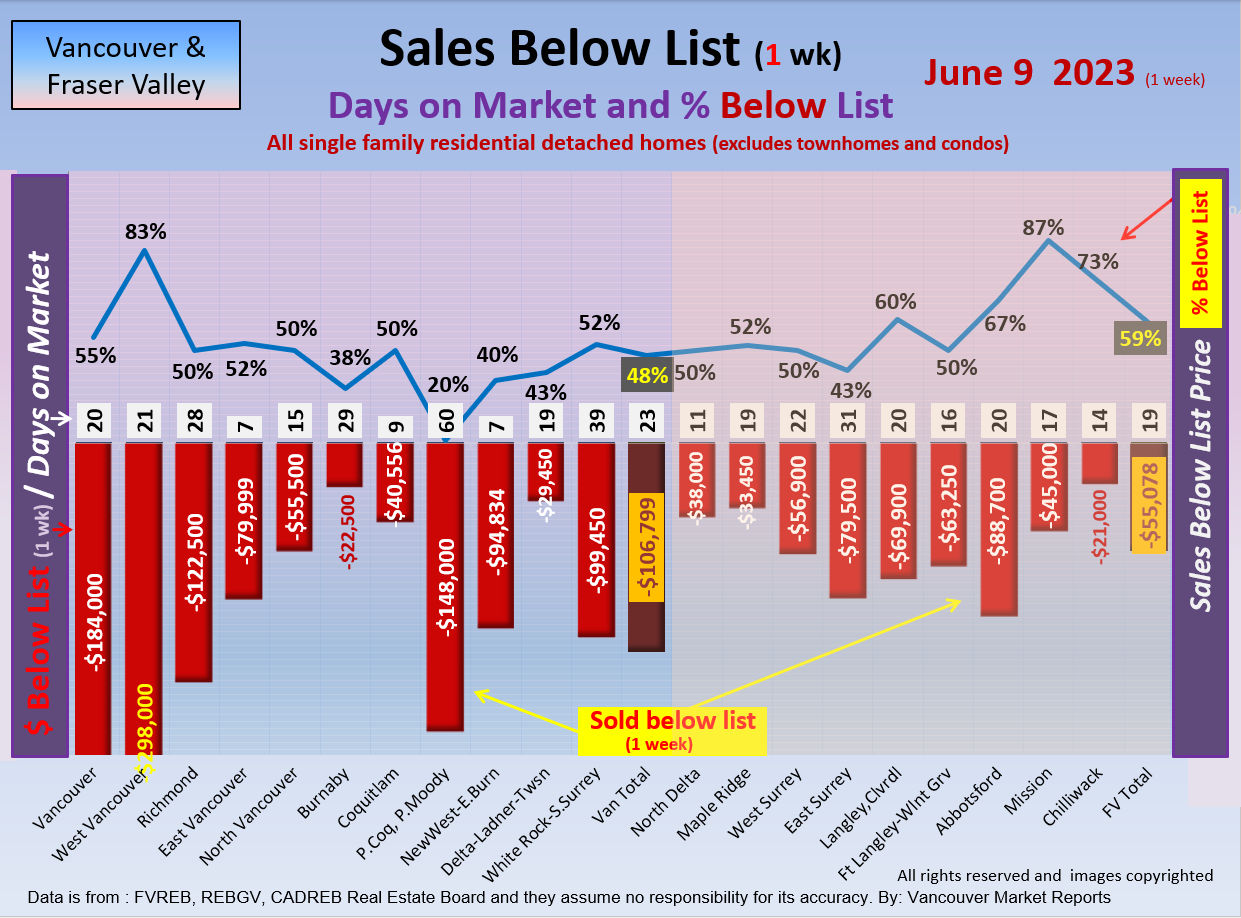
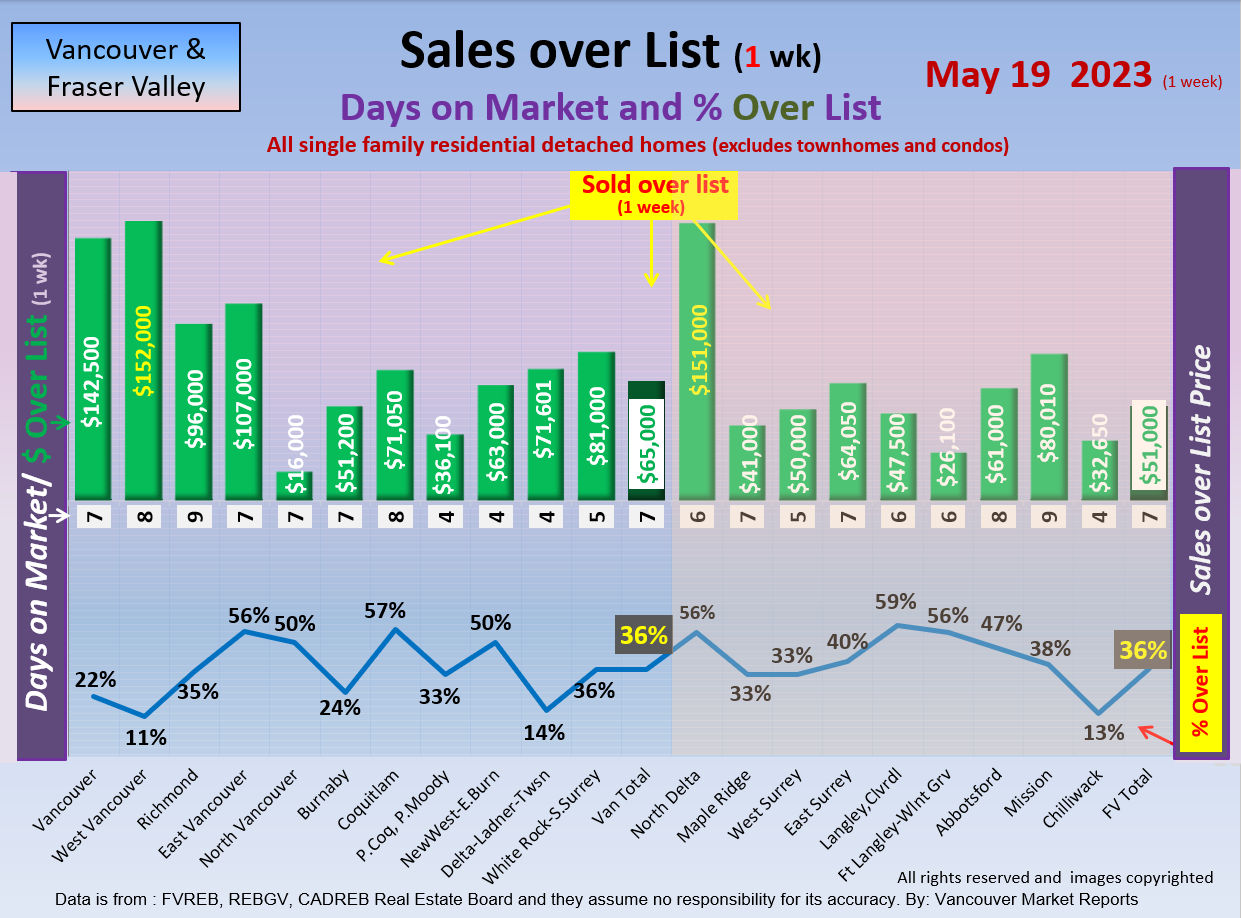
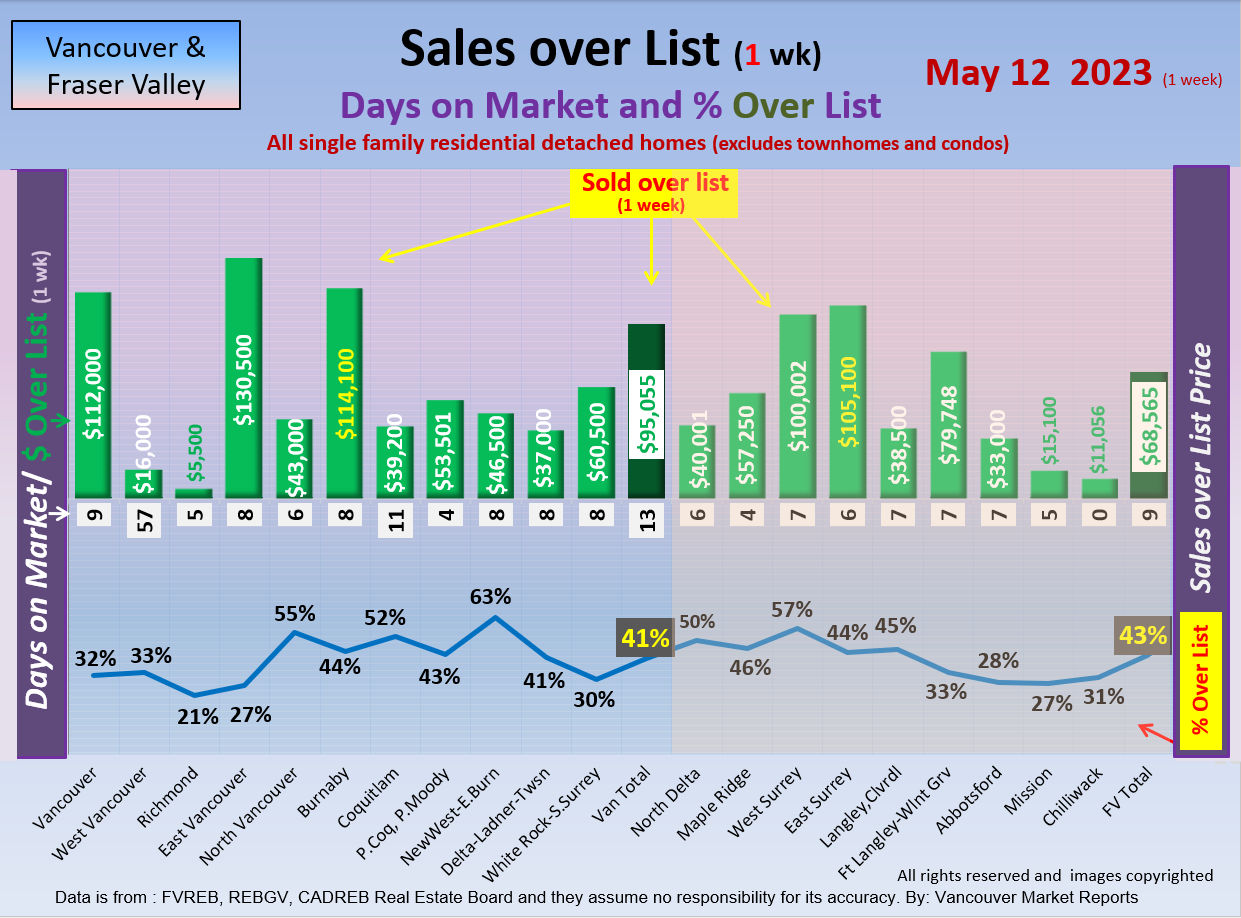
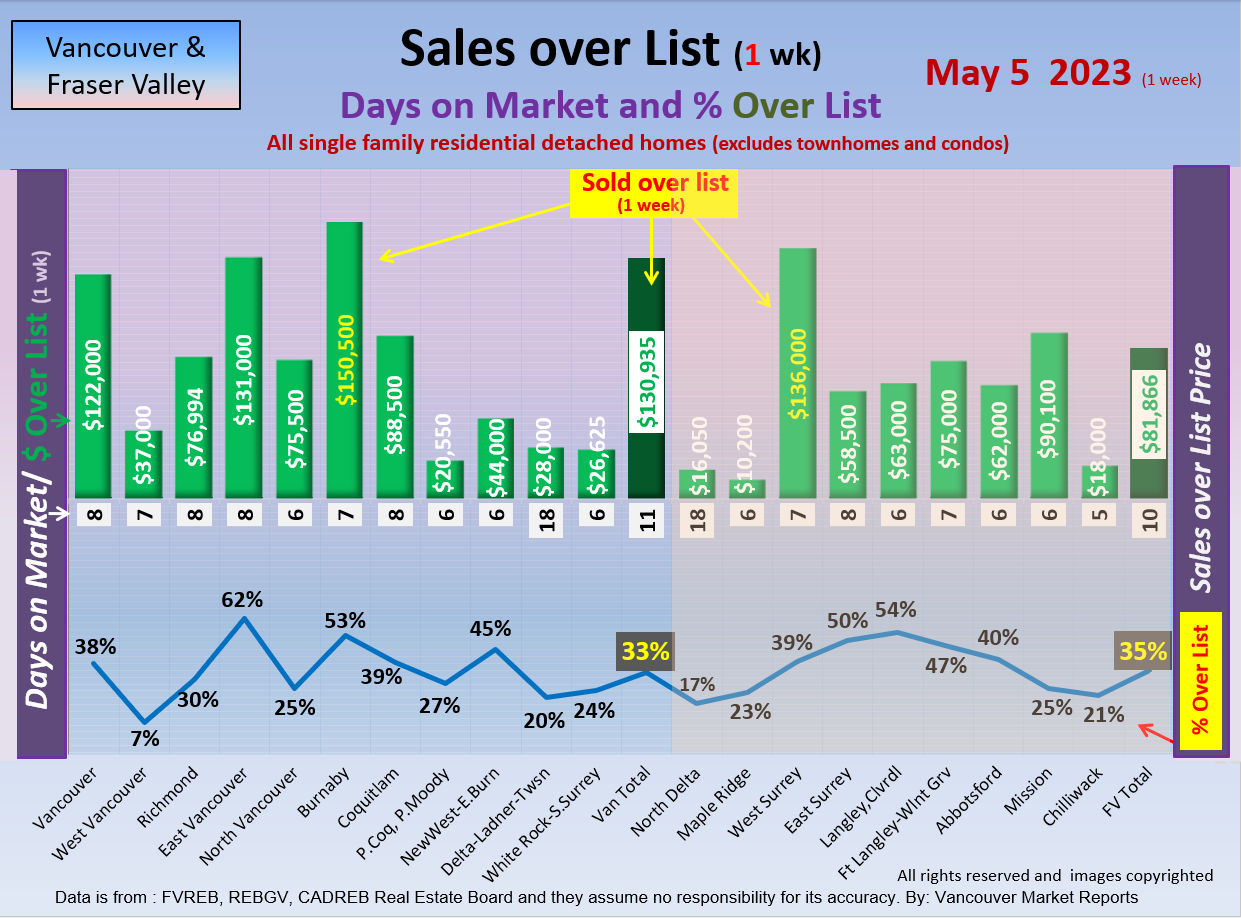
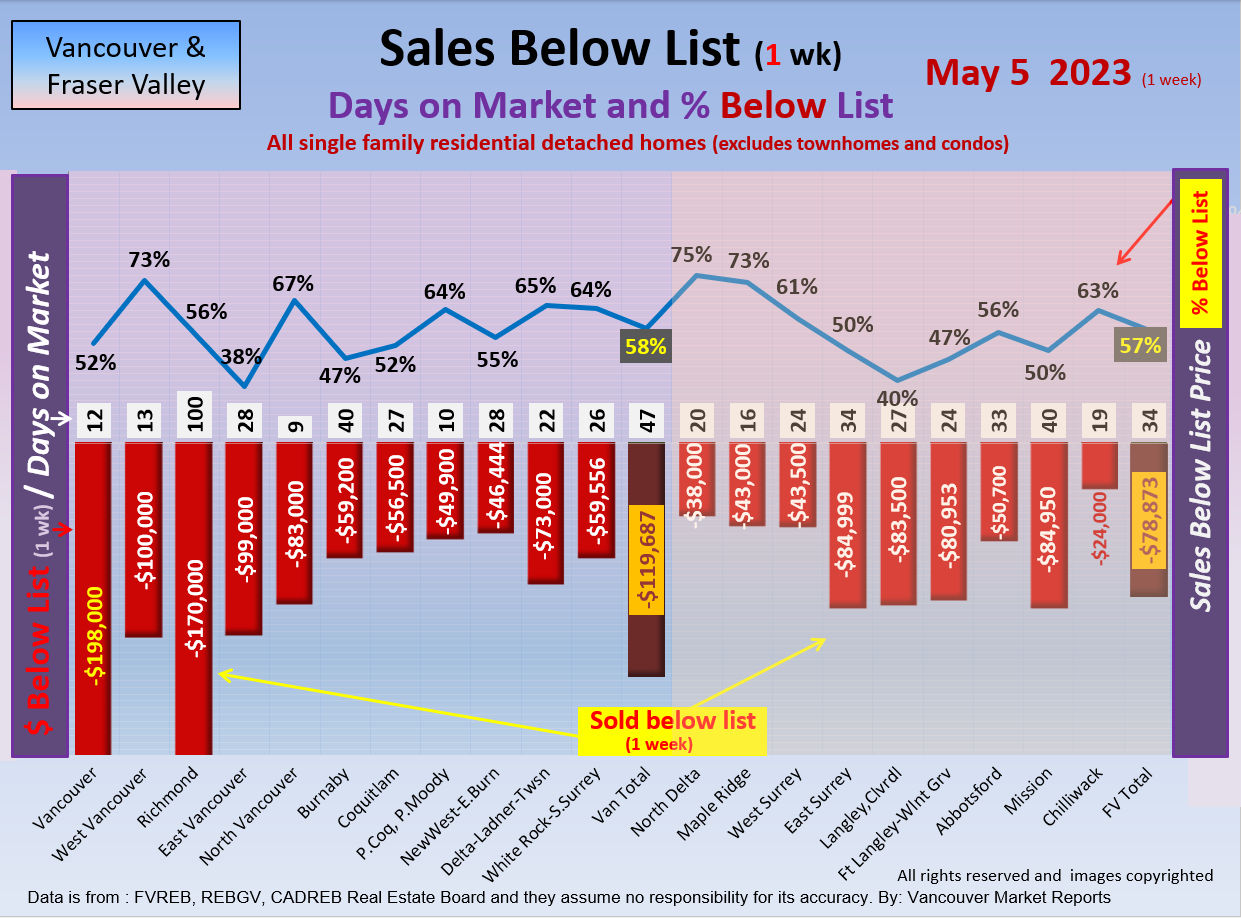
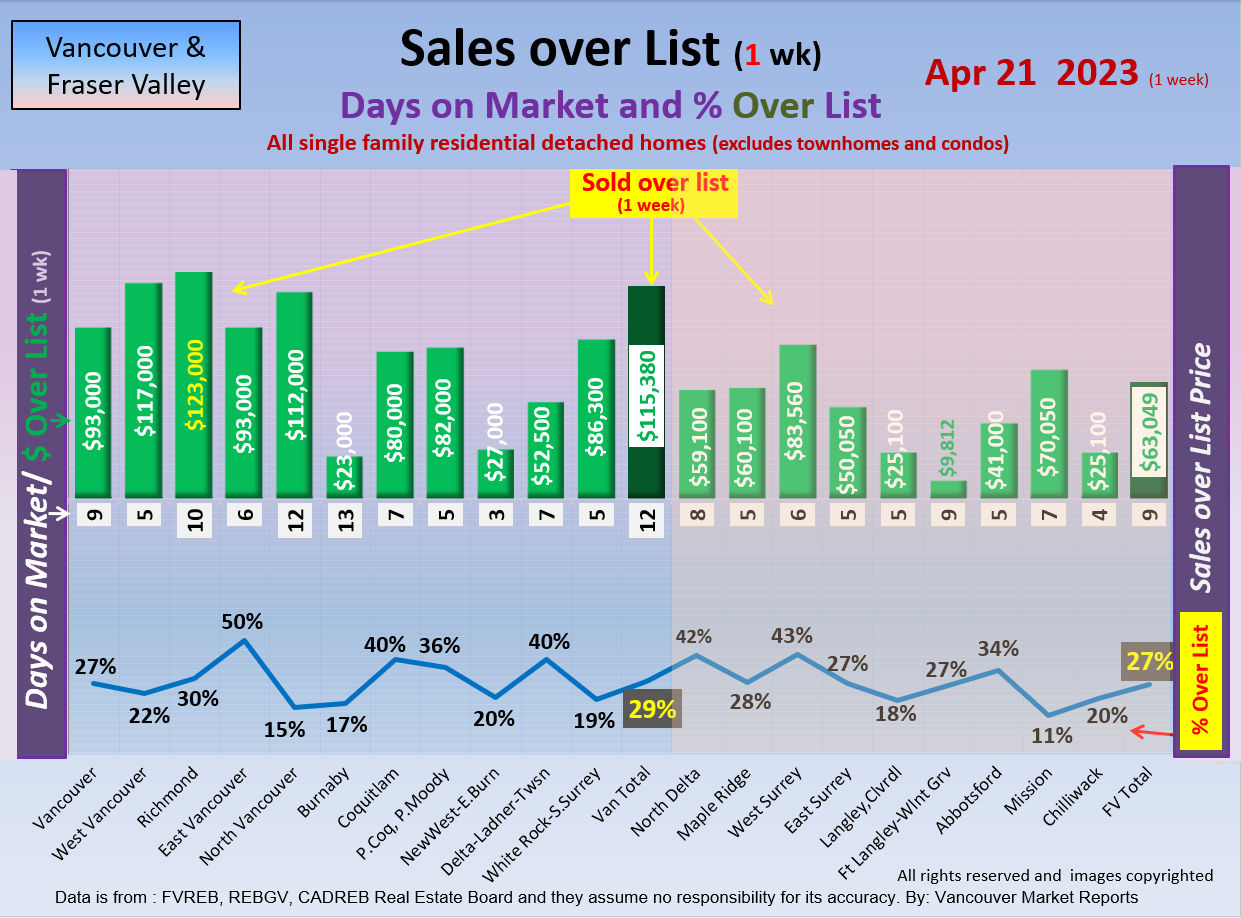
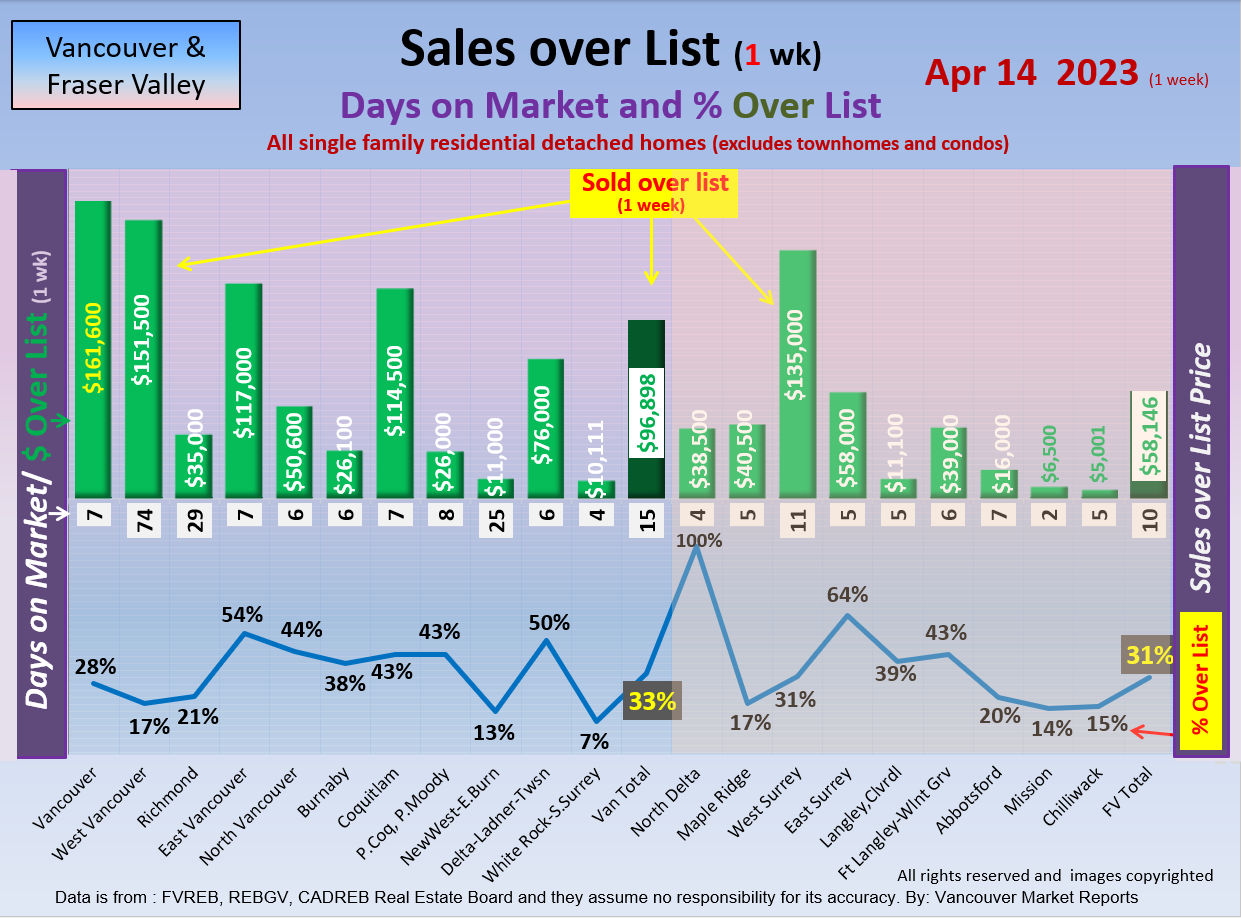
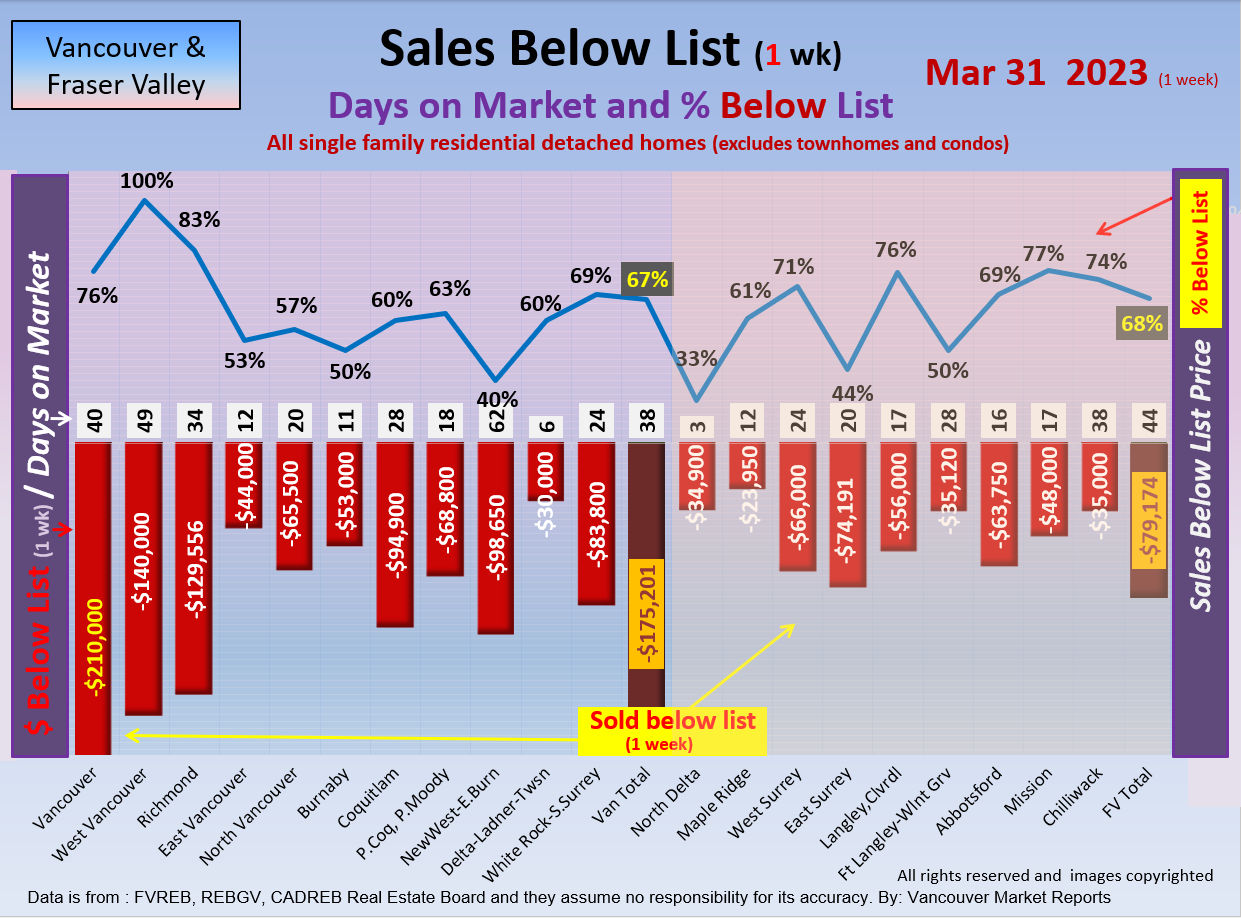
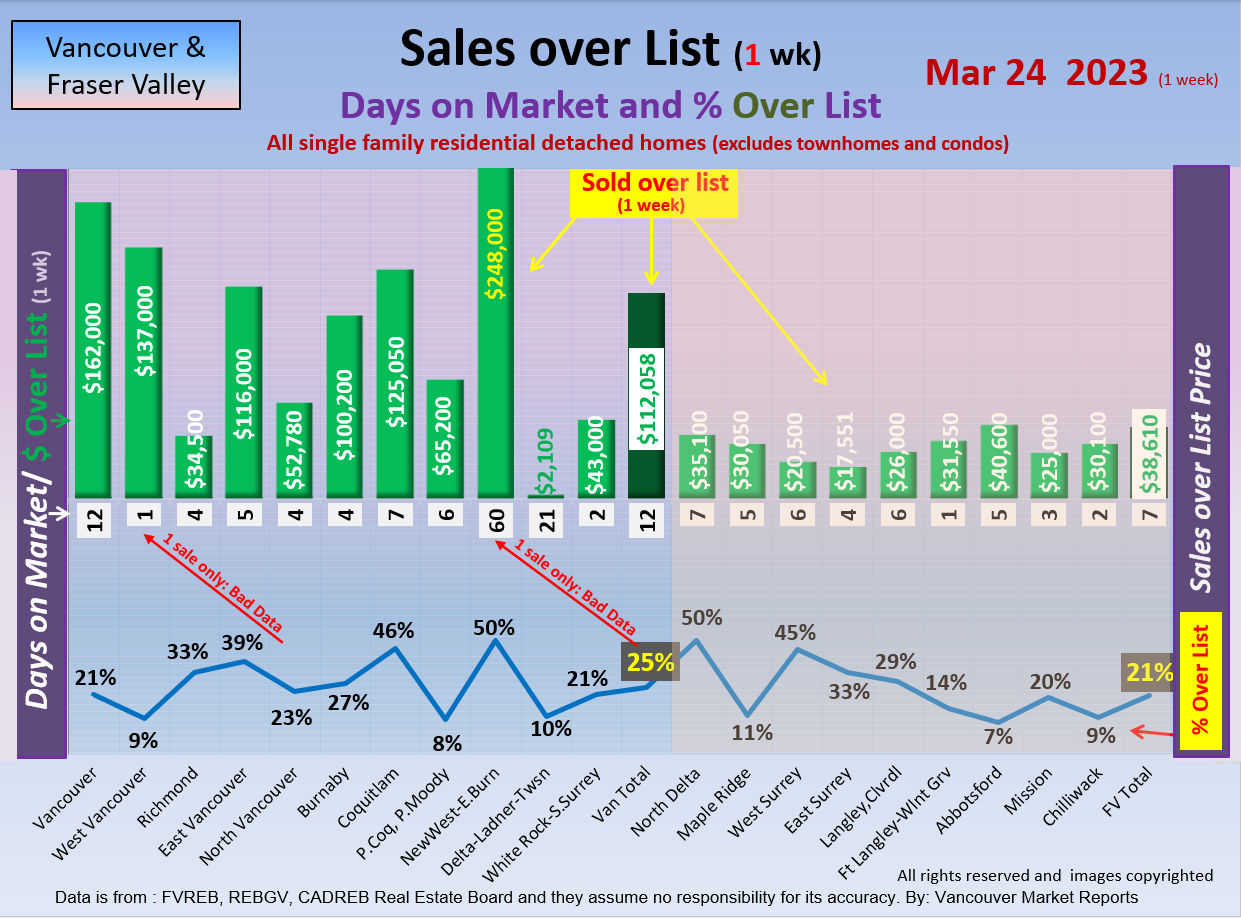
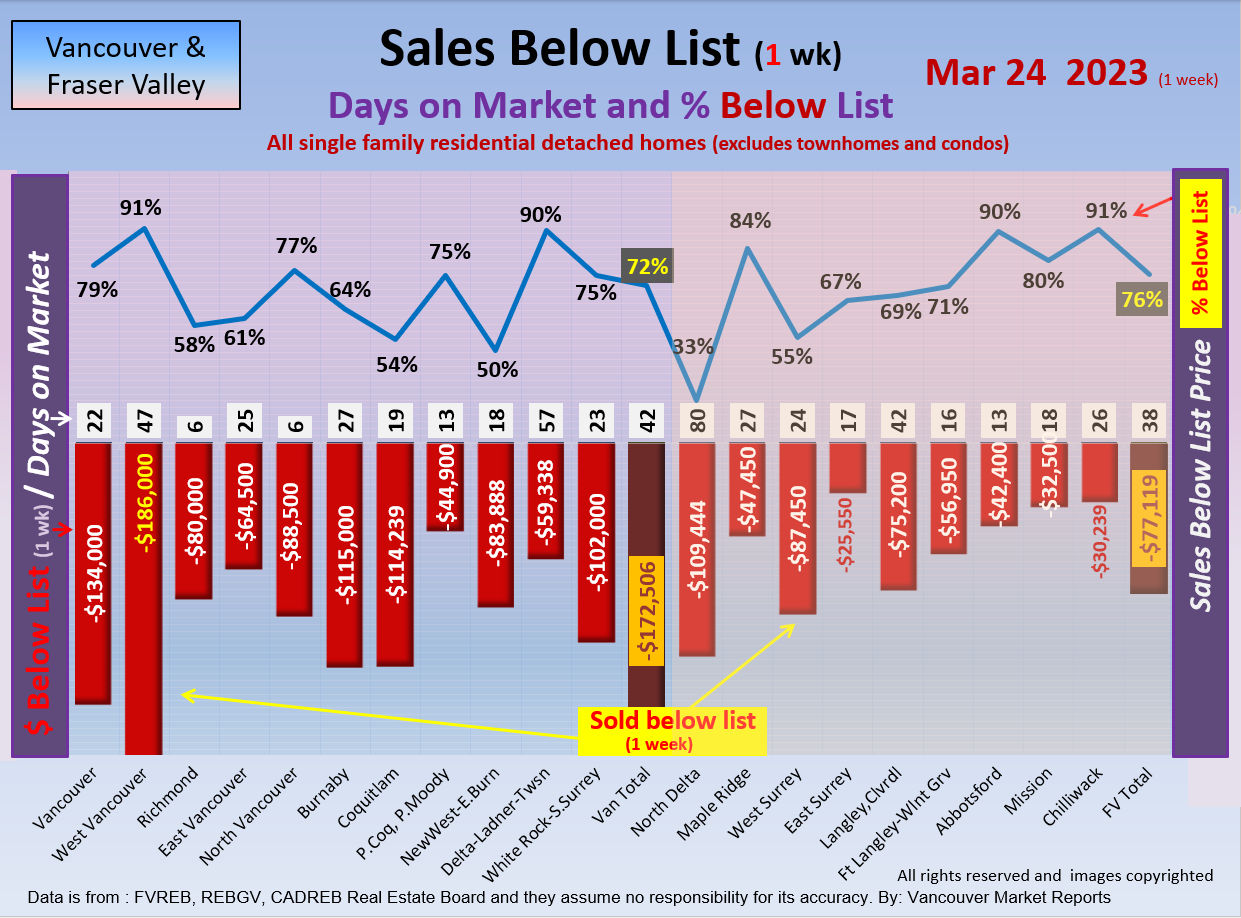
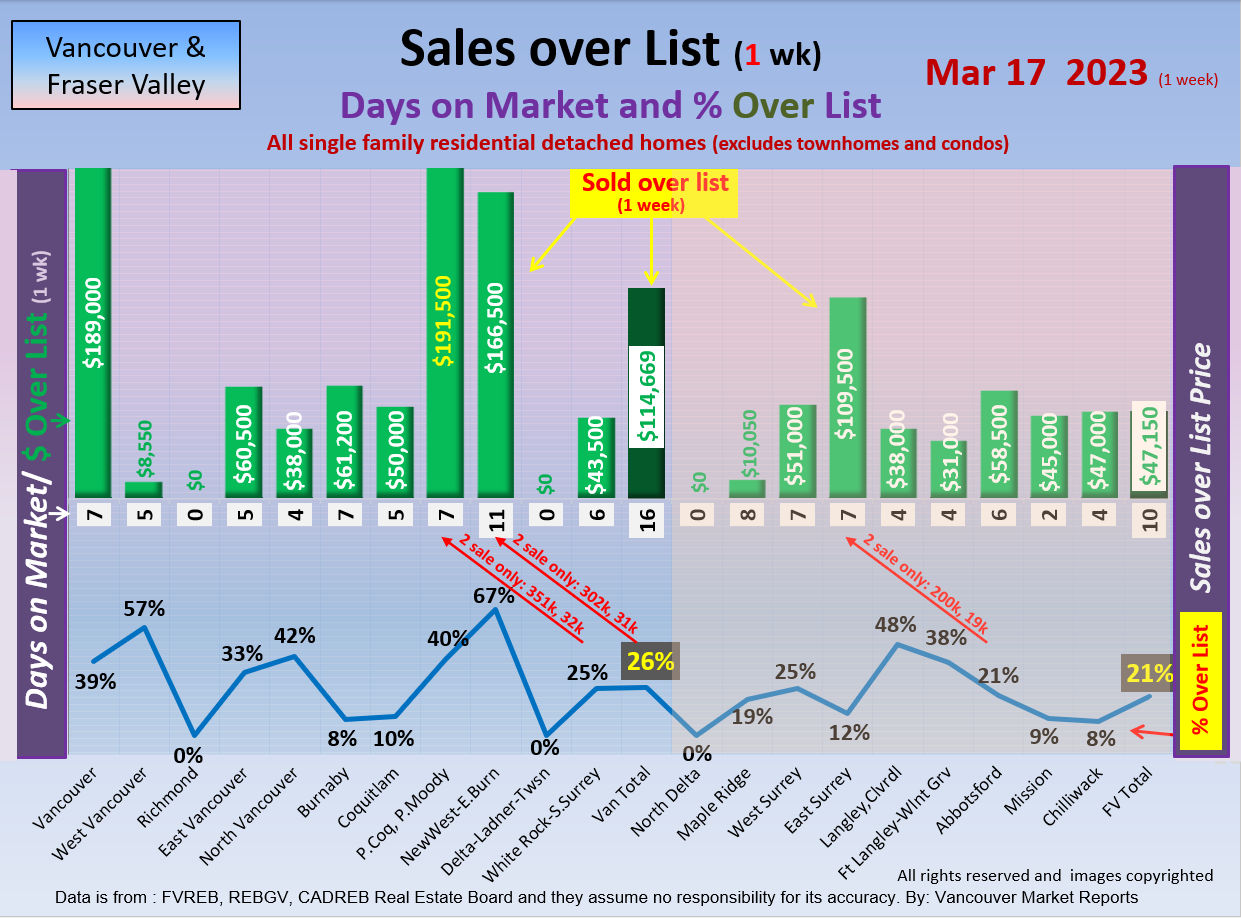
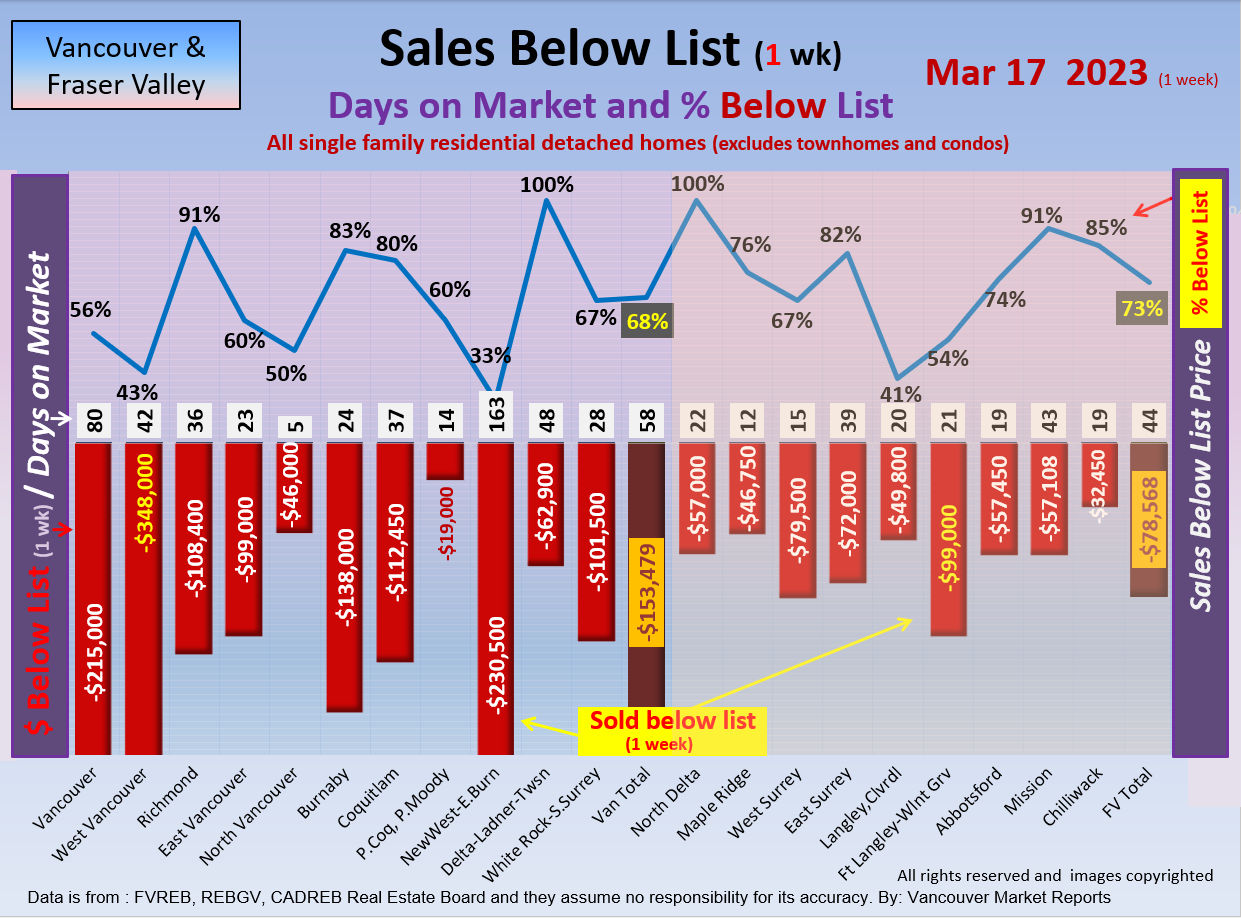
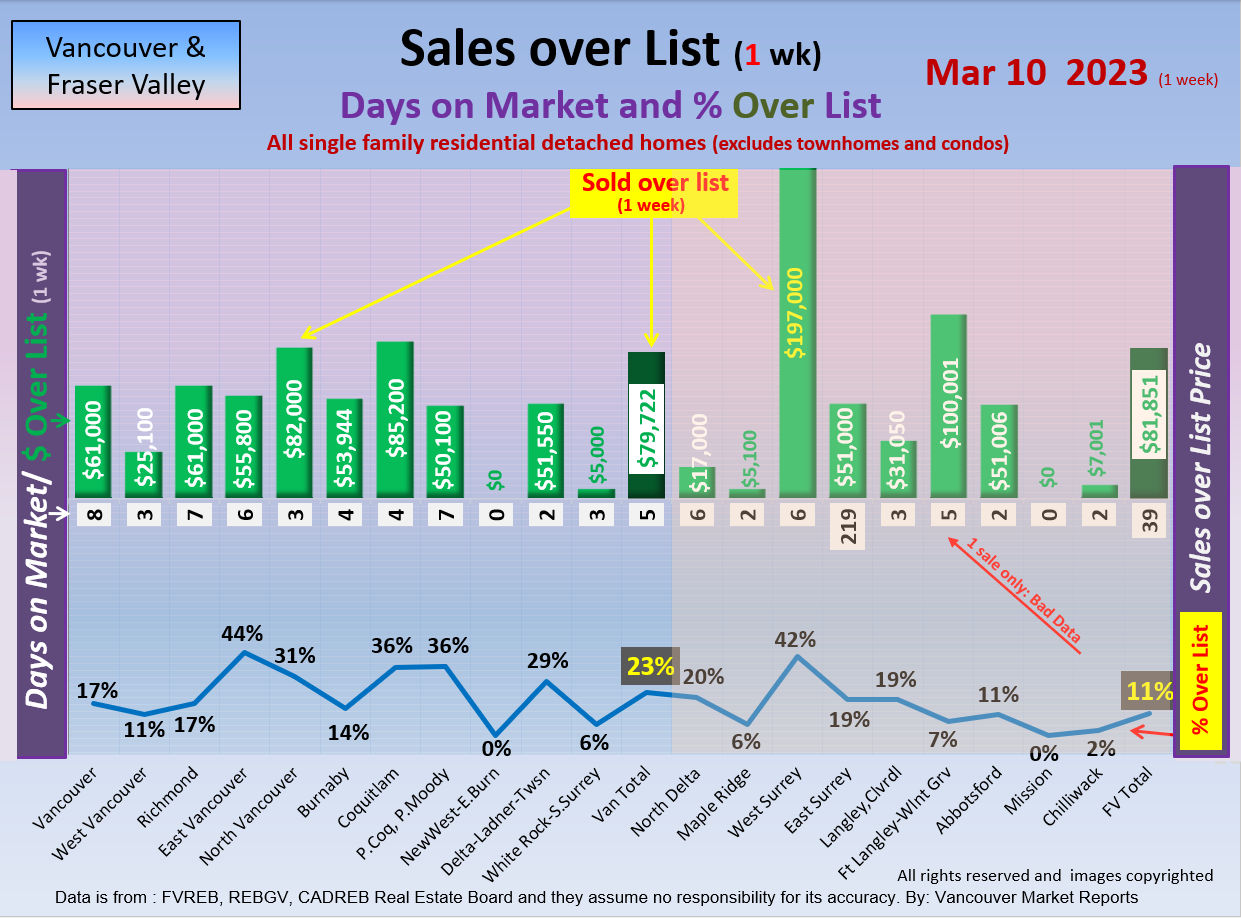
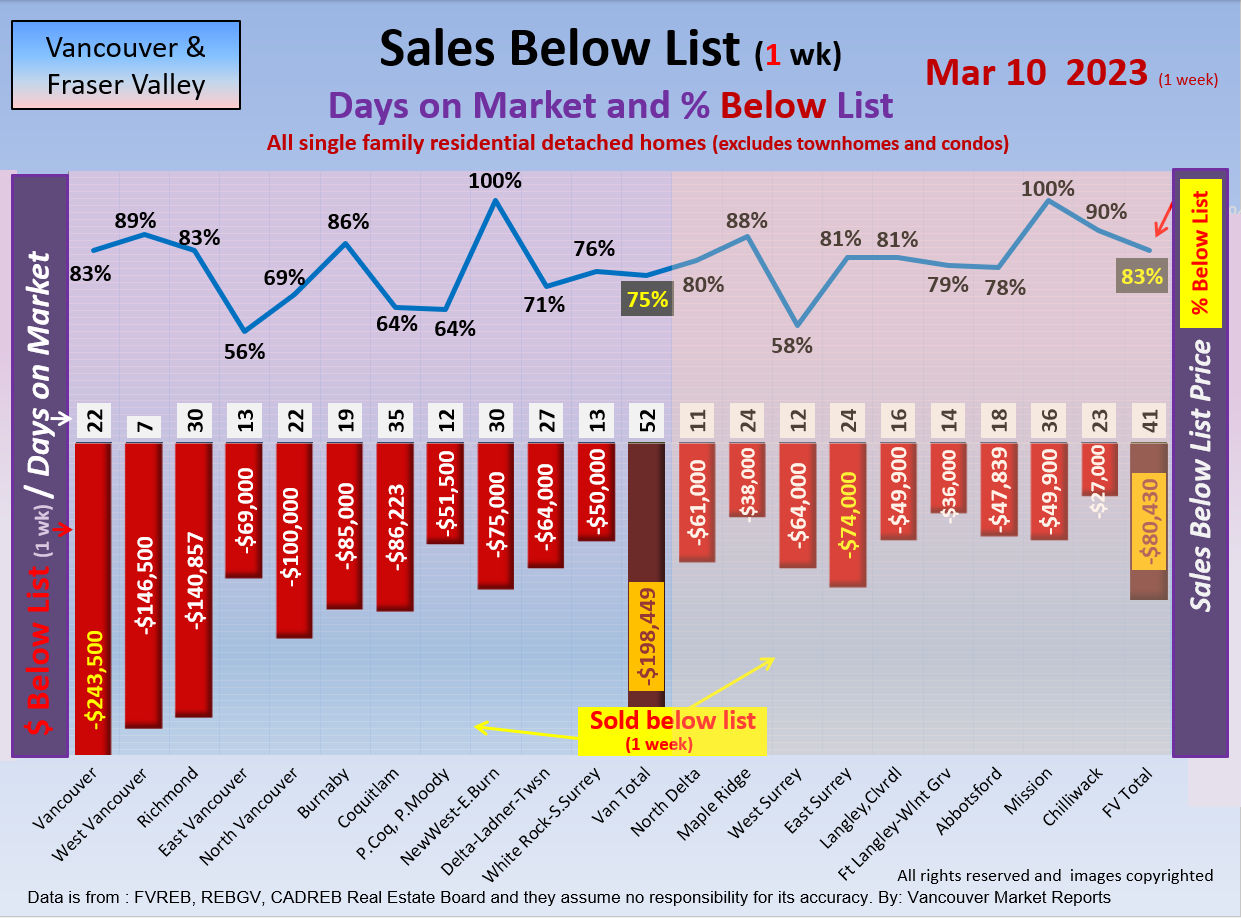
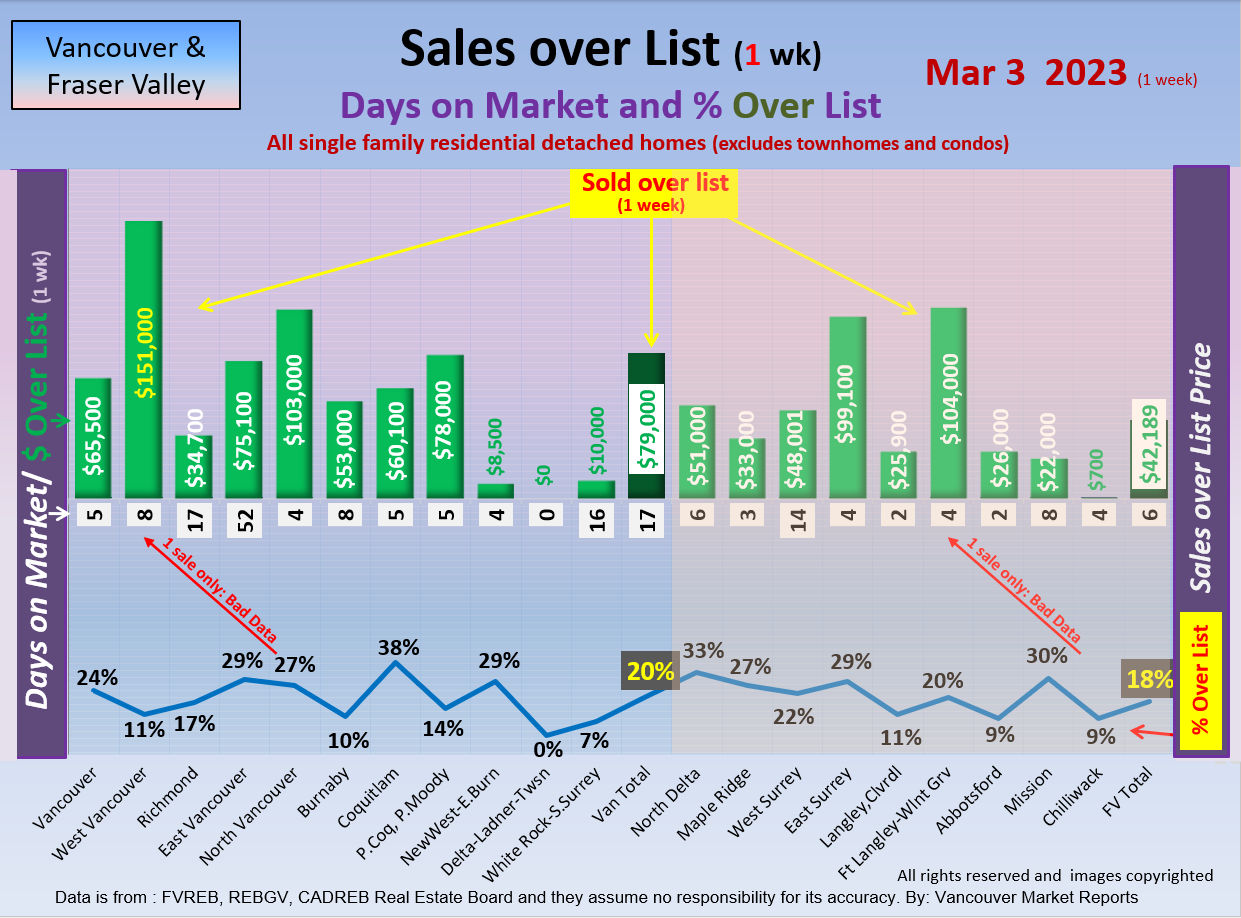
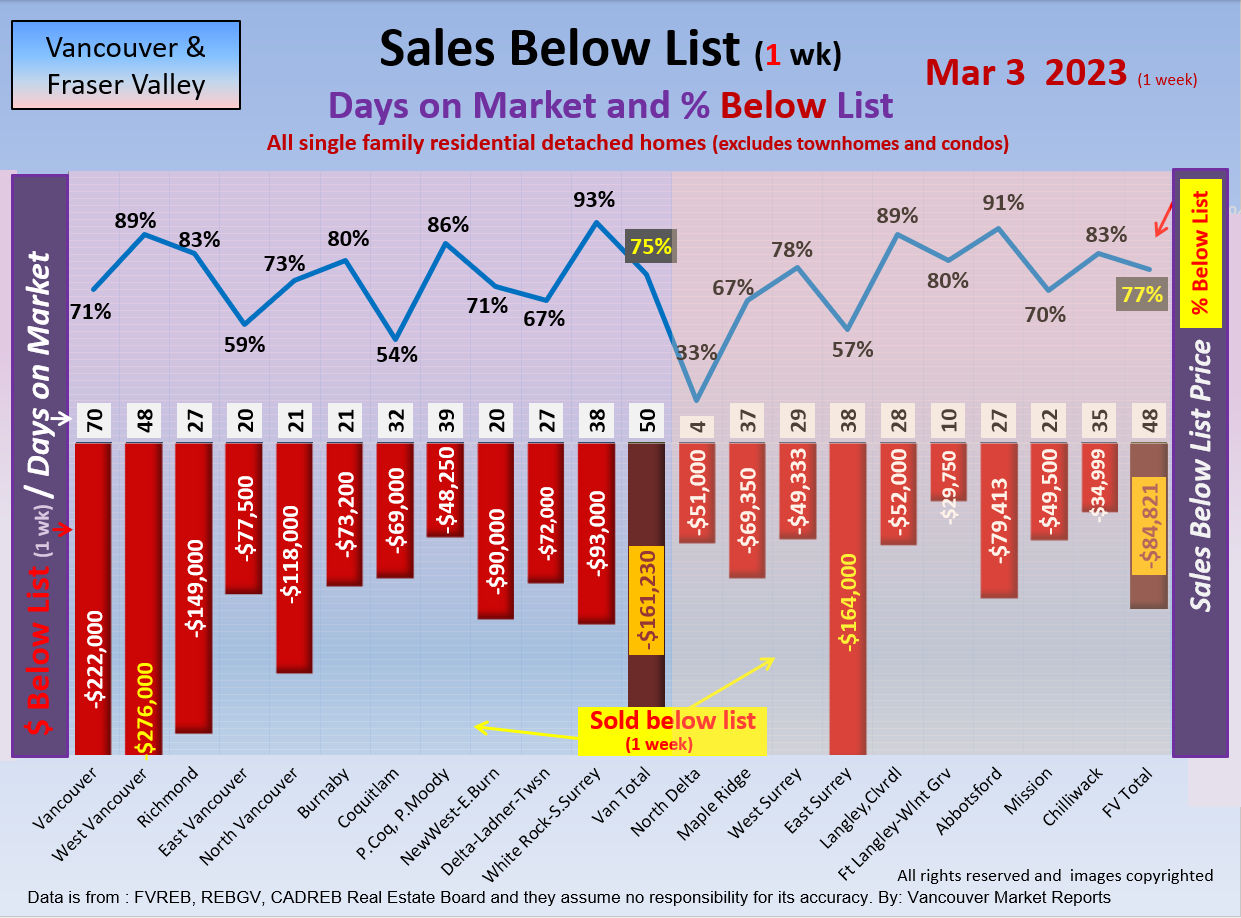
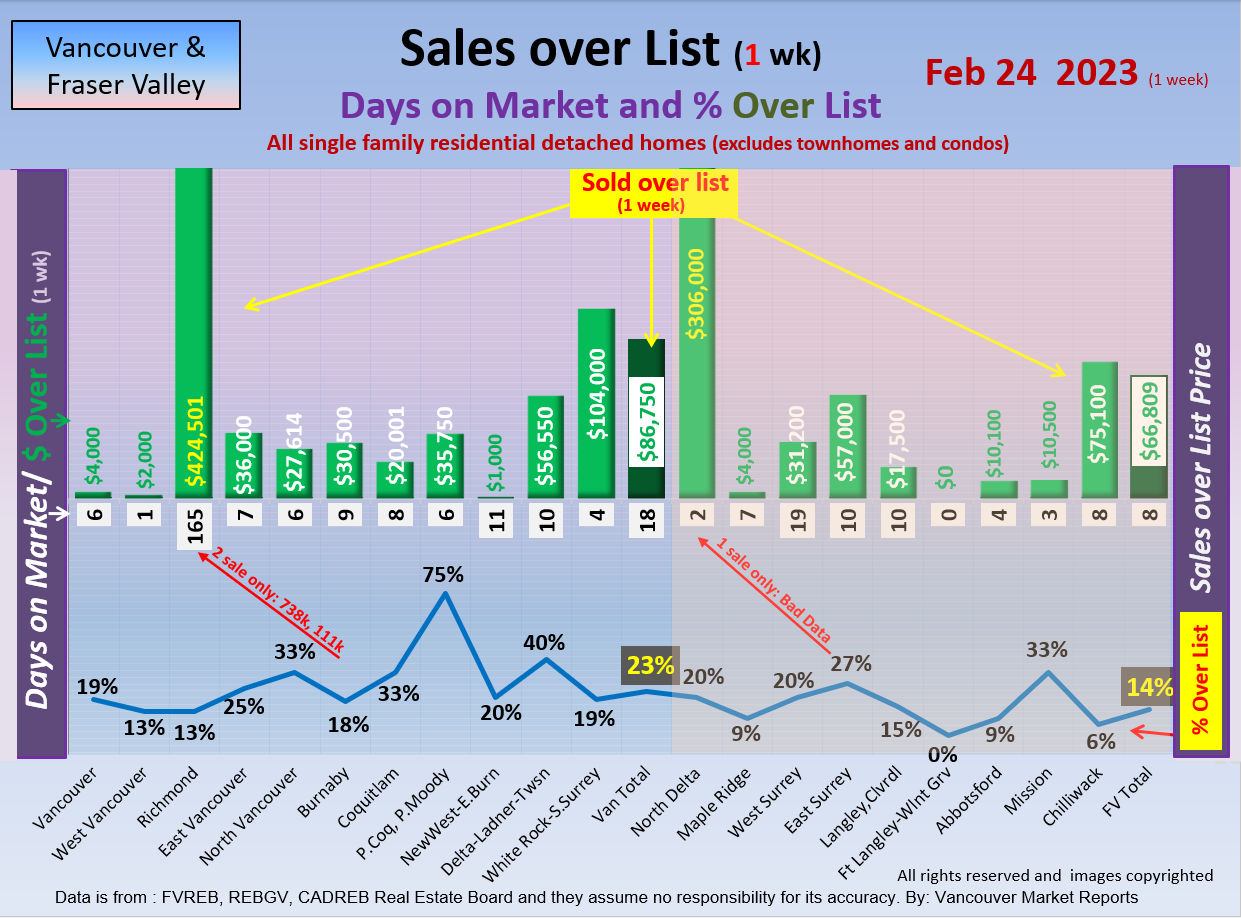
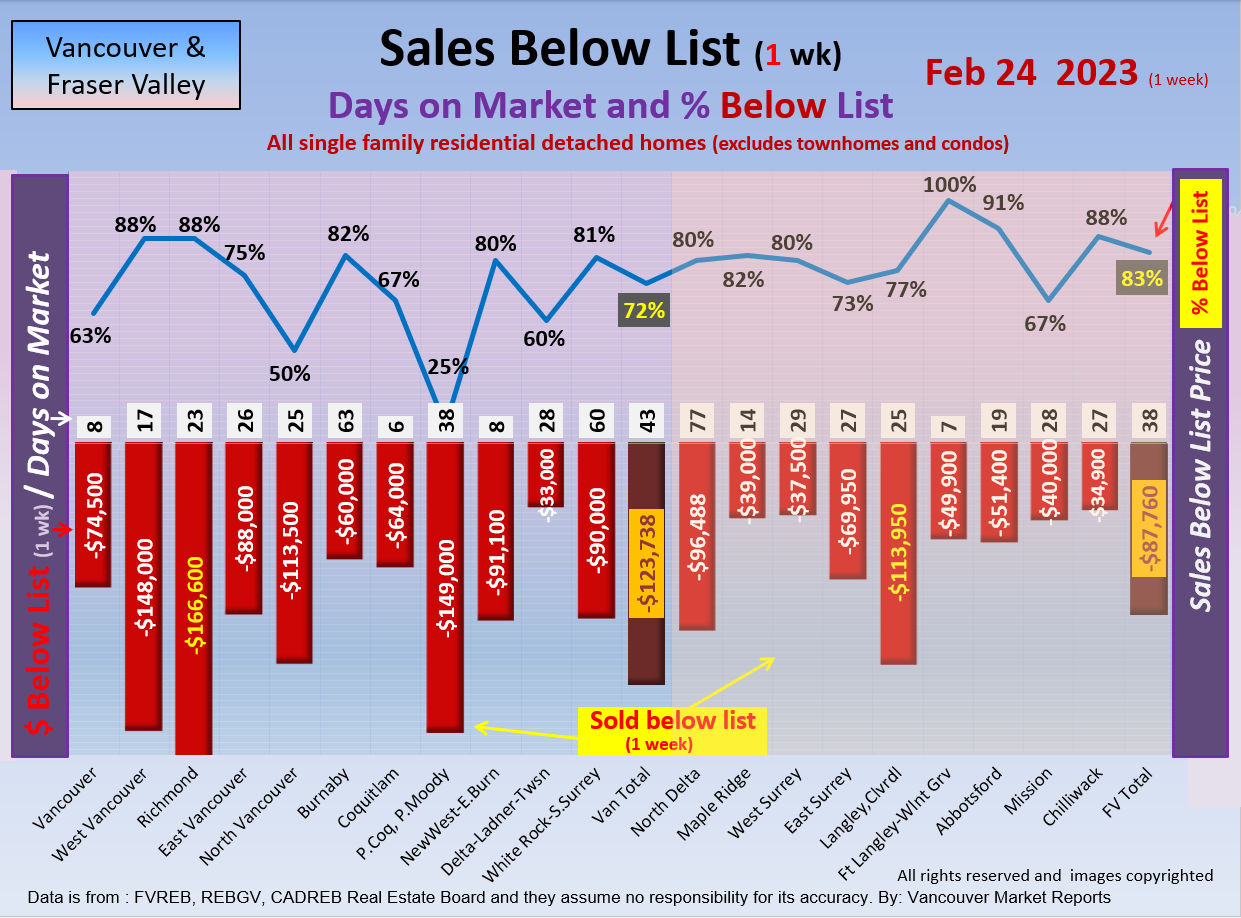
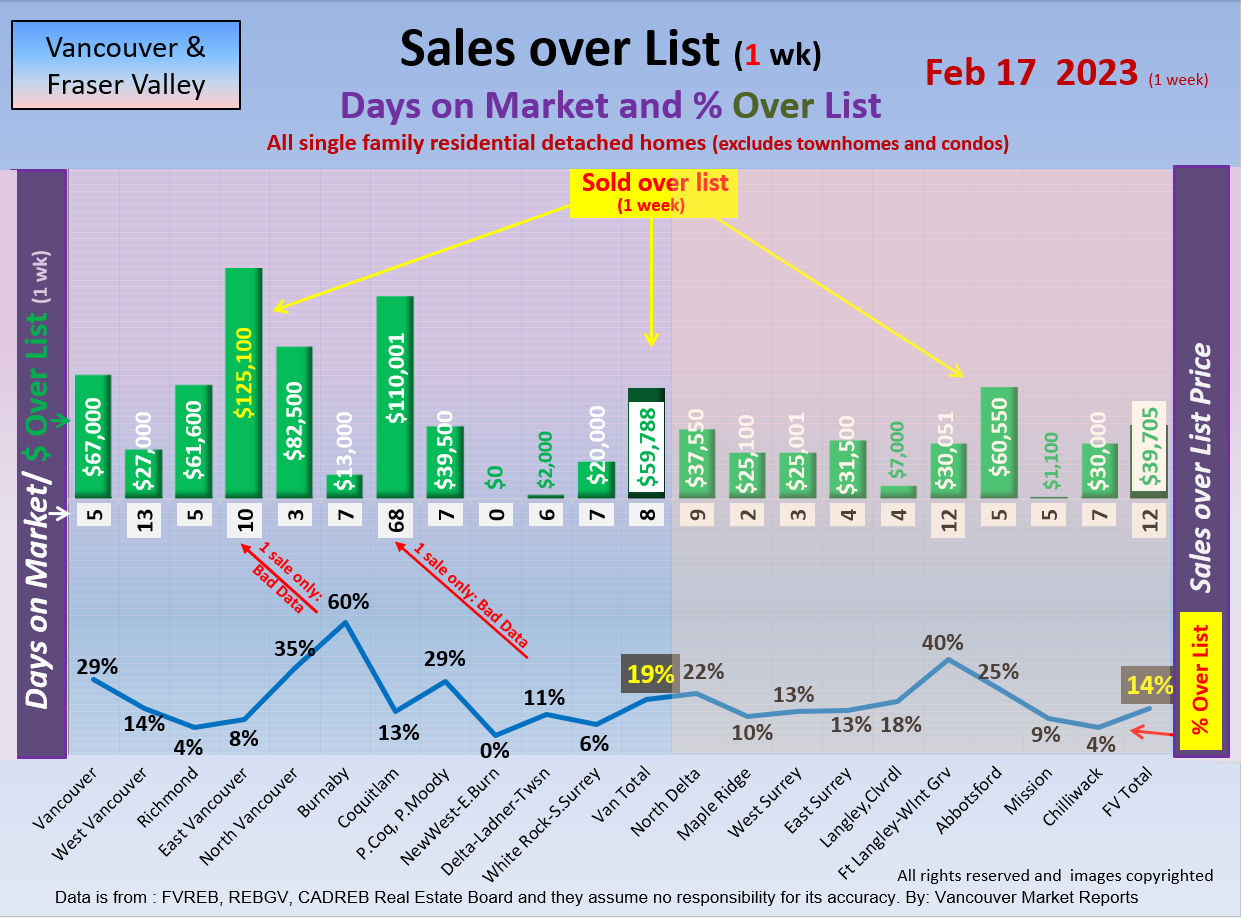
Do watch the money flow from Vancouver to Chilliwack every week!
 |
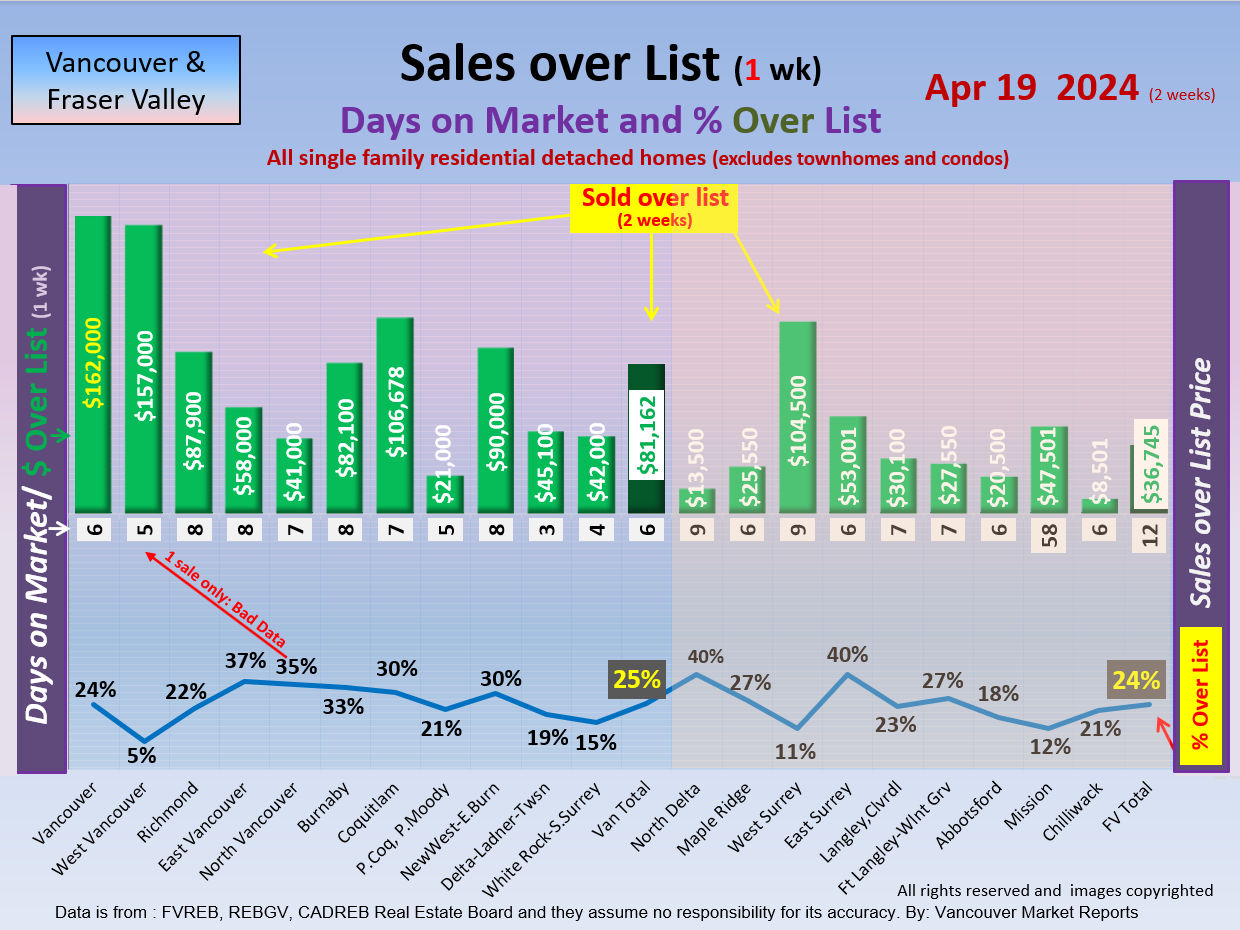
Vancouver Area Apr 18, 2025 (2-week Price Discount Update)
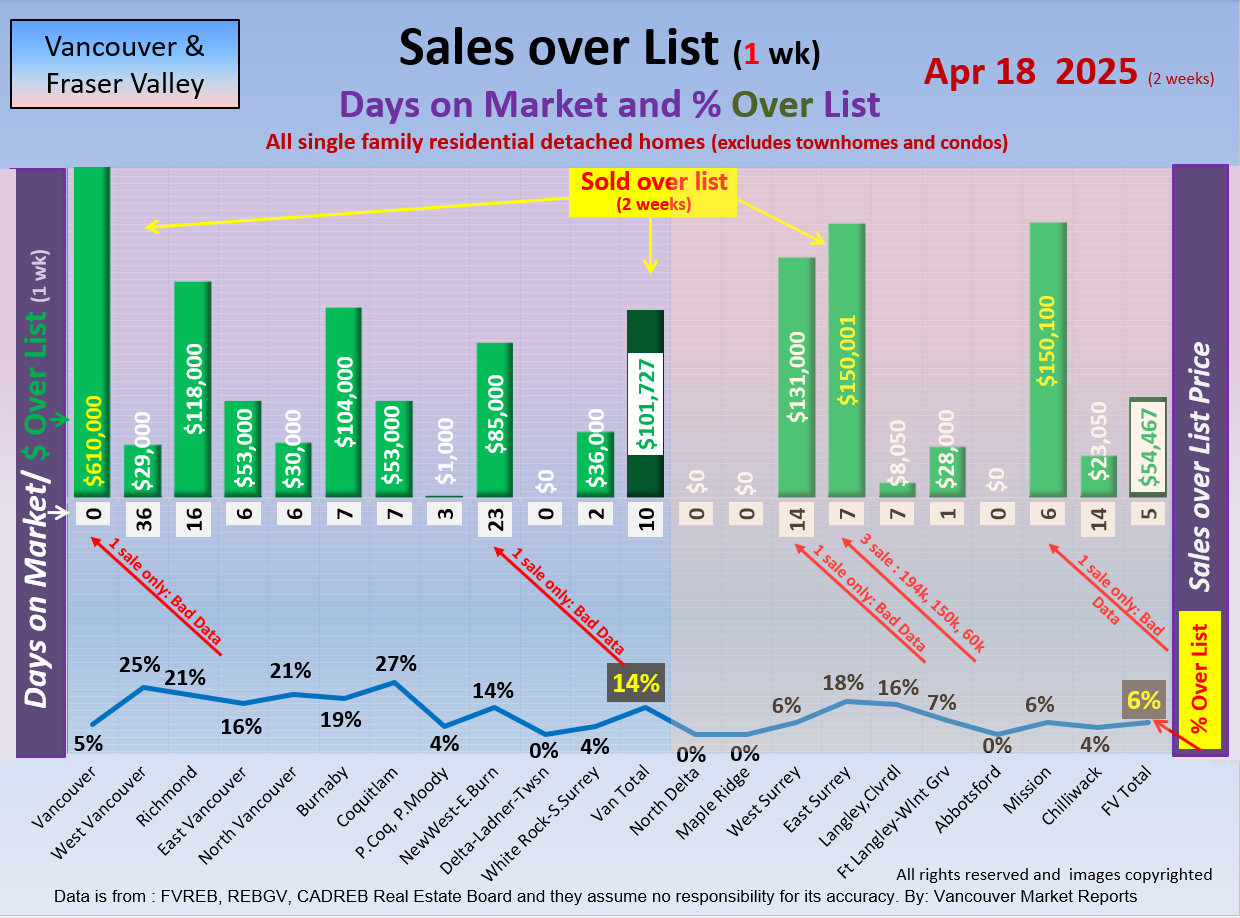
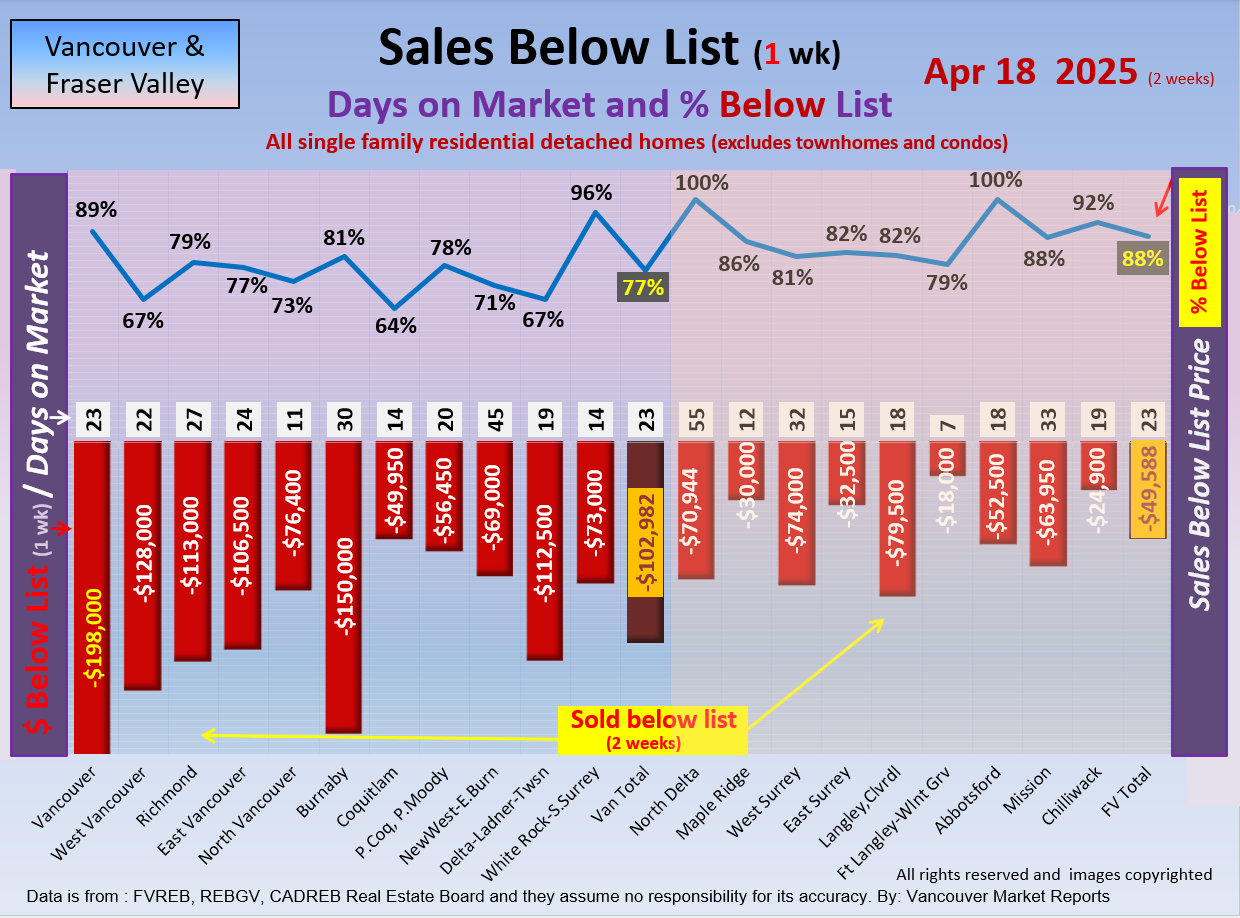
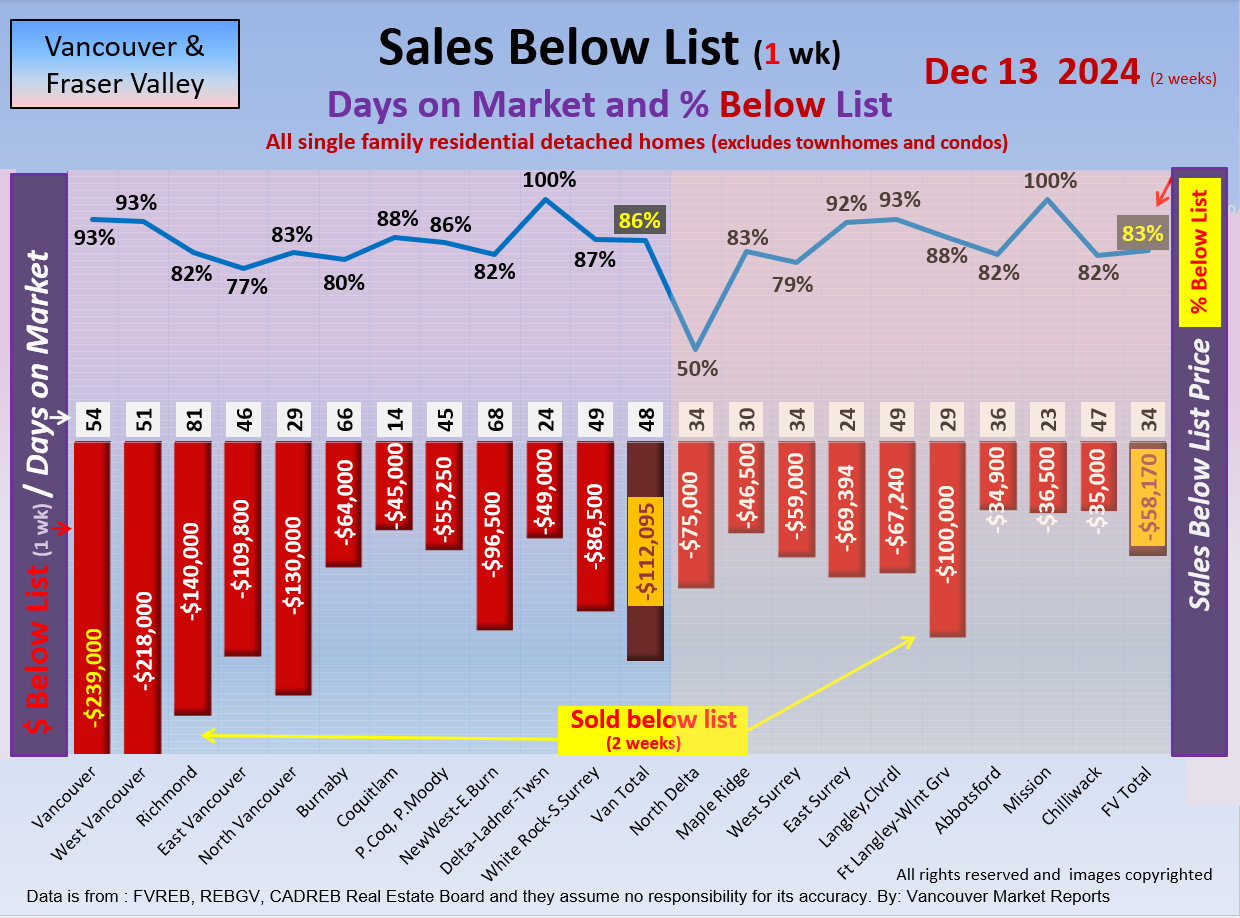
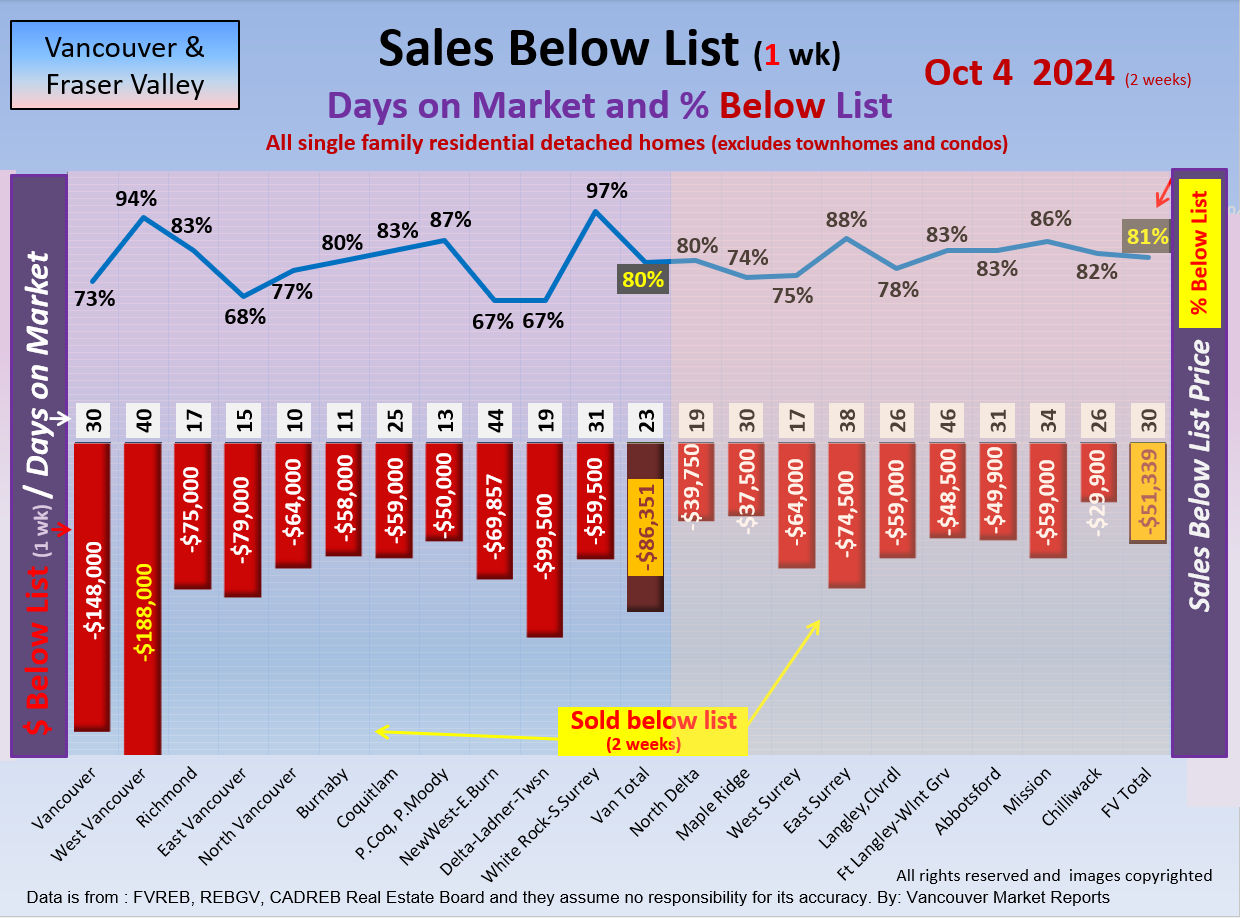
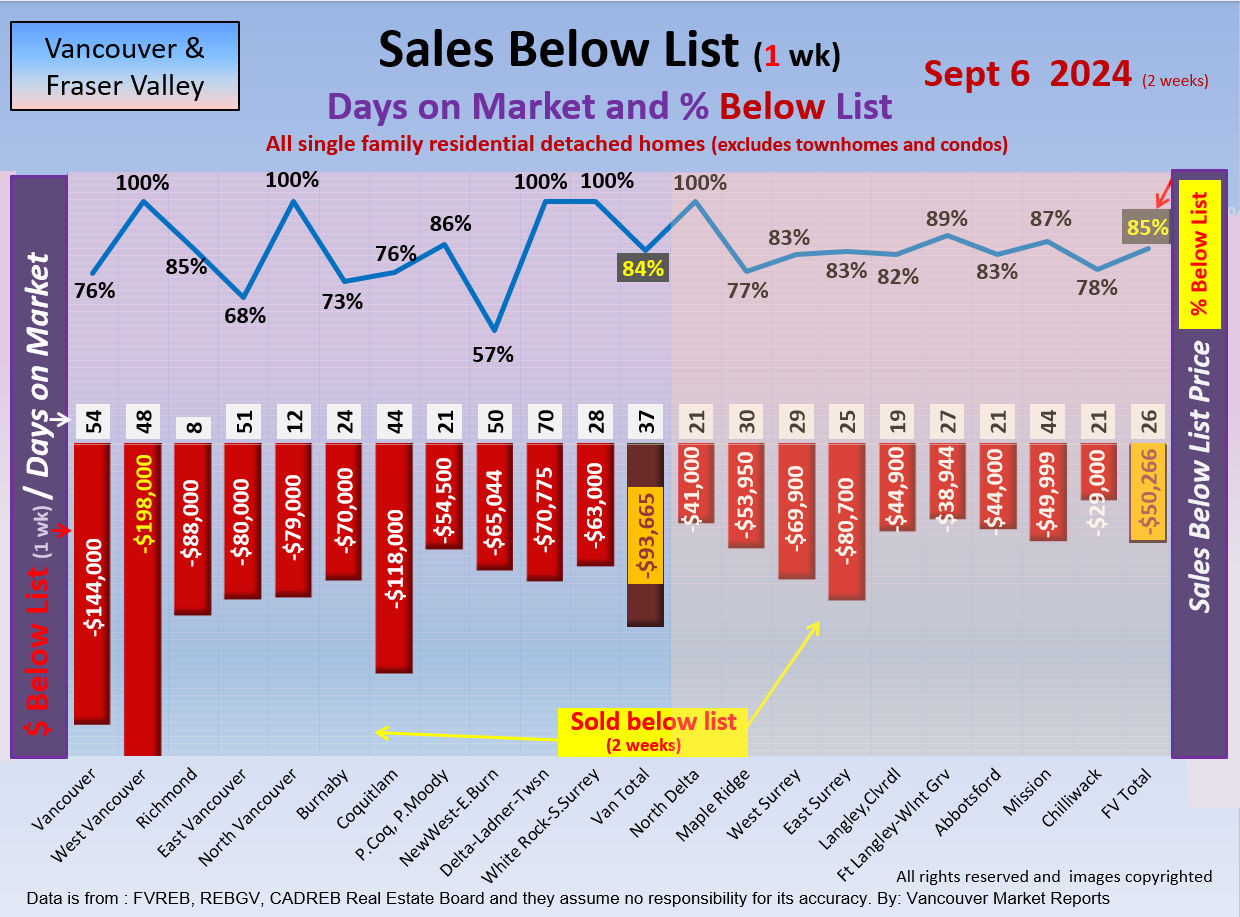
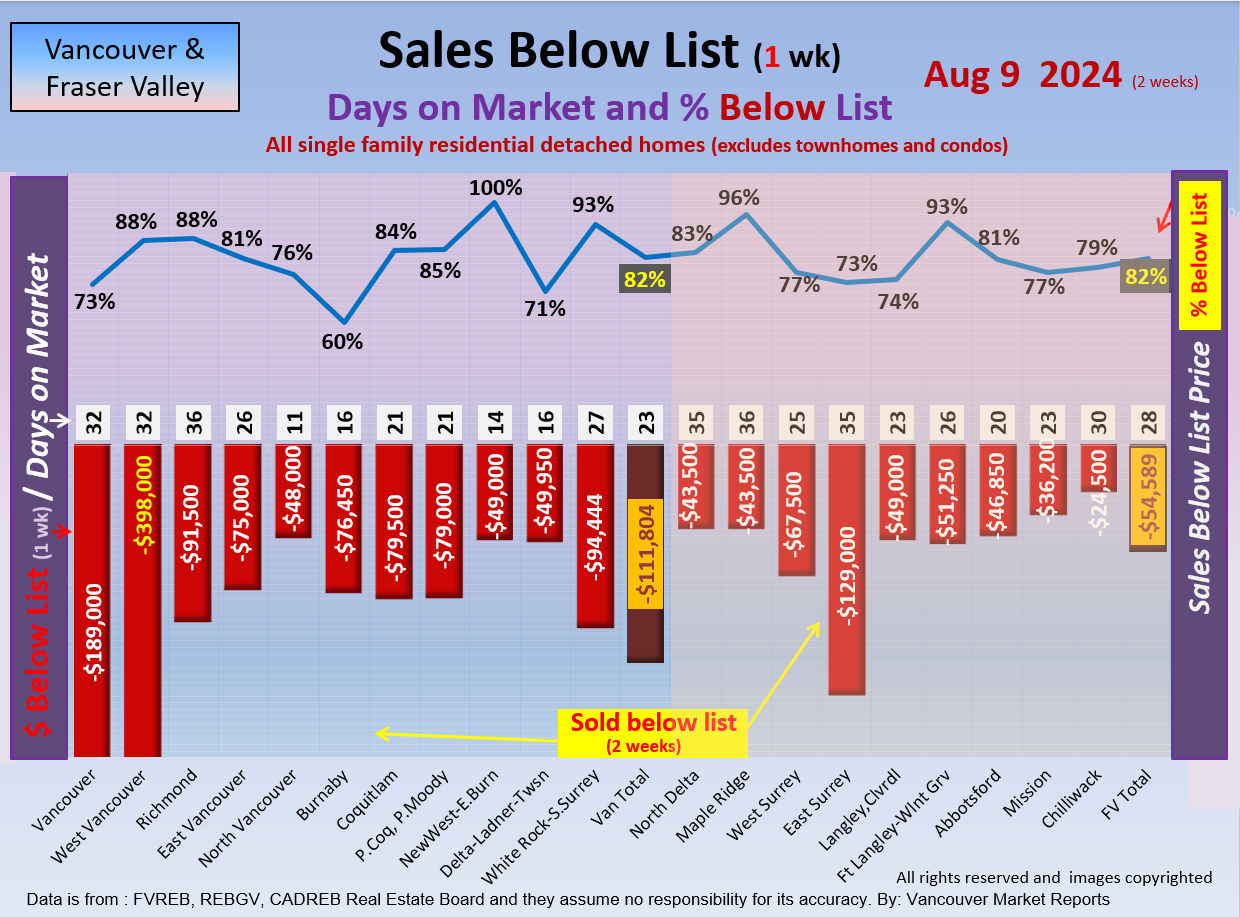
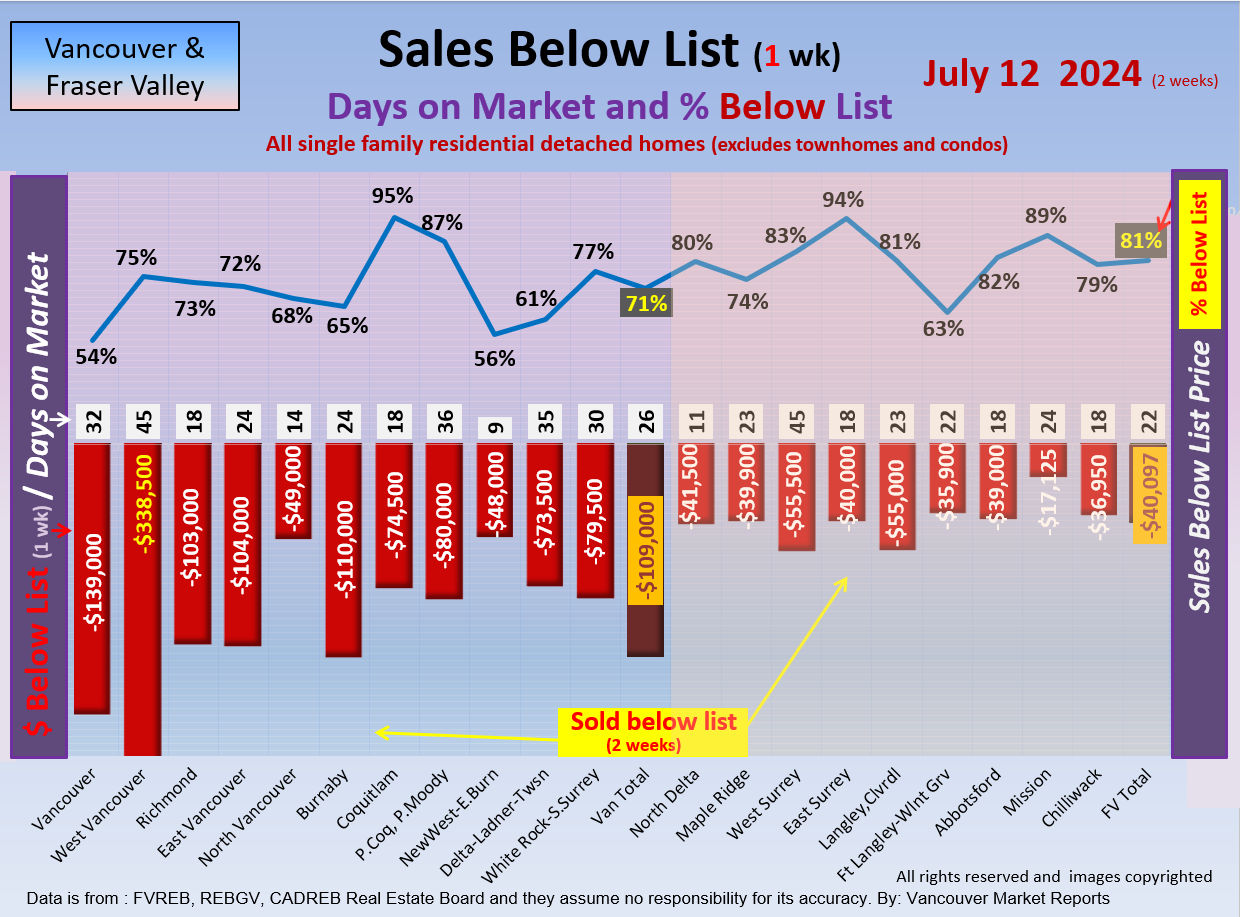
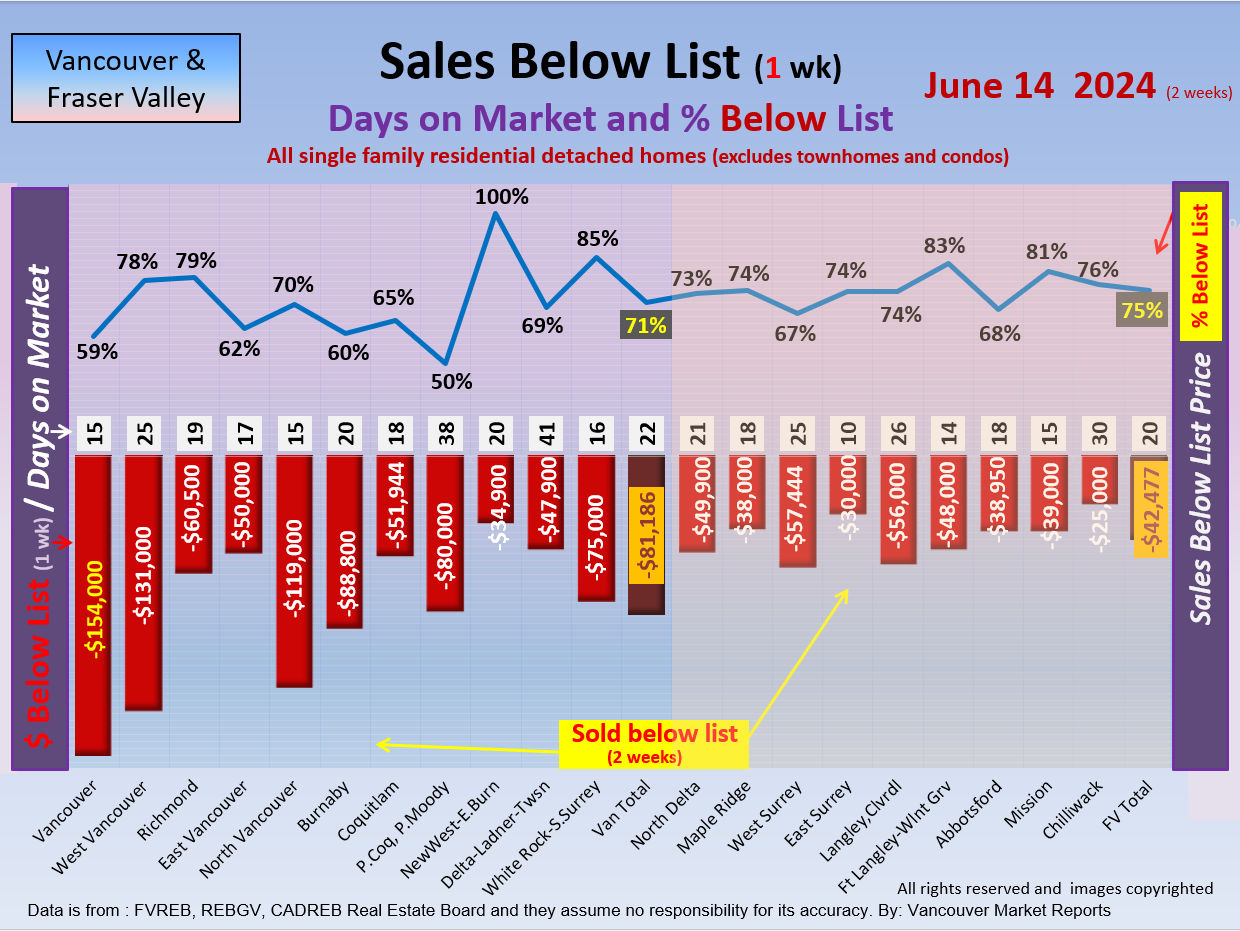
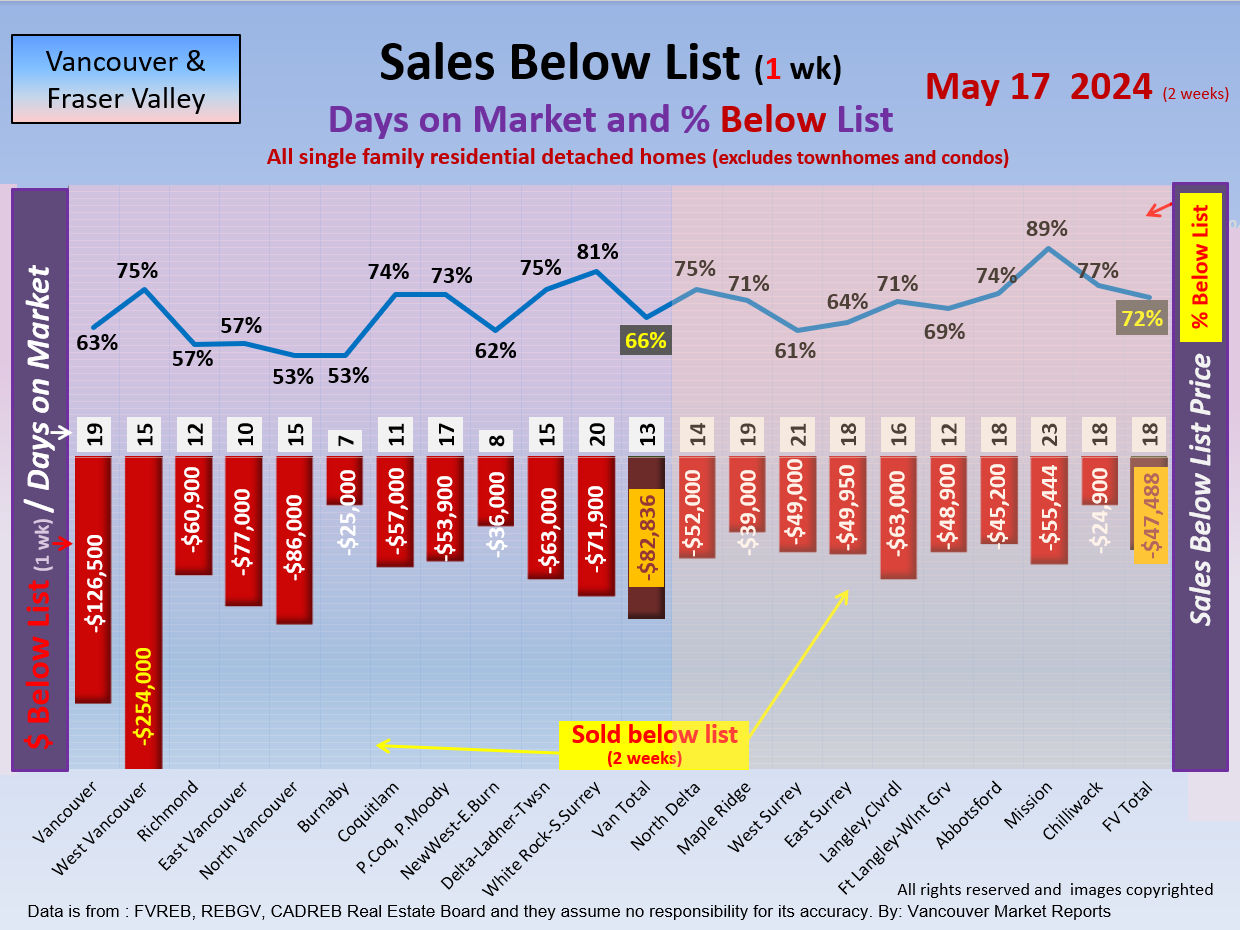
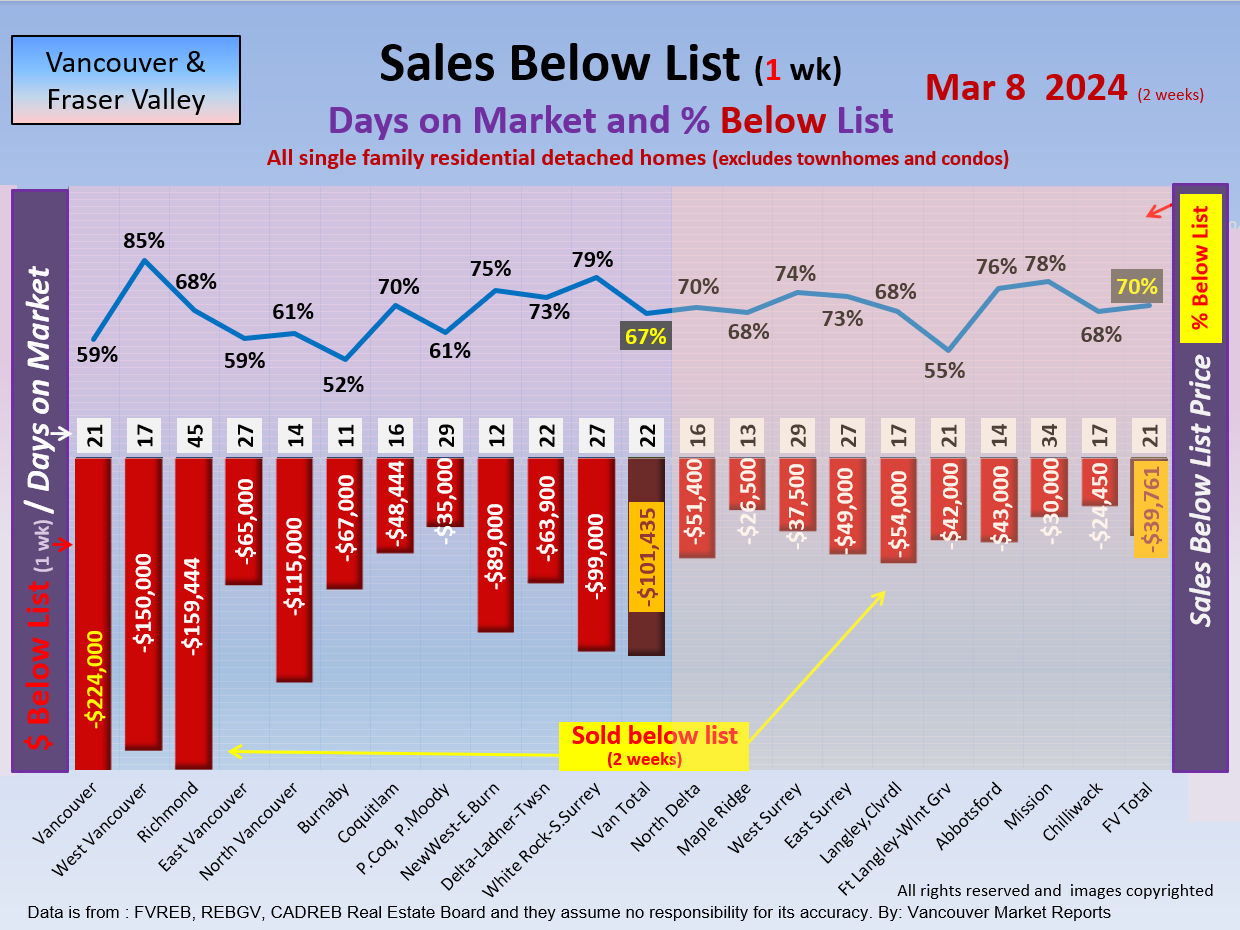
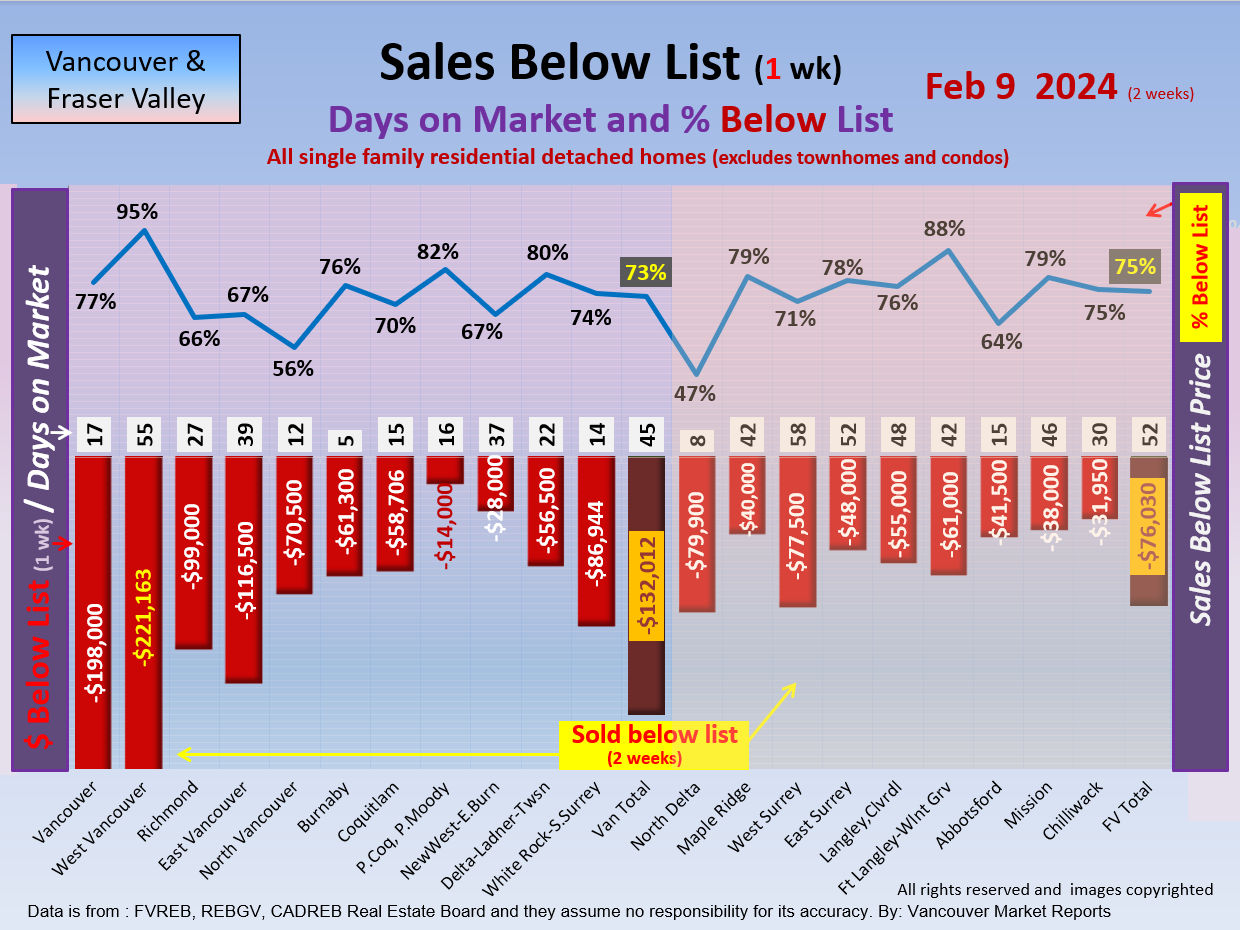
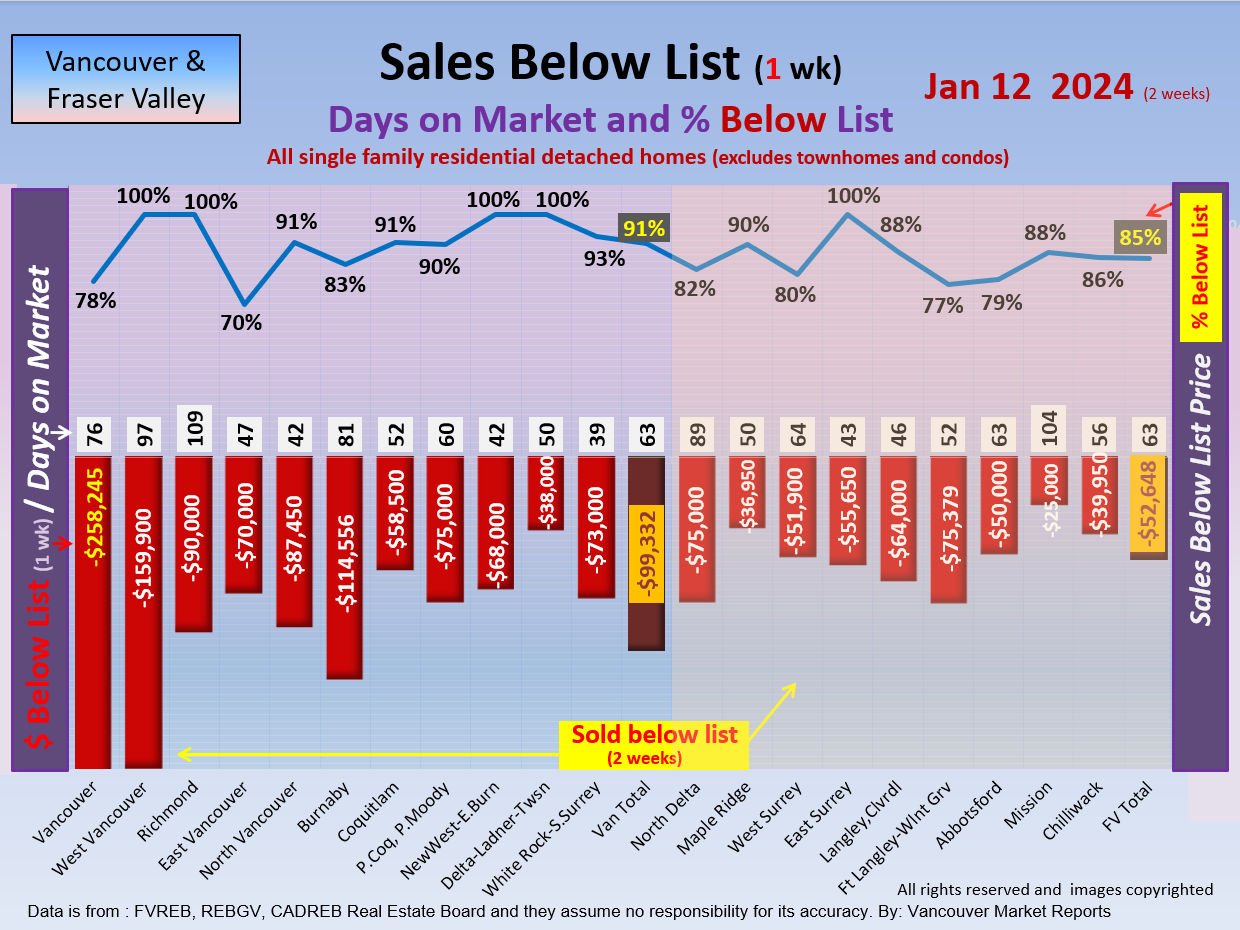
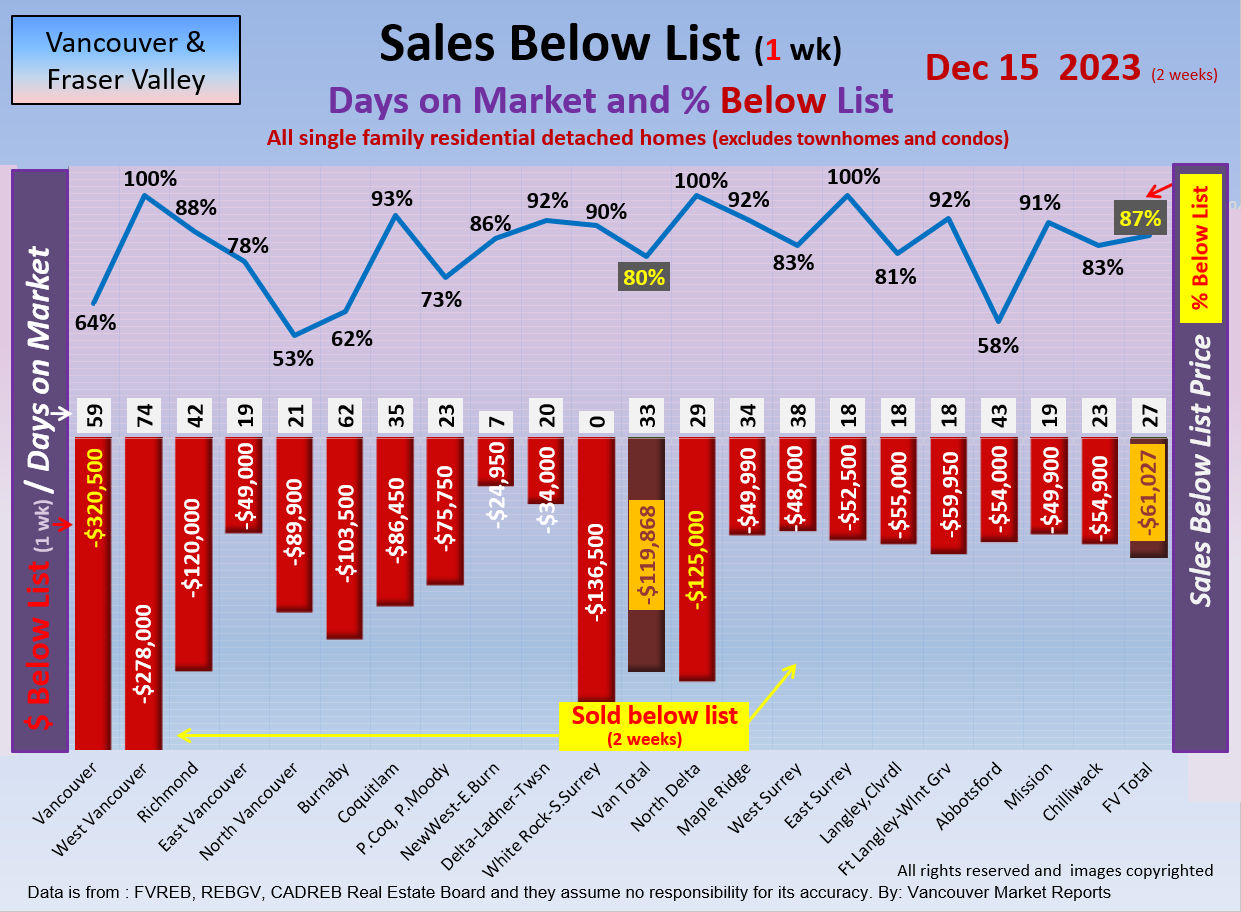
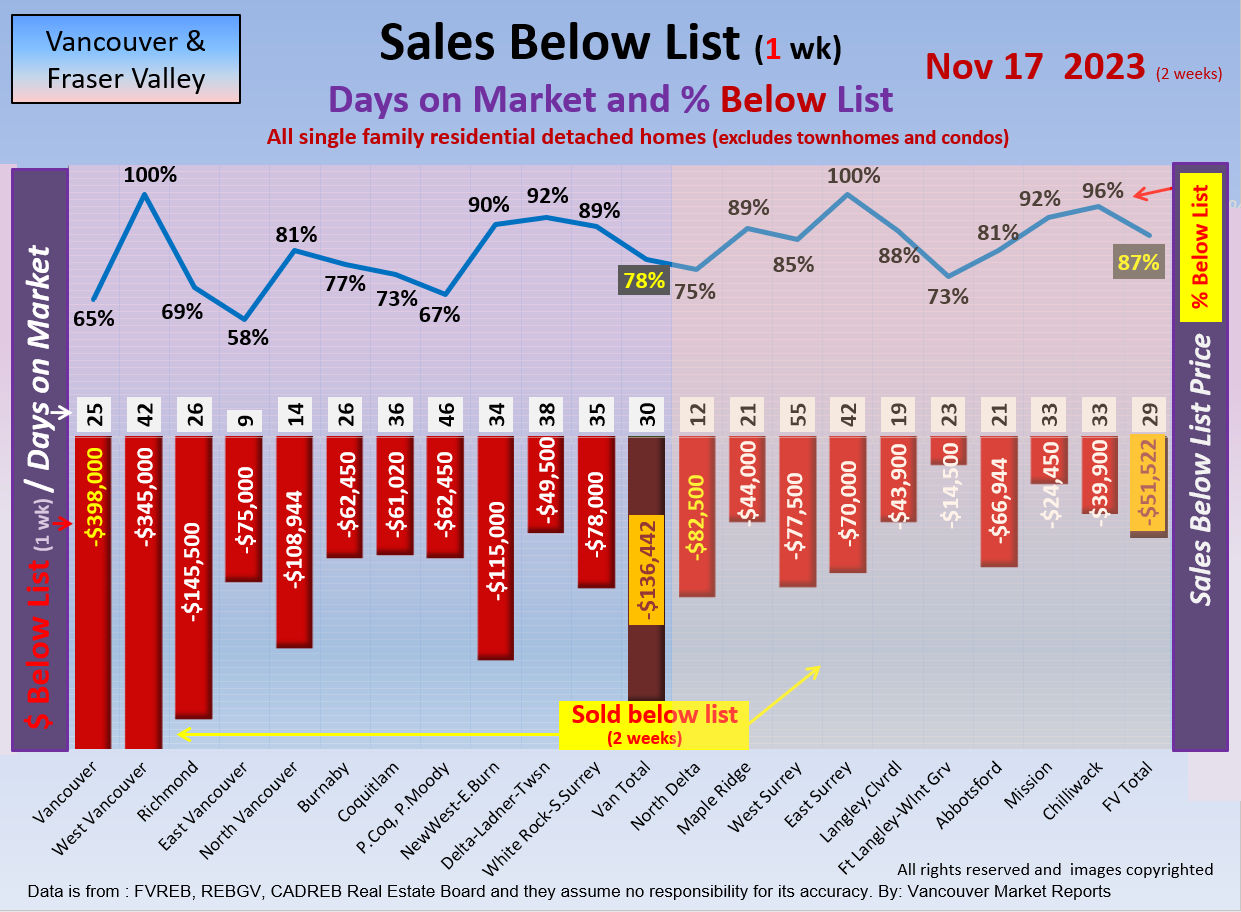
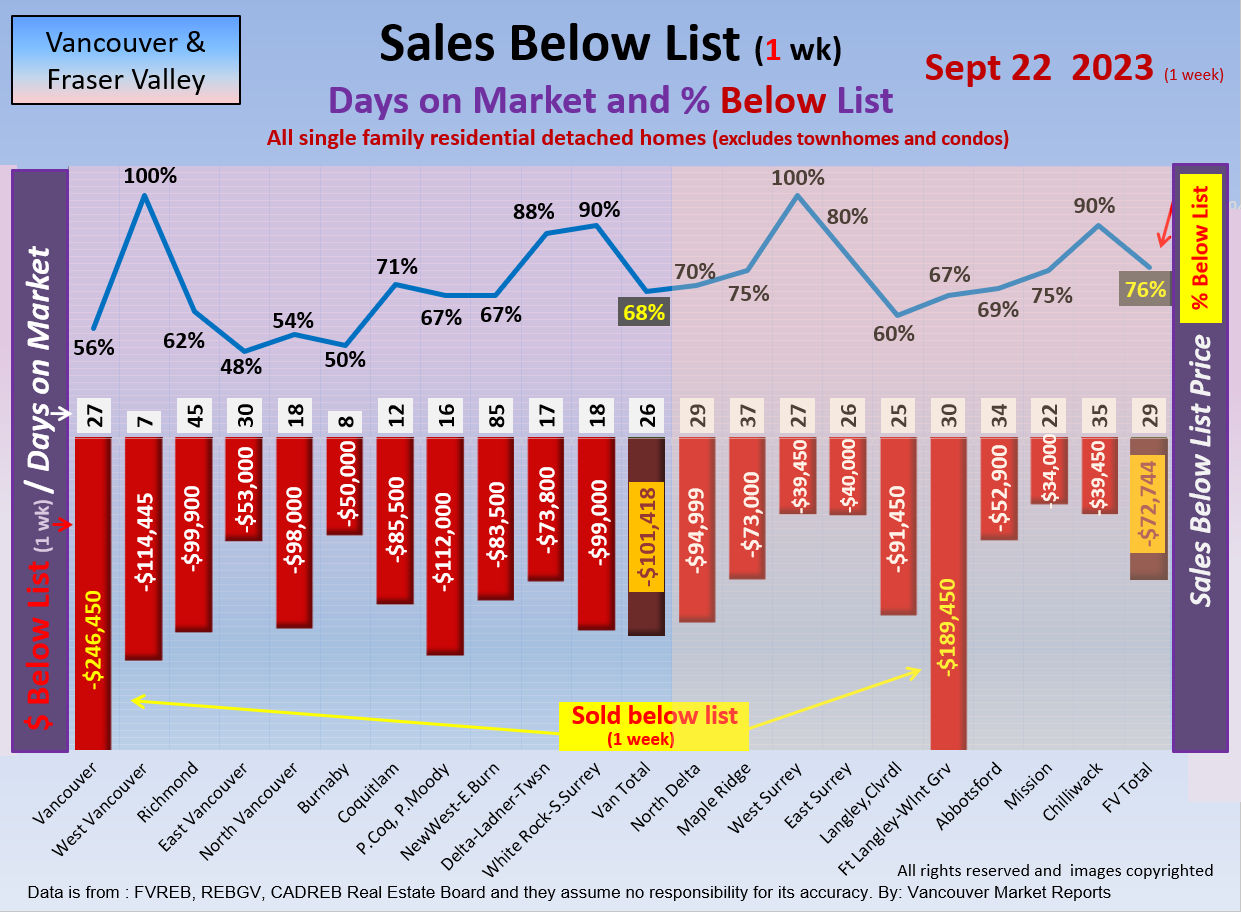
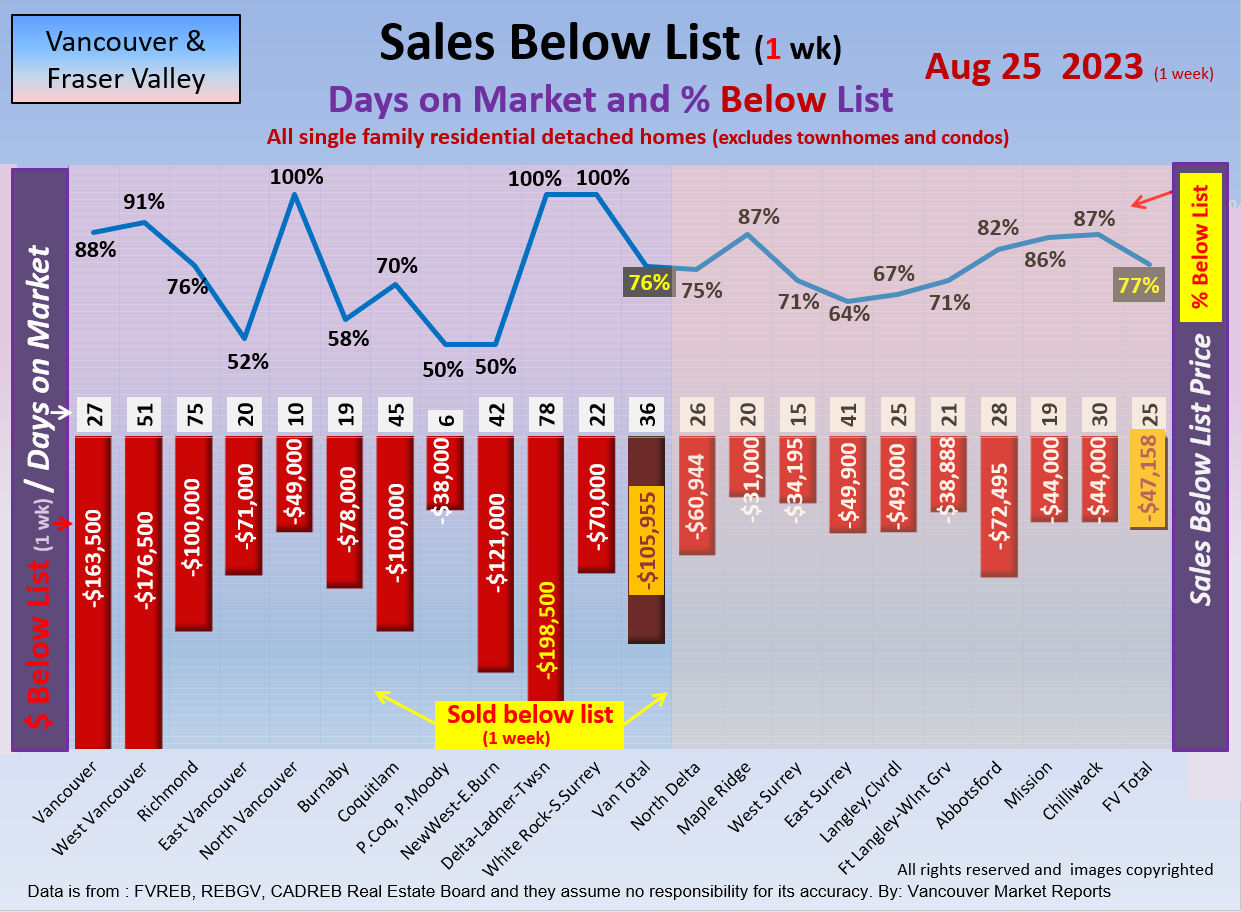
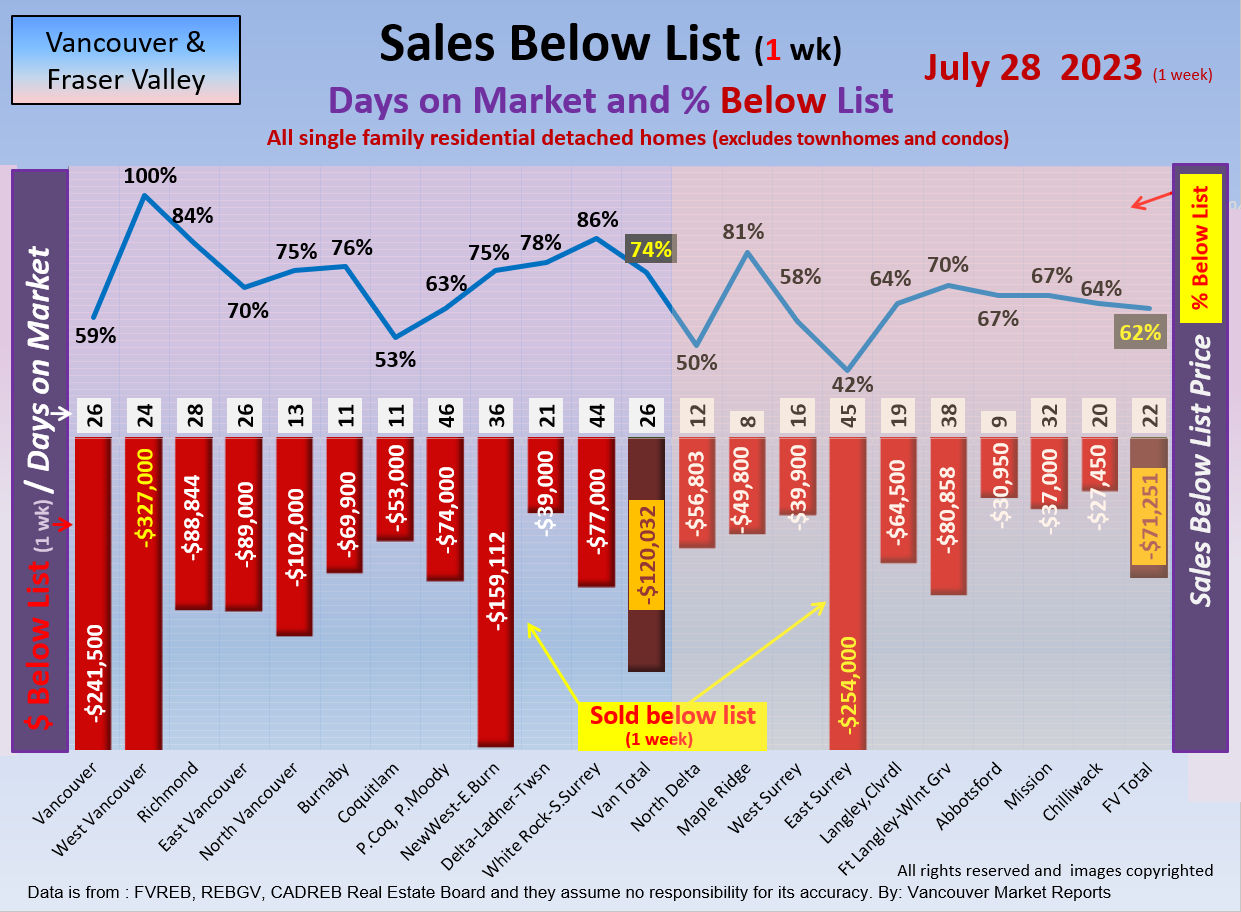
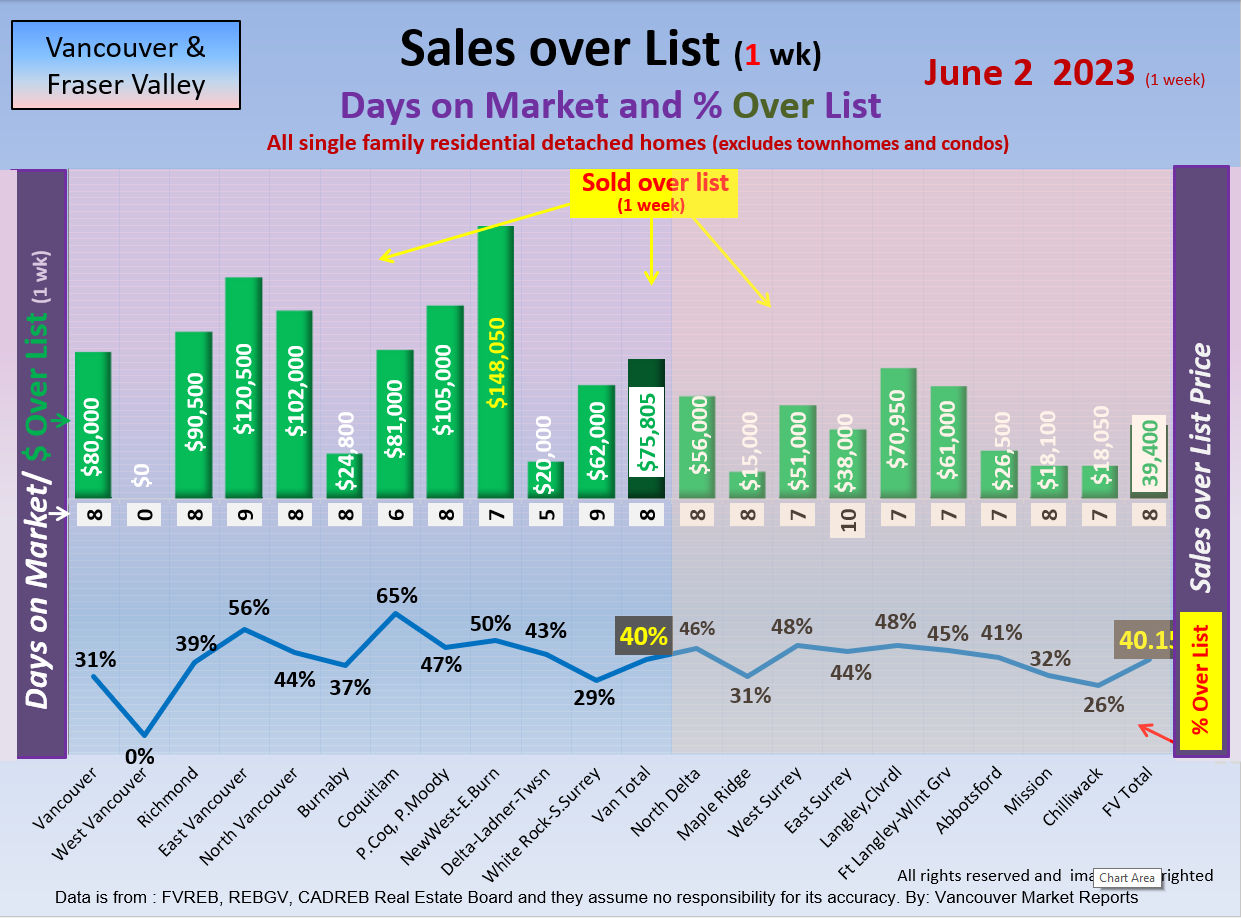
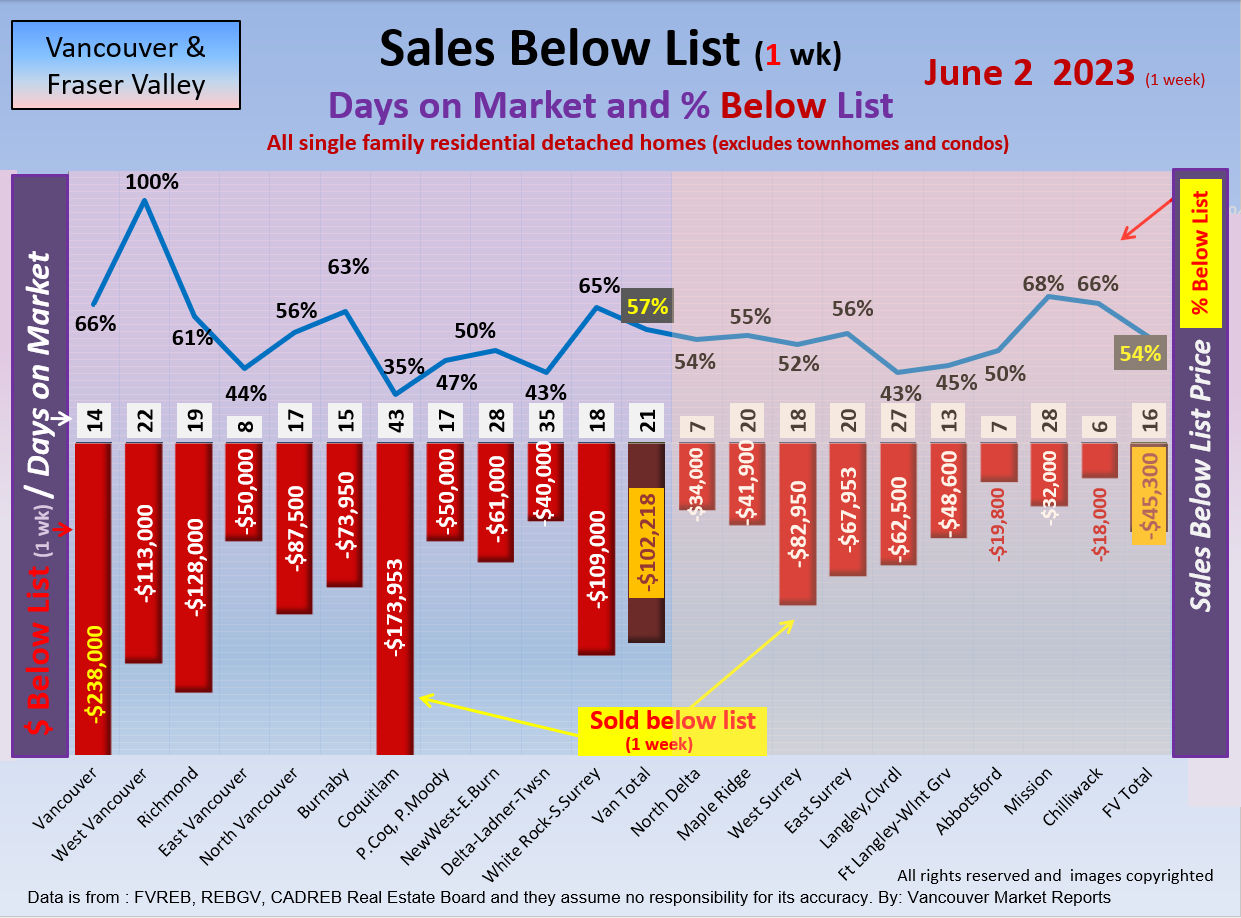
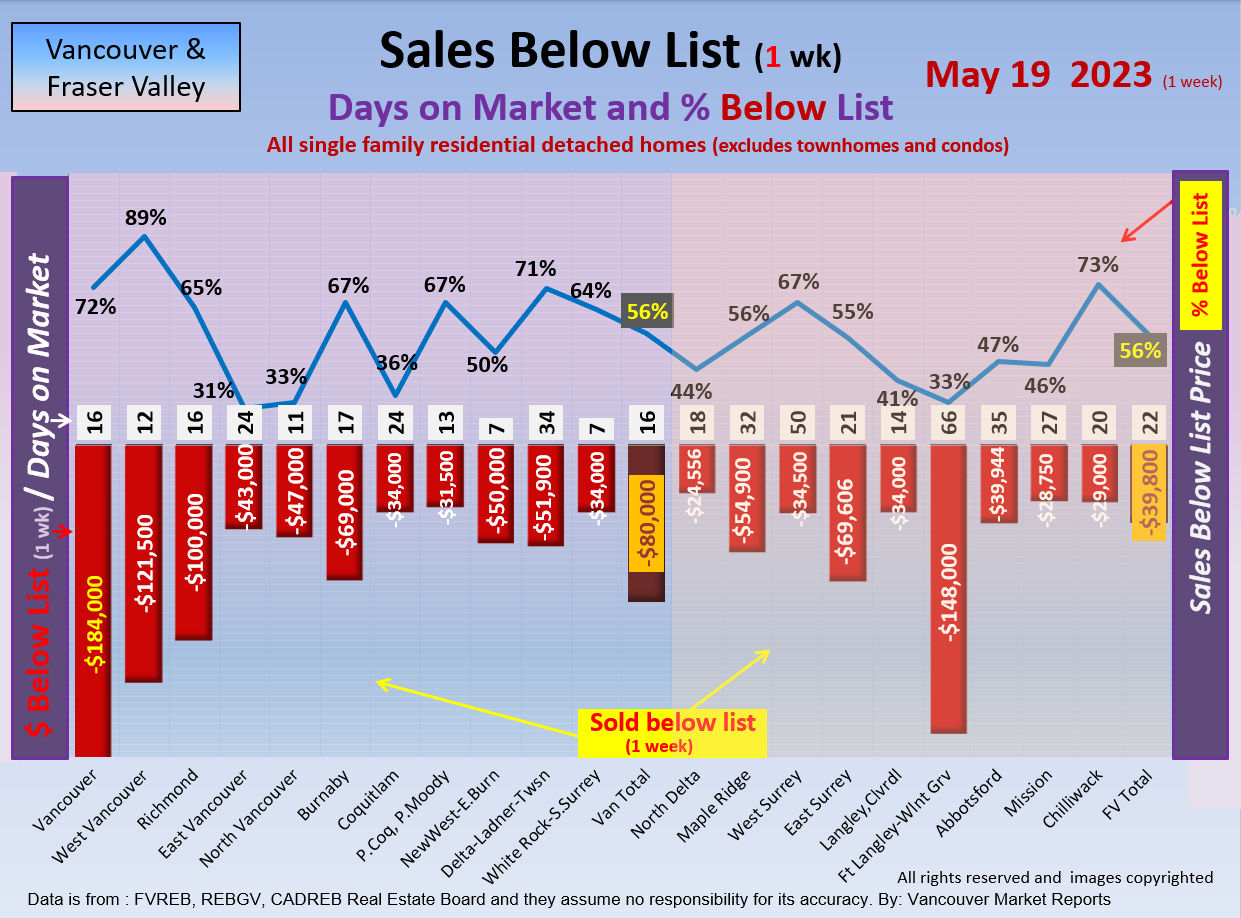
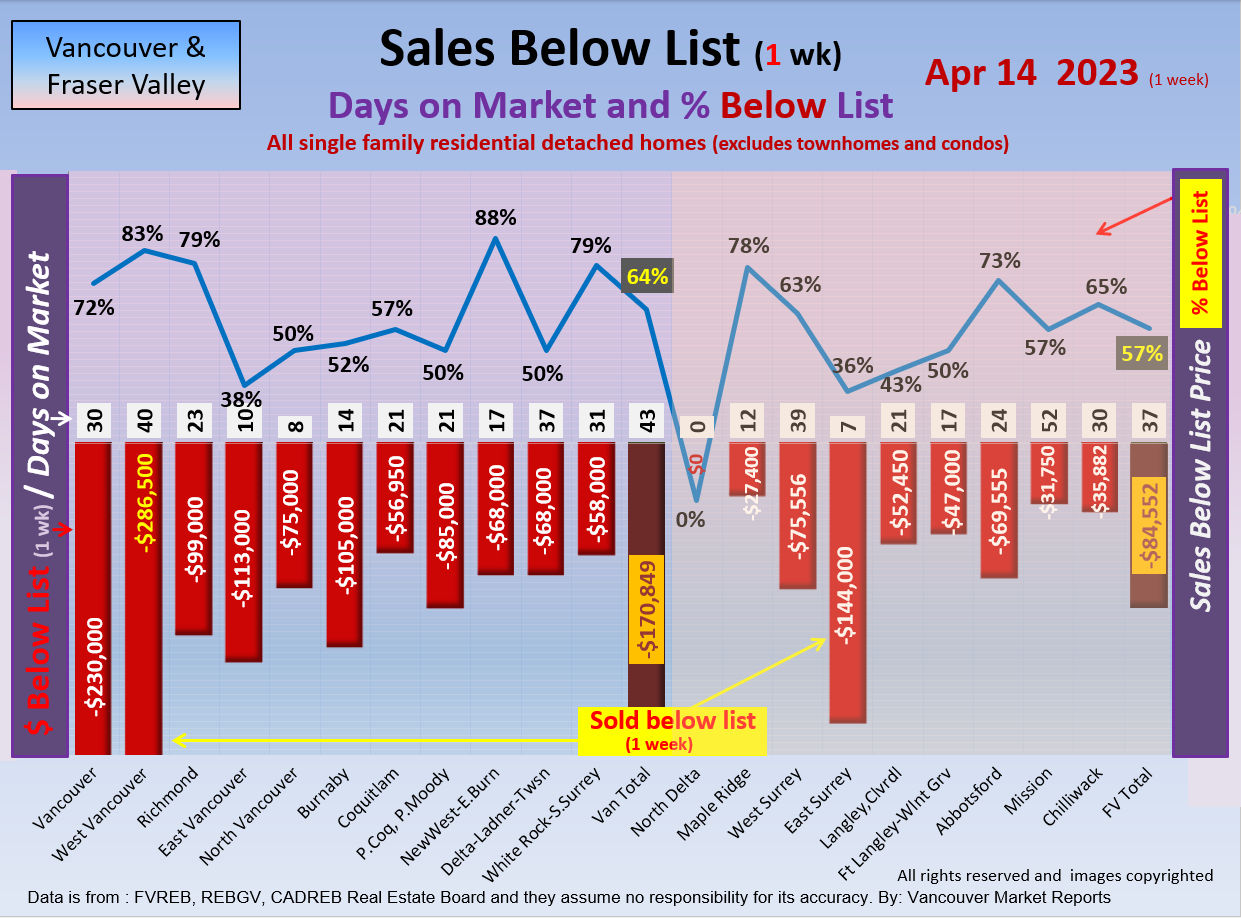
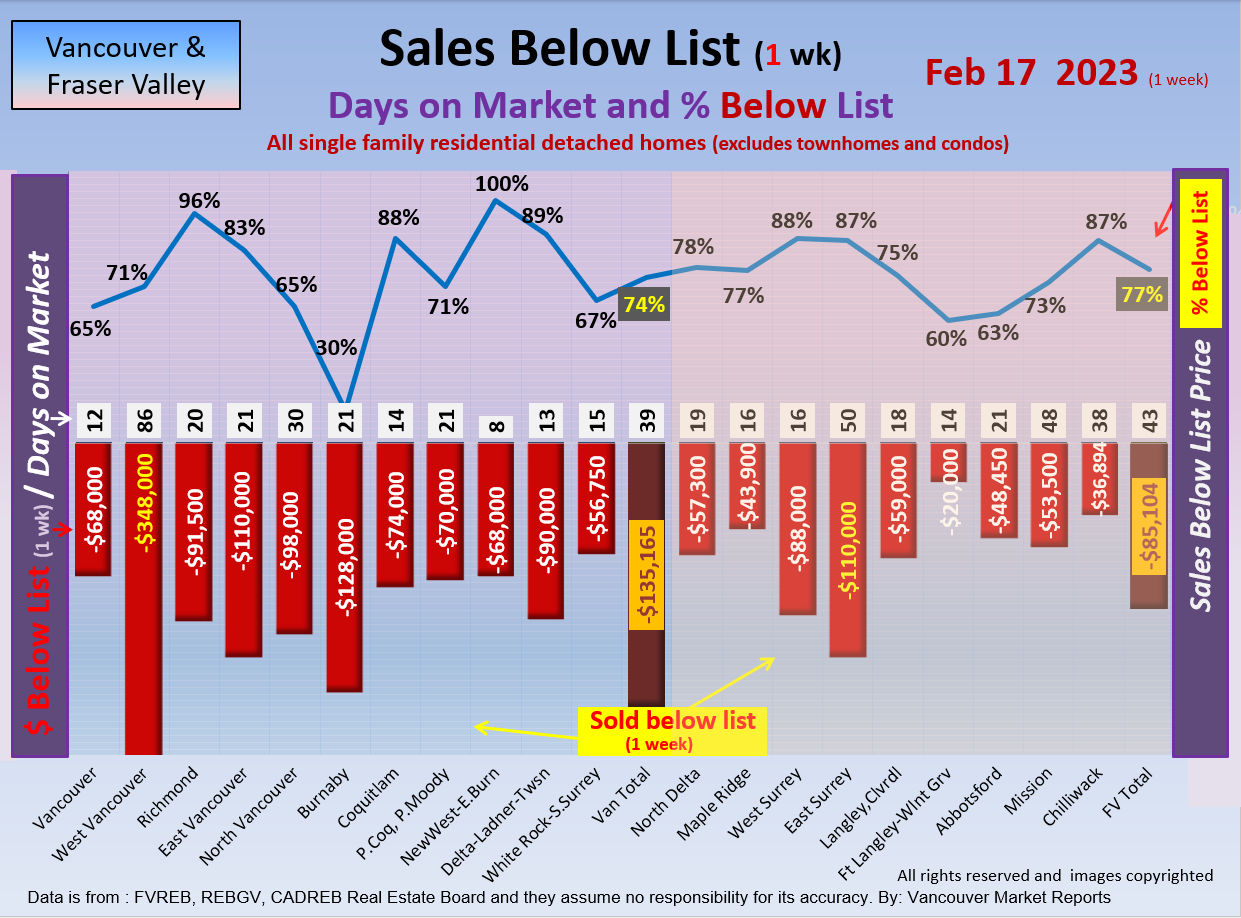
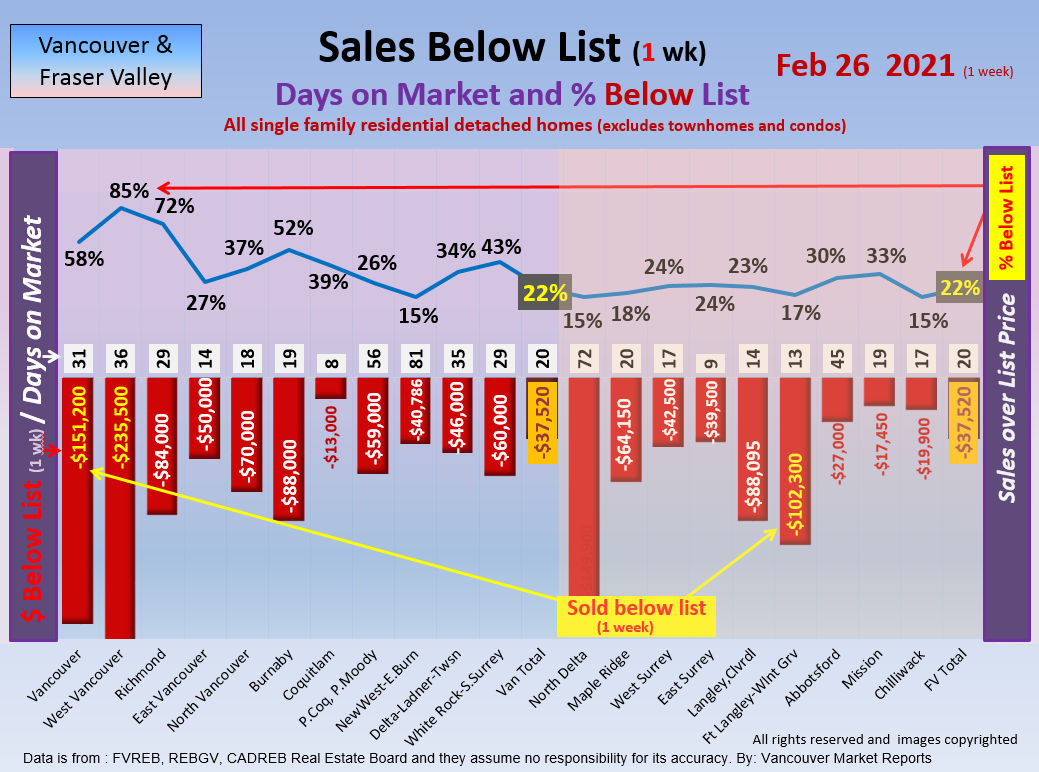
Current: In the Vancouver area last week, 77% of the Single Family Home Sold Listings reduced their List Price by the Average of $102,982.
This compares to the week before when 82% reduced their List Price by the Average of $95,736. Meanwhile, 11% of the listings sold over the list price by average of $74,004.
See each city for the full details.
Forecast: Greater Vancouver March 2025:
March Brings a Spark of Life to a Very Slow Market!
In March, 52% of single-family homes climbed in value. The average price rose by $1,506, a solid shift after that $4,022 drop we saw in February.
But watch out—the election fog is here. We forecast that many buyers and sellers will hit pause until it's over. That means we will slide into a buyer’s market across Metro Vancouver.
Condos? Our most affordable market saw a whopping 72% increase, with values climbing $3,320 on average. Townhouses didn’t get the same boost—the average price still dipped by $2,218. We forecast that condos and townhomes will level off or keep tipping in the buyer’s favour as we move through the election and the Trump Tariffs.
Want to know which markets are heating up—or cooling down? Check VancouverMarketReports.com every Saturday at noon to see the weekly changes. 📞 Need expert advice or a free Home Market Analysis? Call Bill Coughlin and the Coughlin Team at 778-374-3744. Let’s help you make the right move.
Fraser Valley March 2025:
March Brings a Spark of Life to a Very Slow Fraser Valley Market!
In March, 61% of detached homes went up in value. On average, single-family homes increased by $1,066, which is a nice change after the $5,136 drop in February.
But watch out—the election fog is here. We forecast that many buyers and sellers will hit pause until it's over. That means we will slide into a buyer’s market across Metro Vancouver.
Condos? Our most affordable market saw a 67% of them went up in price, with an average increase of $1,483. Townhouses didn’t get the same boost—the average price still dropped by $1,486. We forecast that condos and townhomes will level off or keep tipping in the buyer’s favour as we move through the election and the Trump Tariffs.
Want to know which markets are heating up—or cooling down? Check VancouverMarketReports.com every Saturday at noon to see the weekly changes. 📞 Need expert advice or a free Home Market Analysis? Call Bill Coughlin and the Coughlin Team at 778-374-3744. Let’s help you make the right move.
Fraser Valley & Chilliwack Apr 18, 2025 (2-week Price Discount Update)
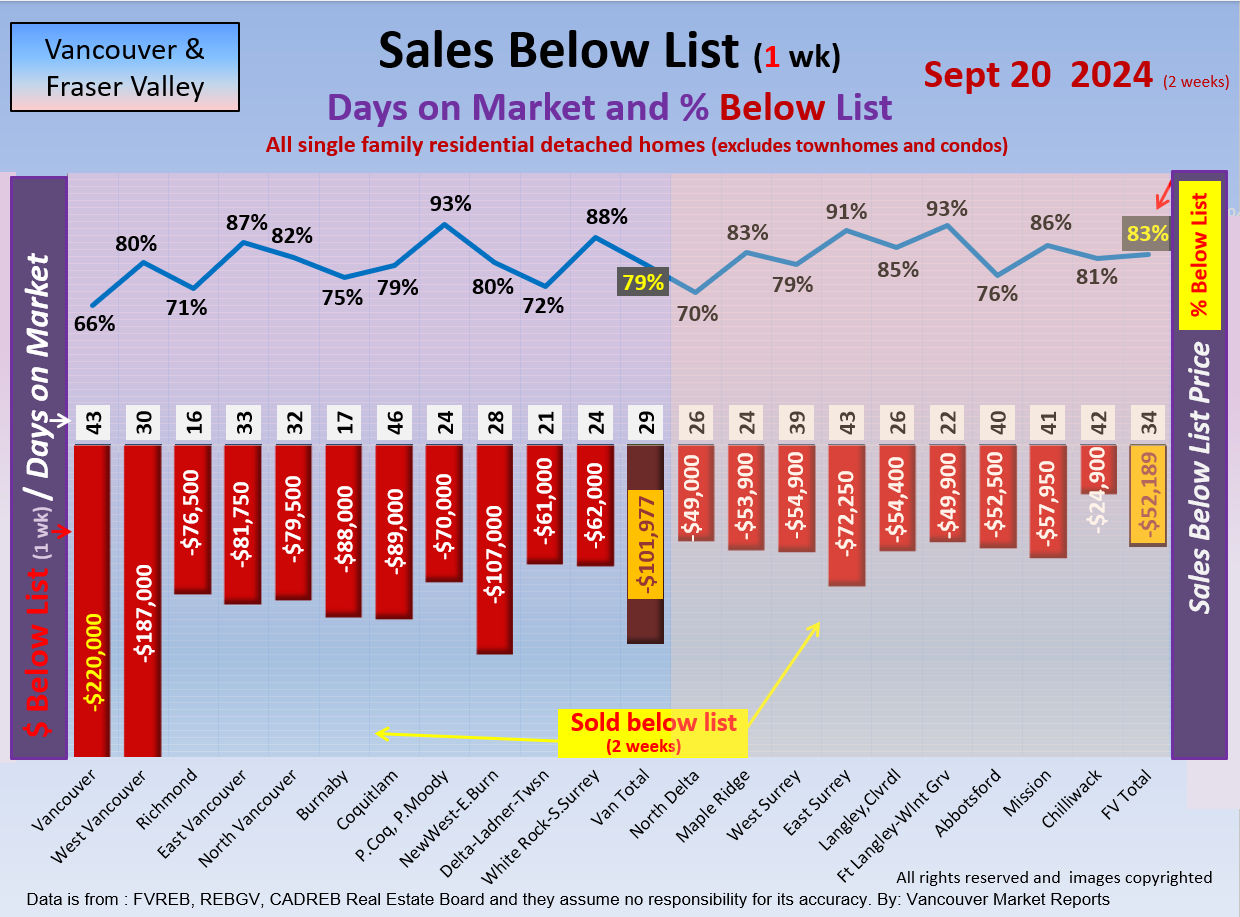
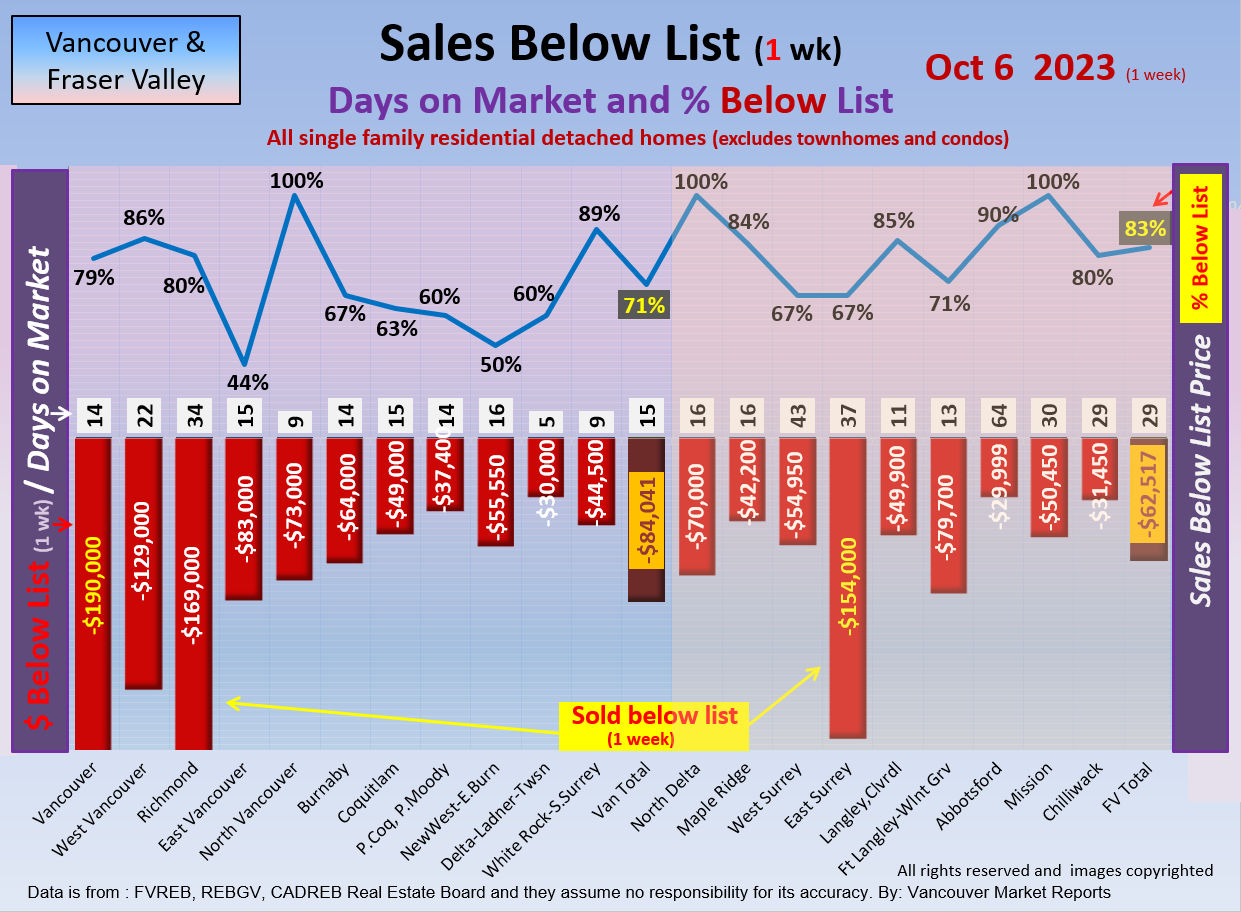
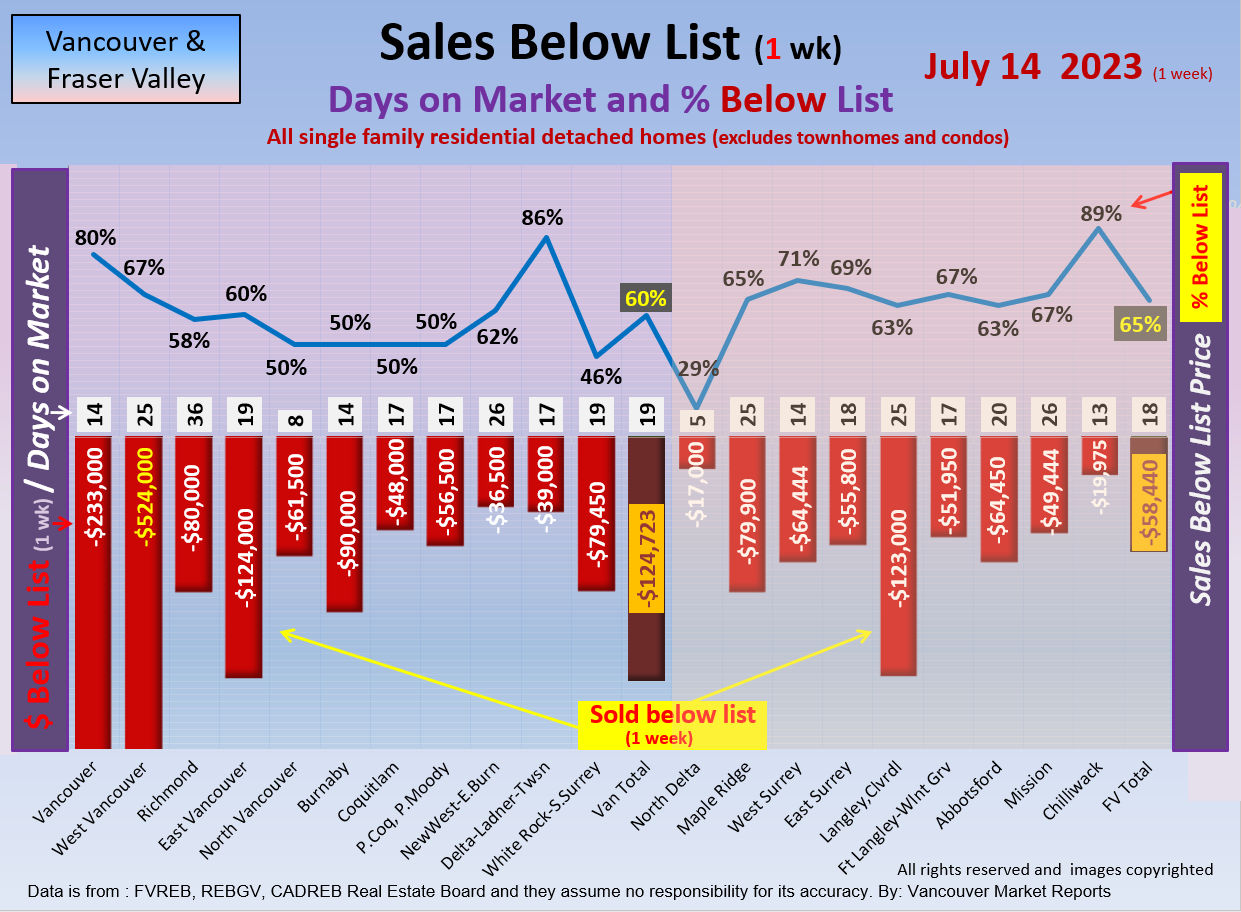
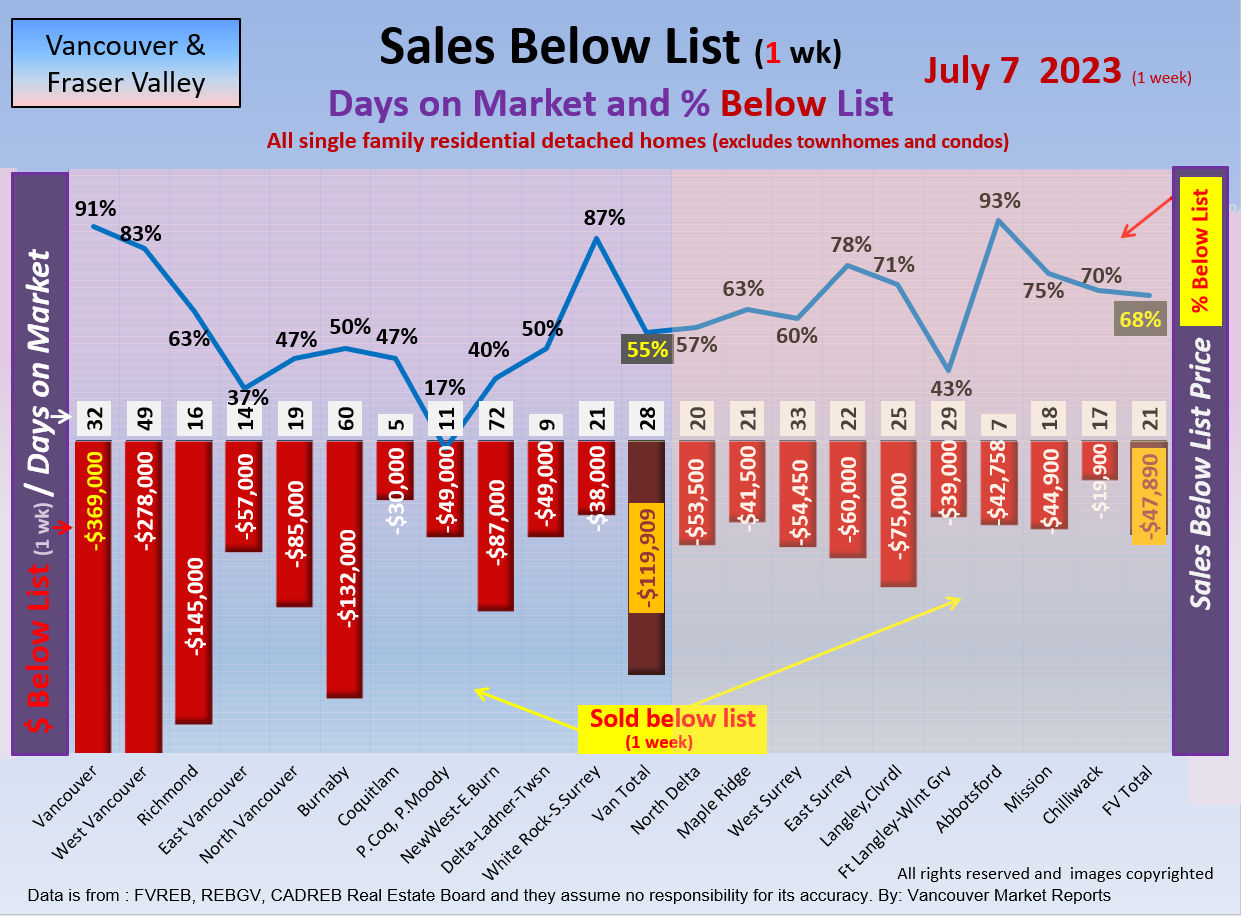
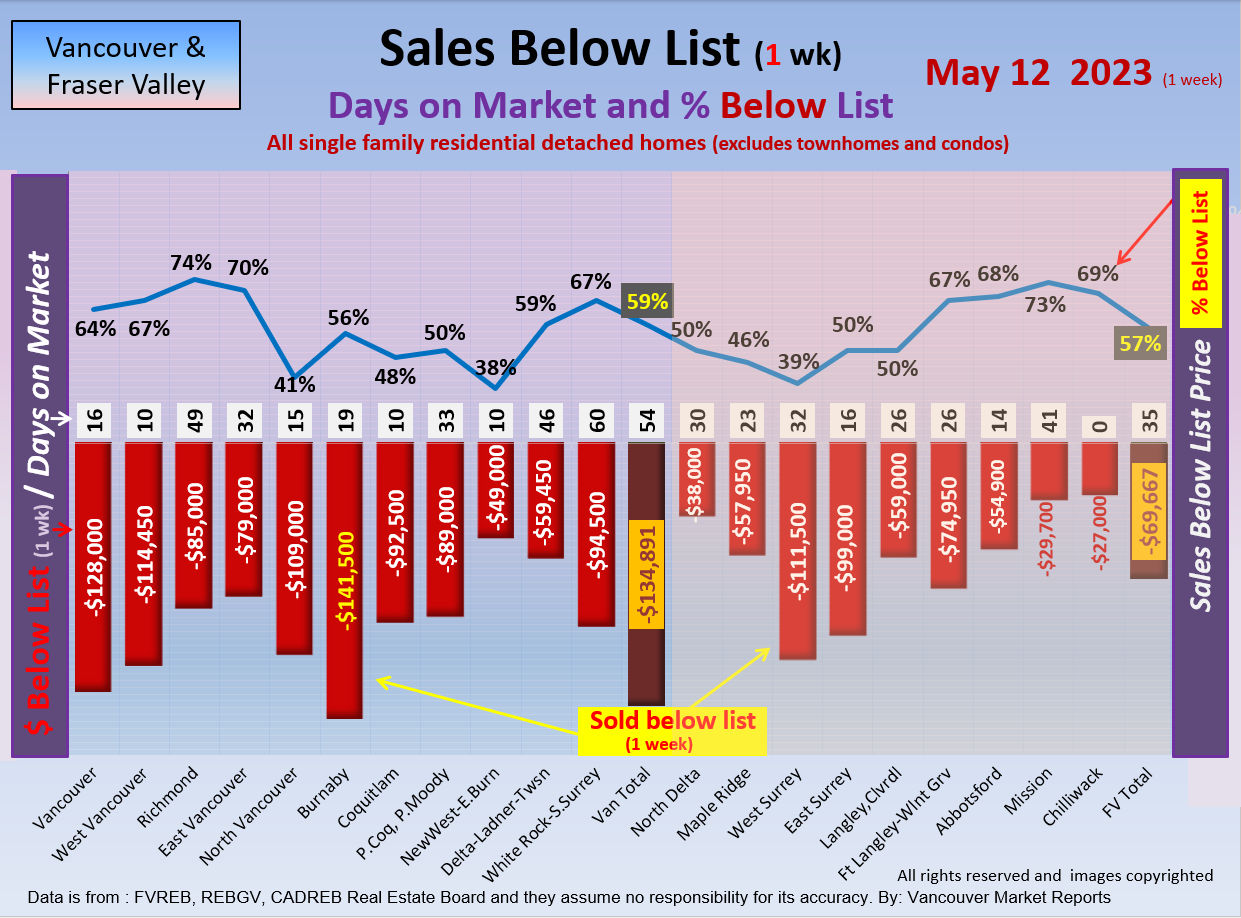
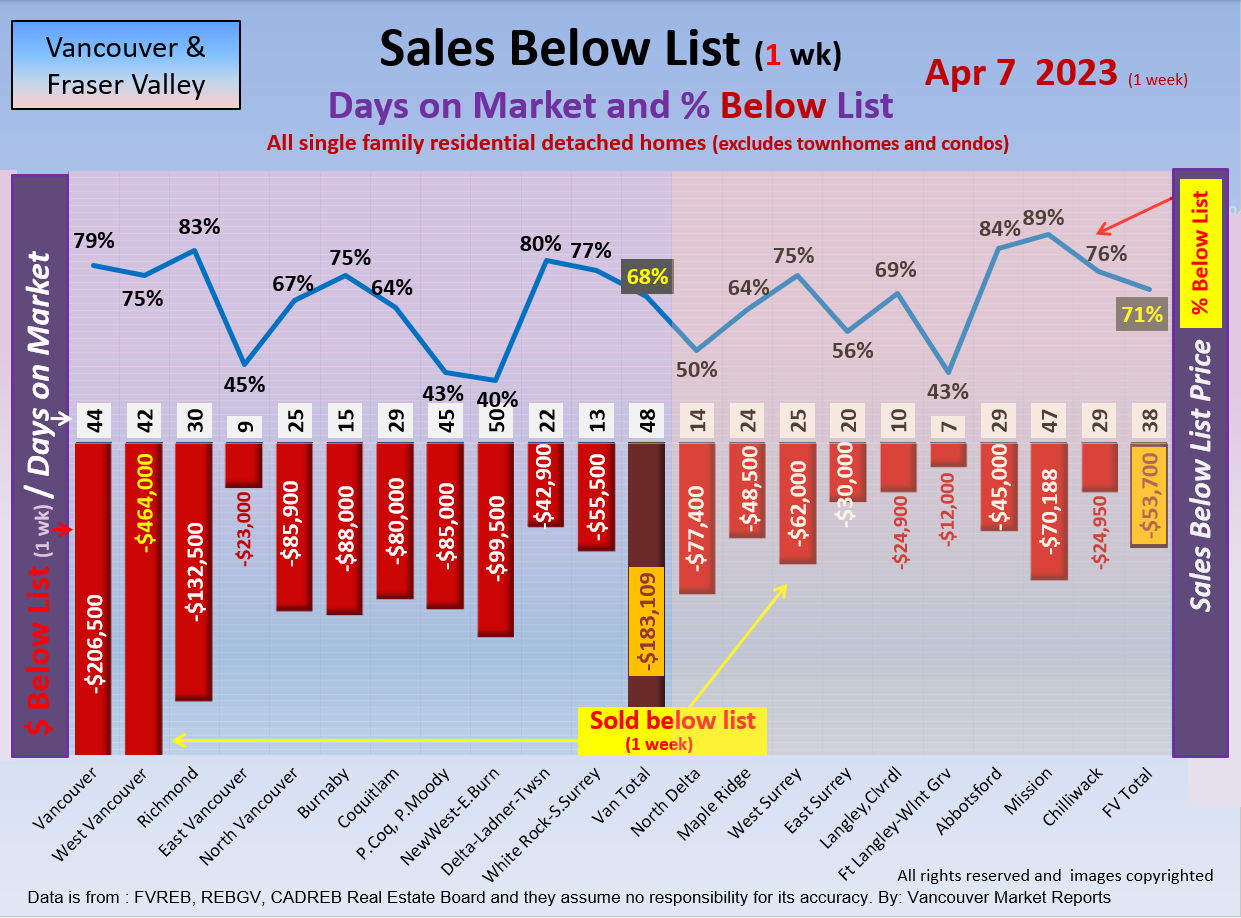
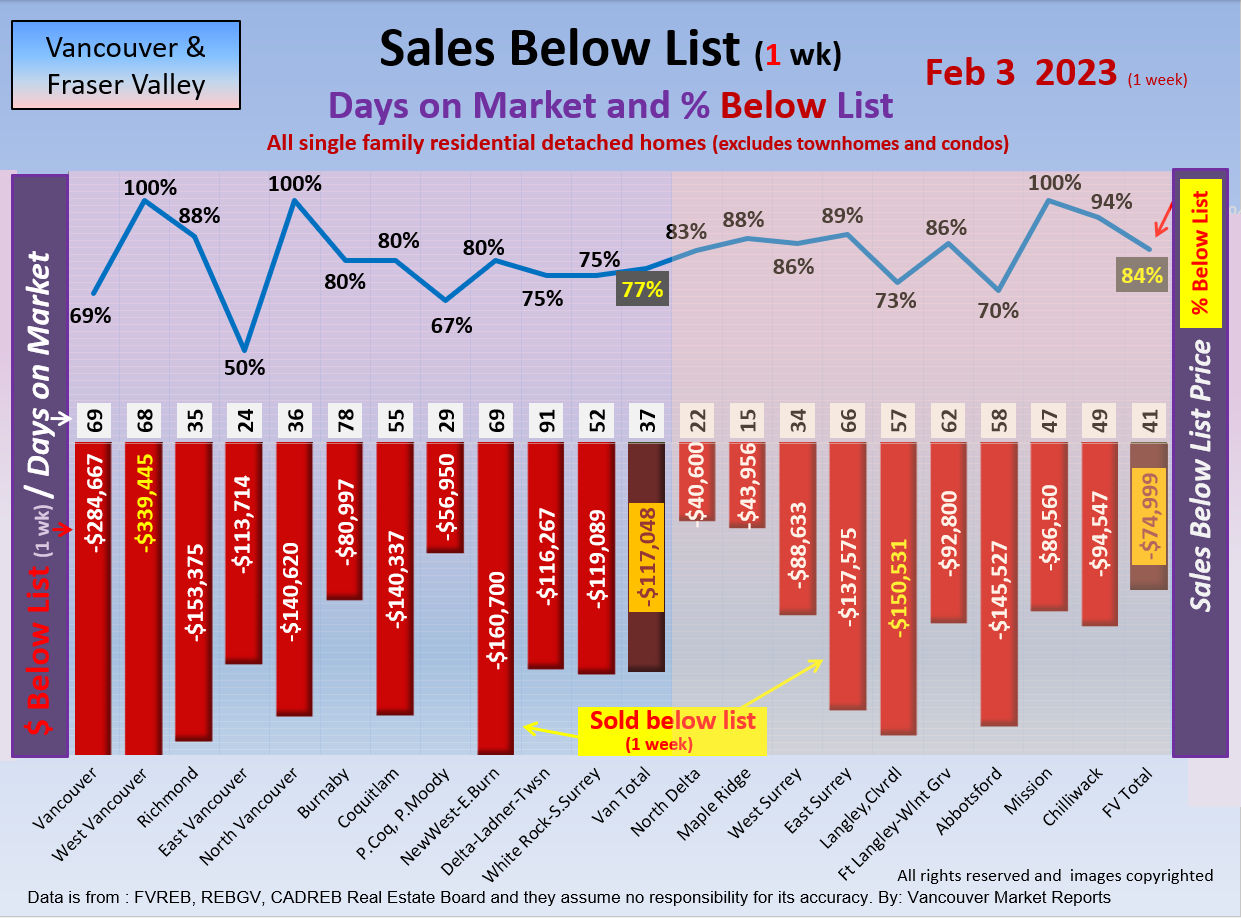
Current: In the Fraser Valley-Chilliwack area last week, 88% of the Single Family Home Sold Listings reduced their List Price by the Average of $49,588.
This compares to the week before when 84% reduced their List Price by the Average of $49,561. Meanwhile, 12% of the listings sold over the list price by average of $62,672.
See each city link for the full details
|
|
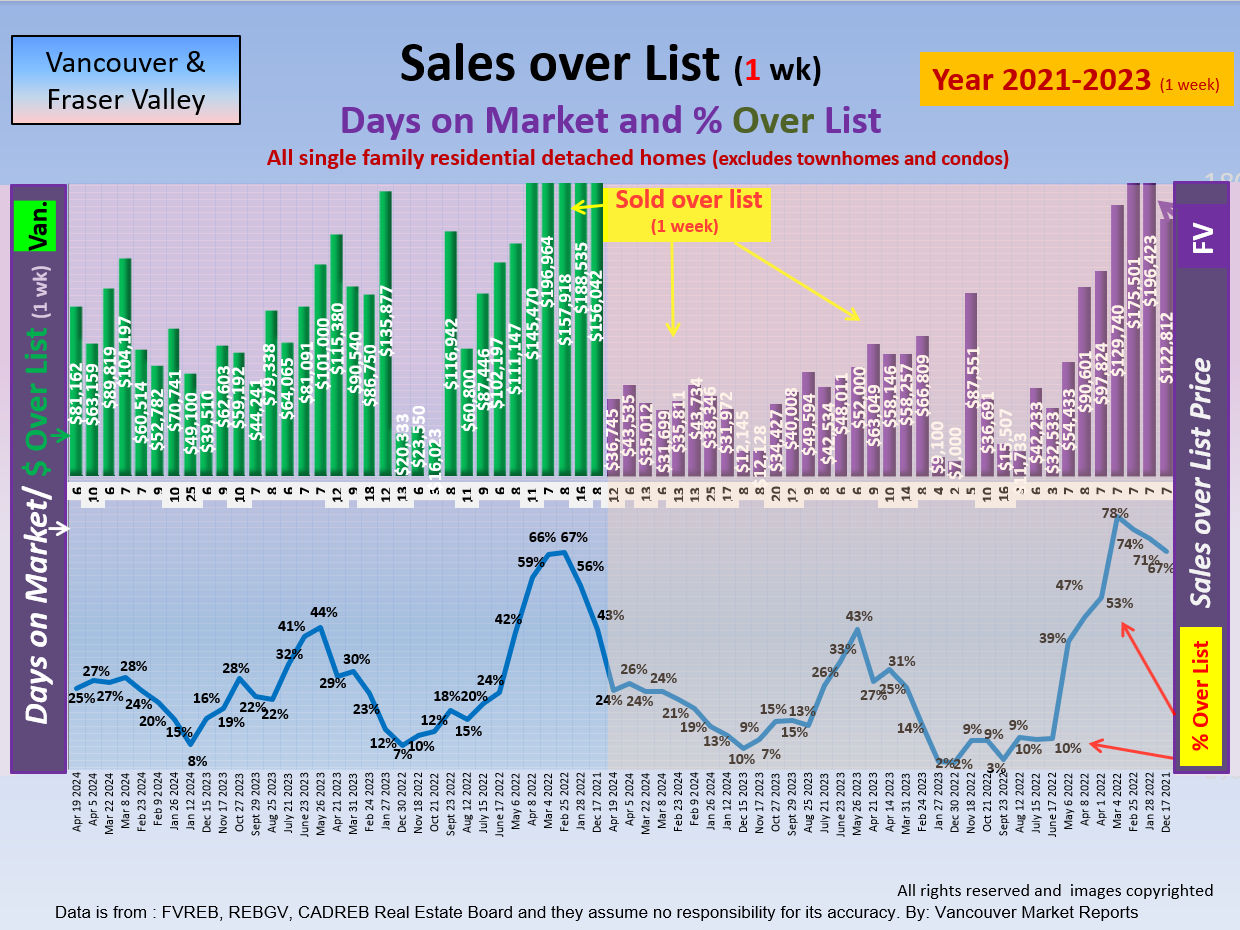
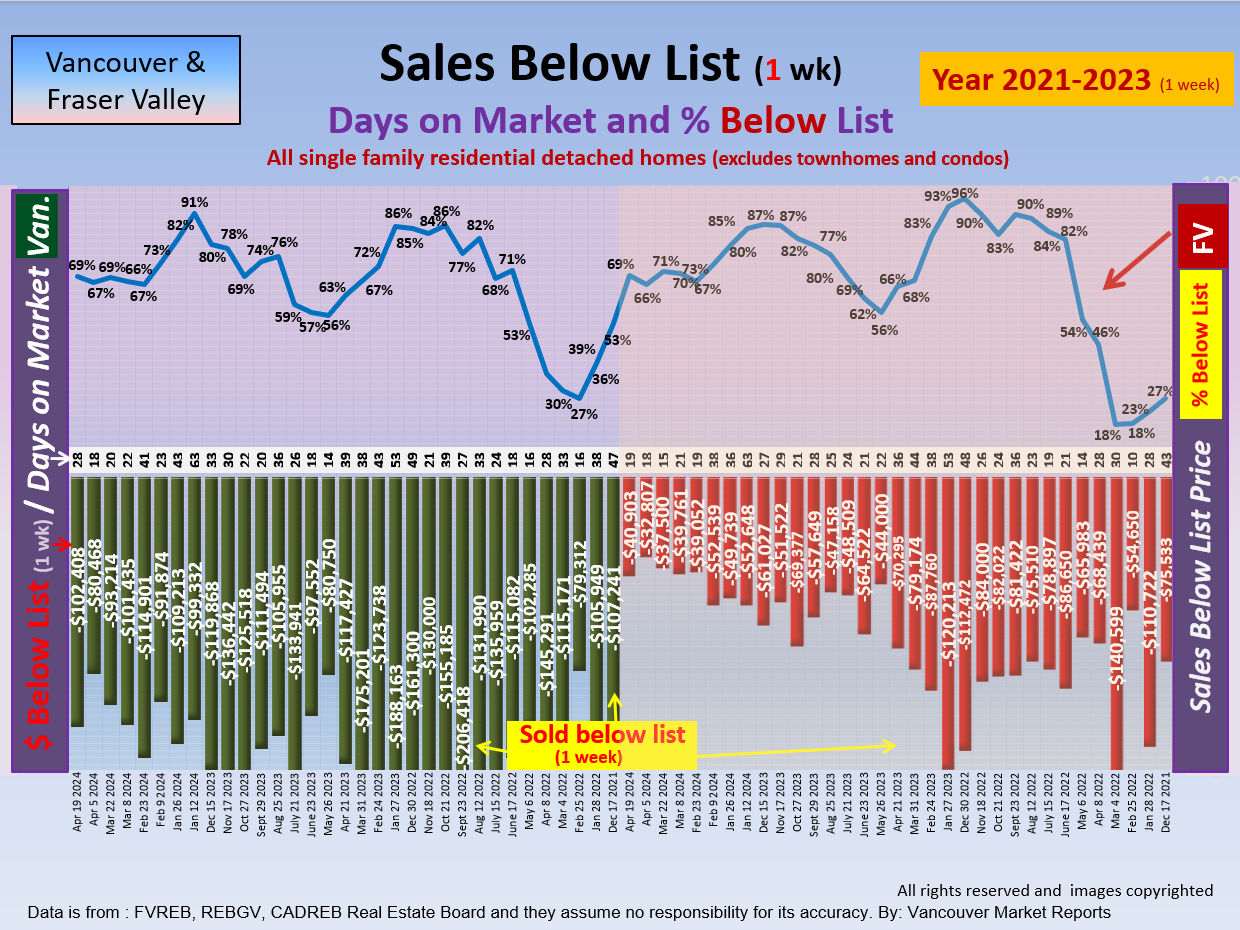
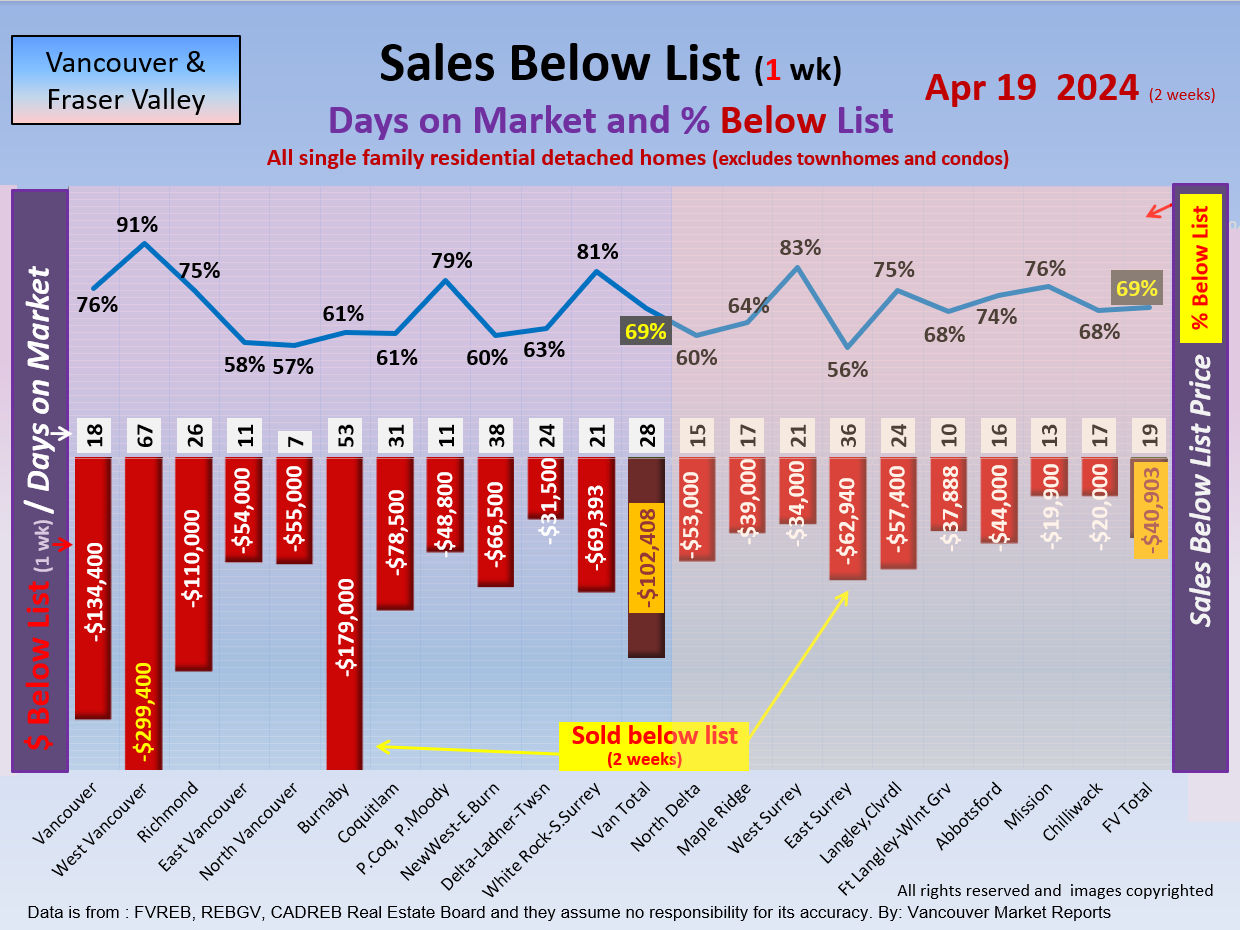
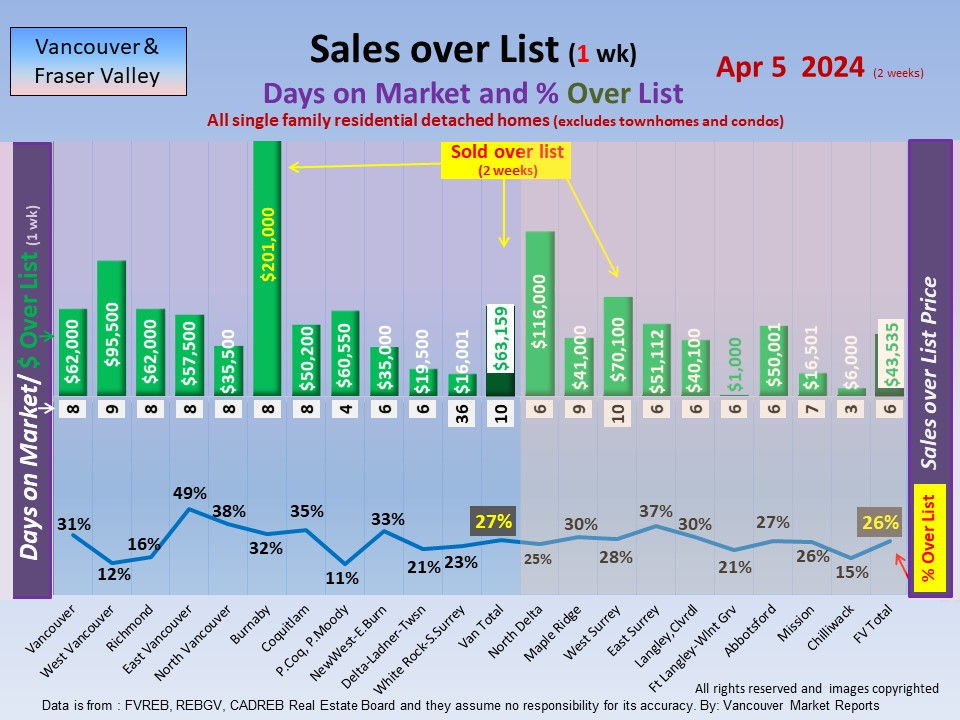
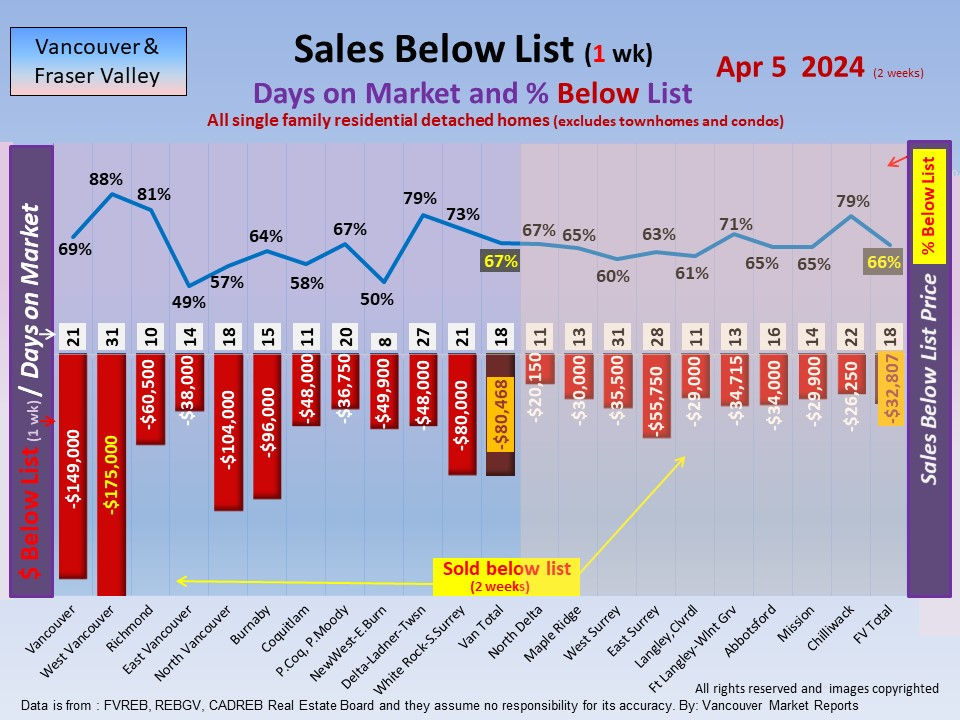
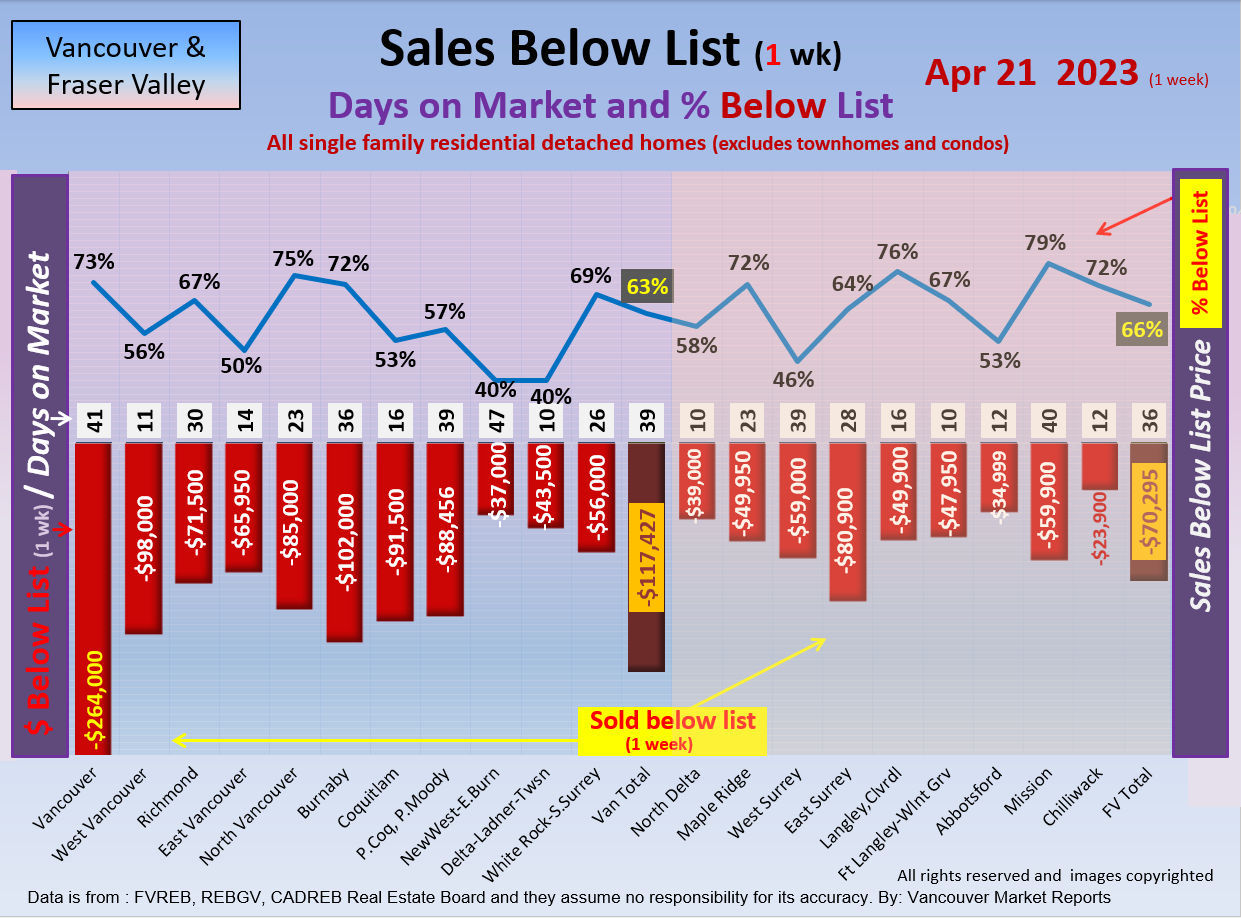
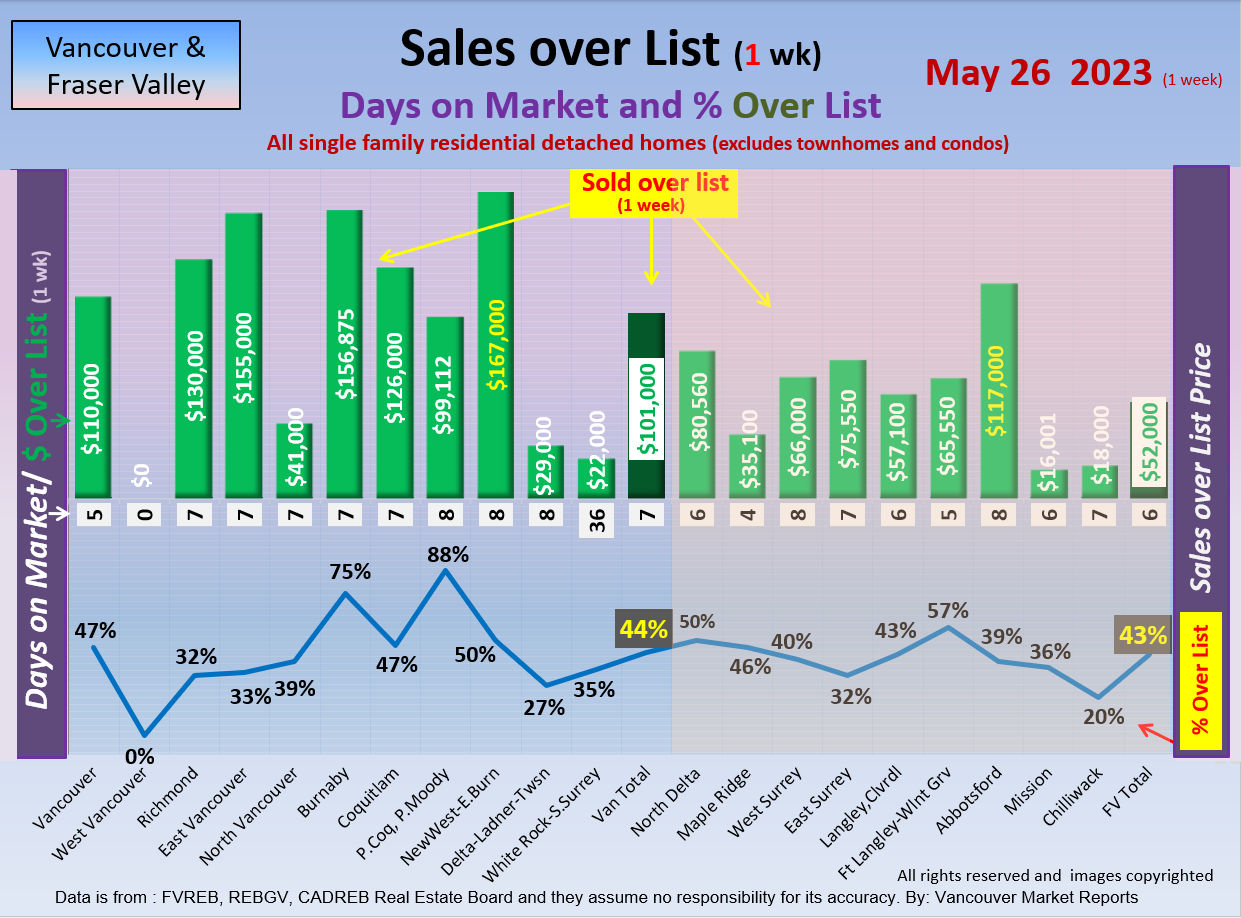
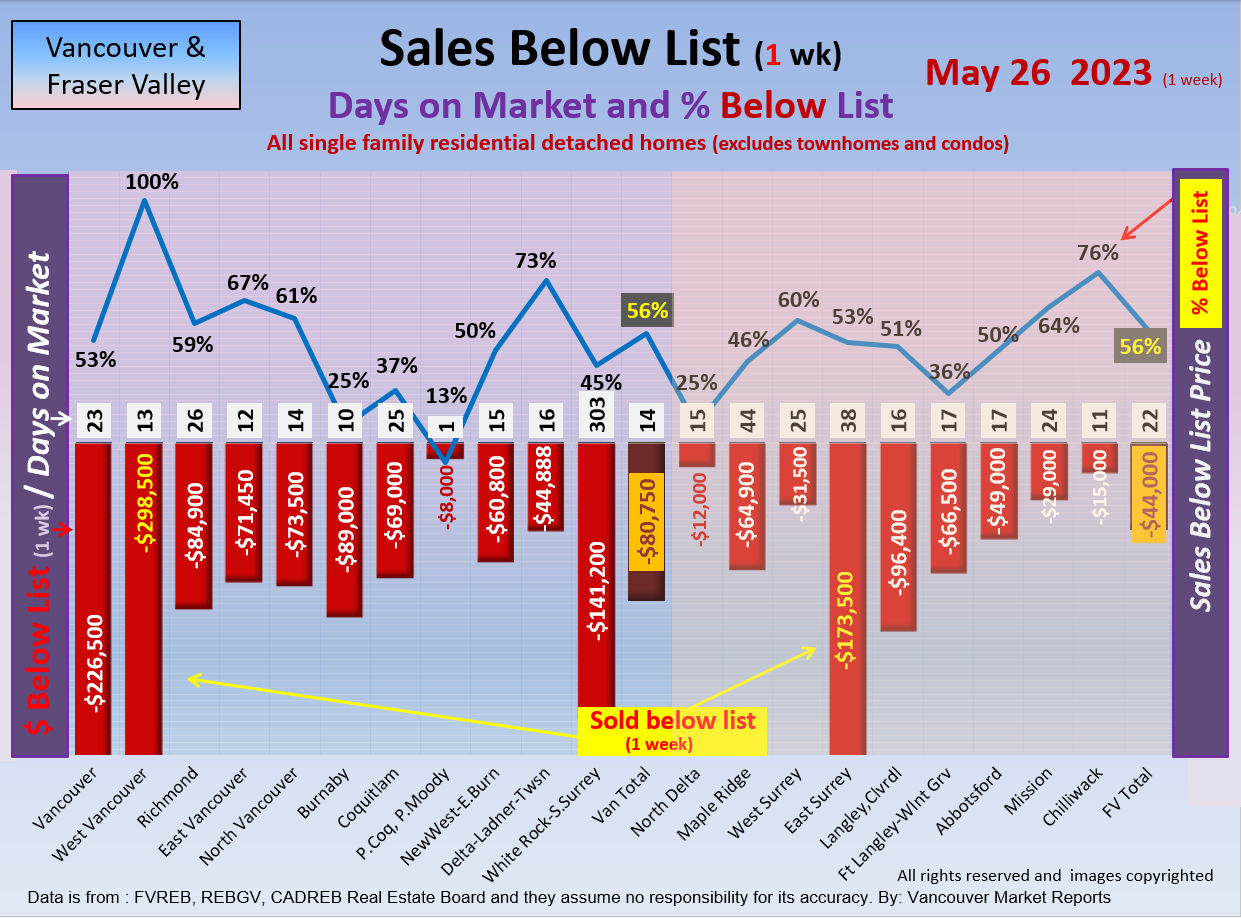
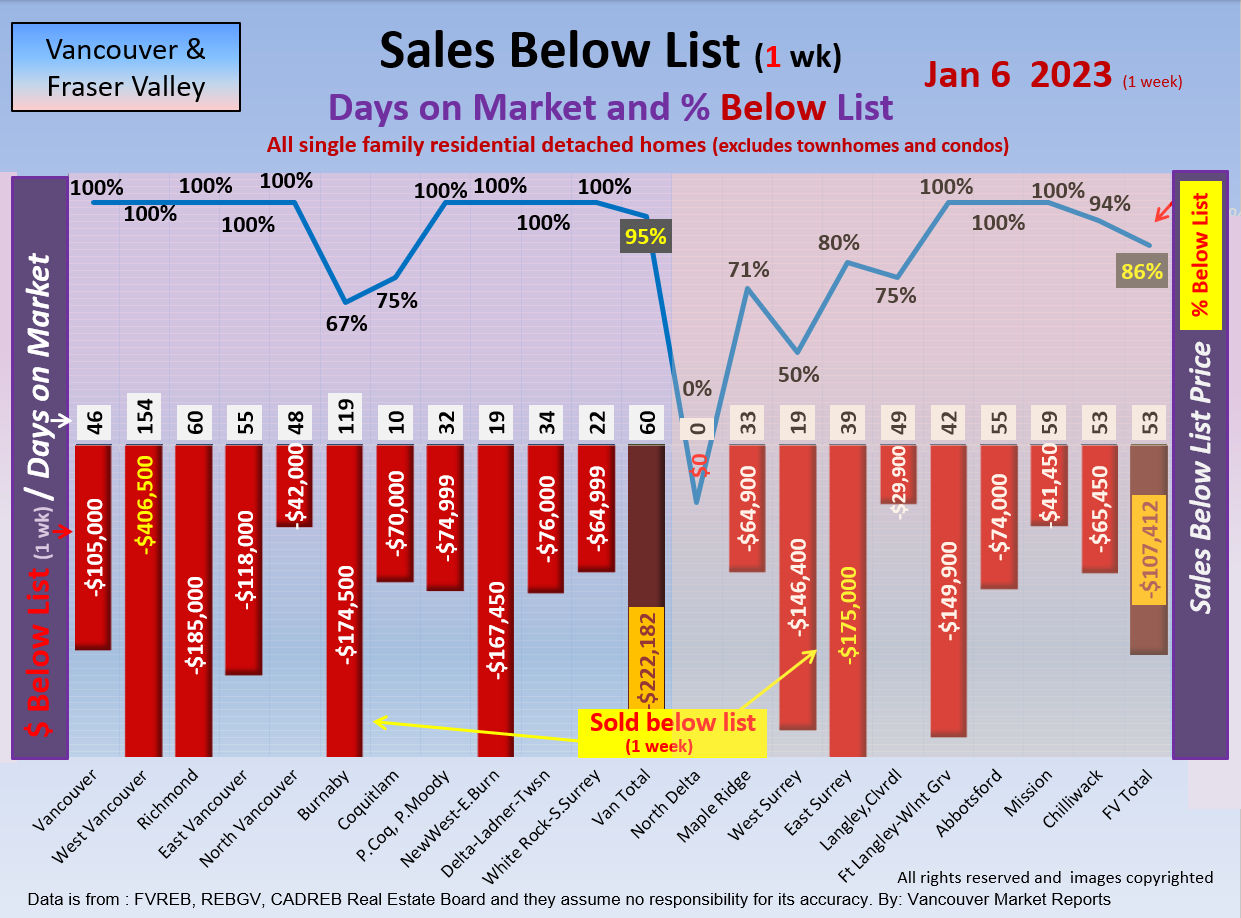
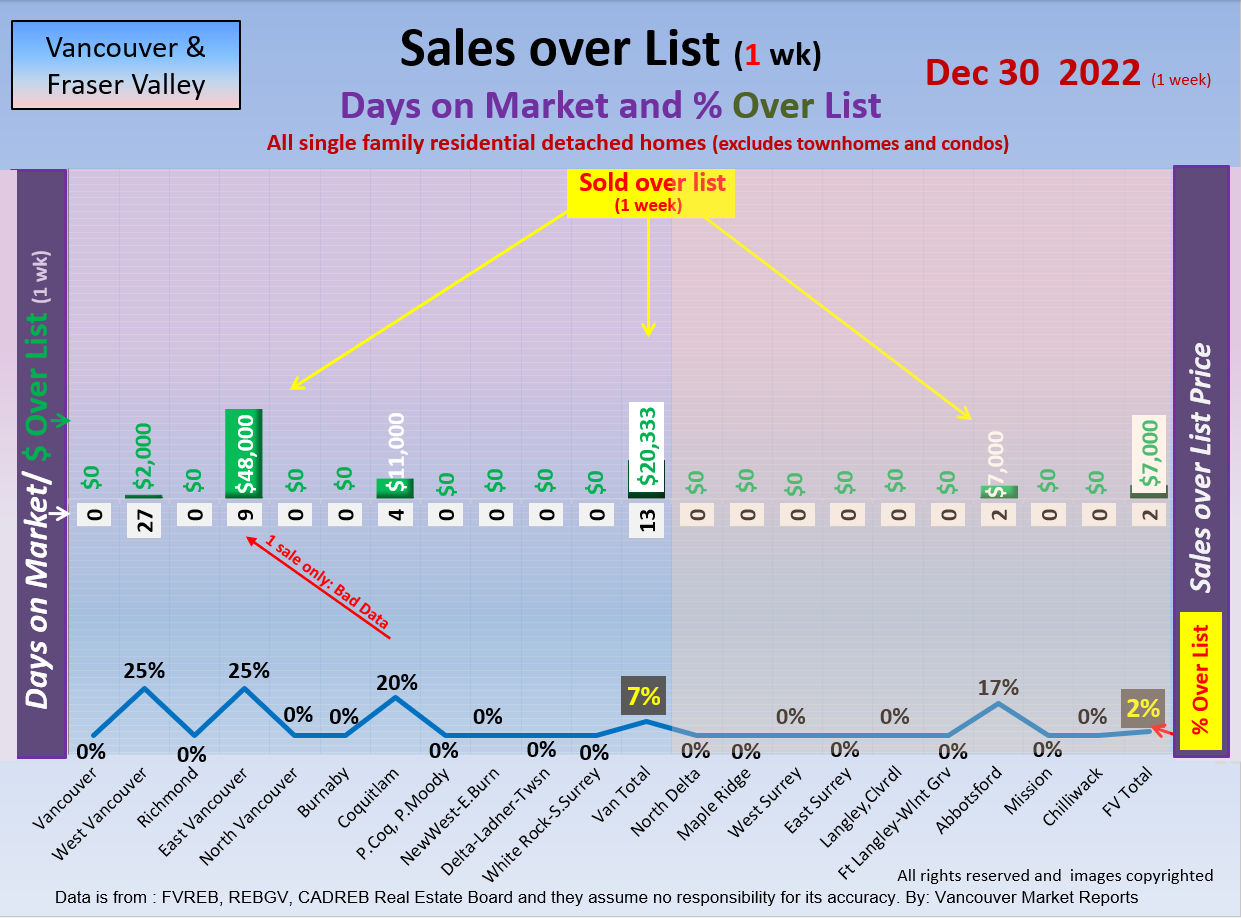
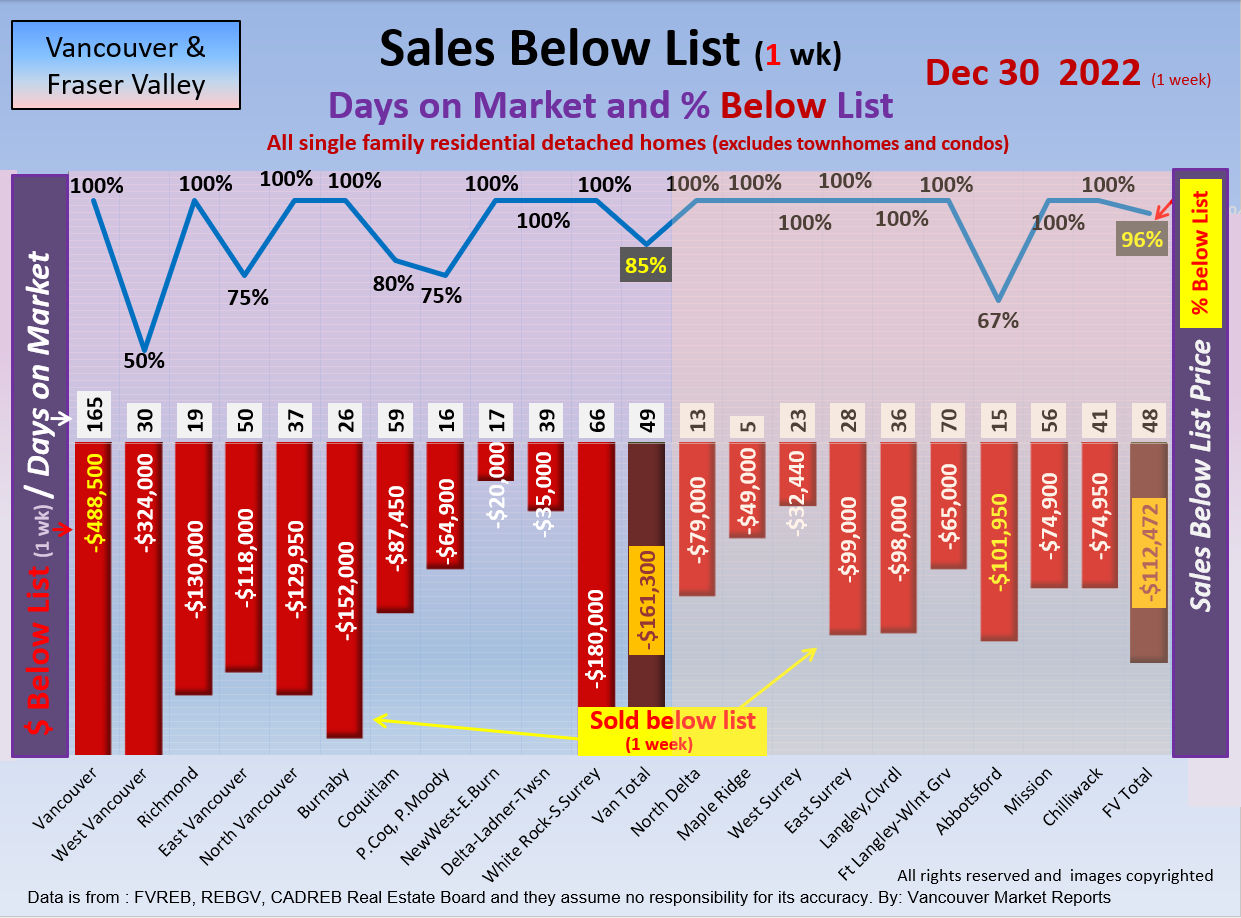
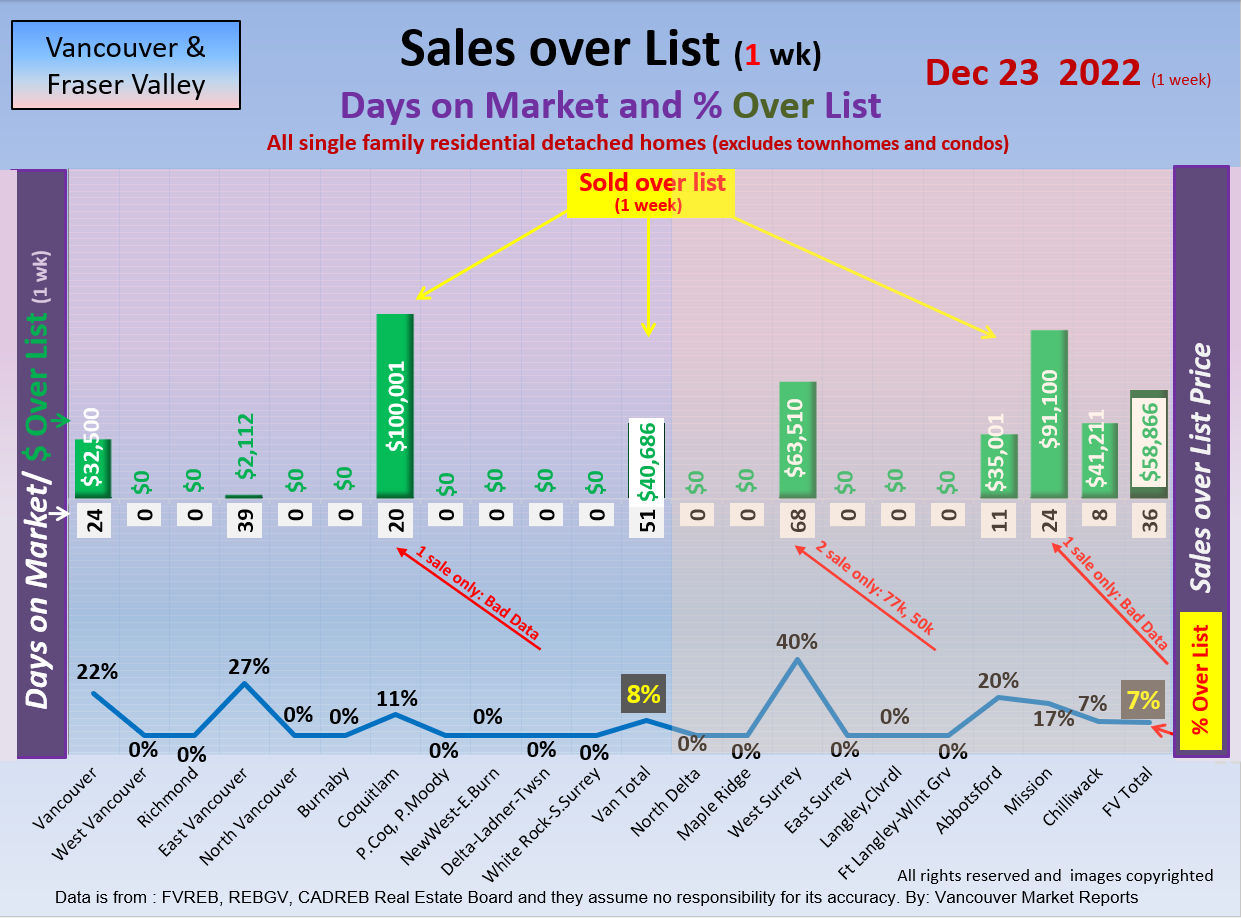
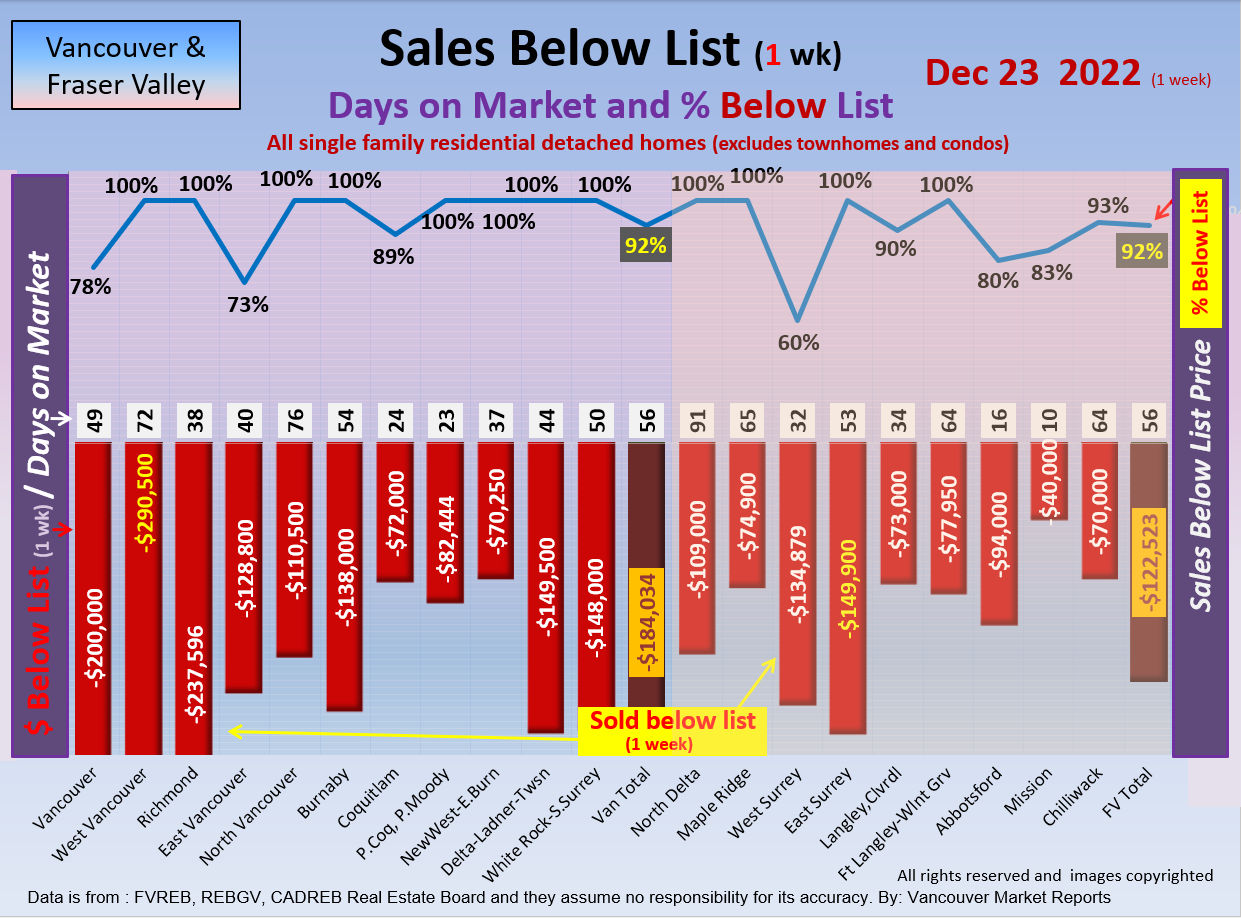
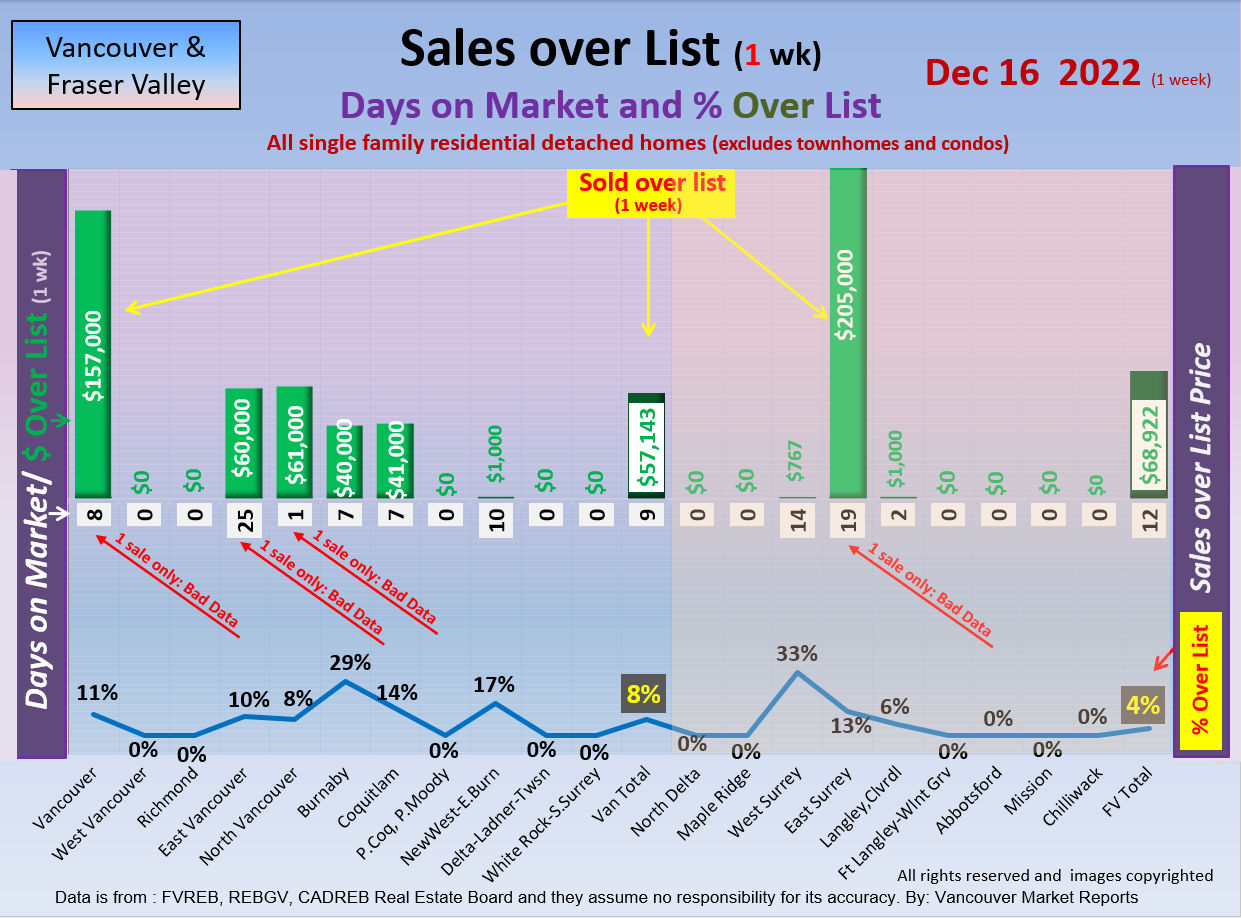
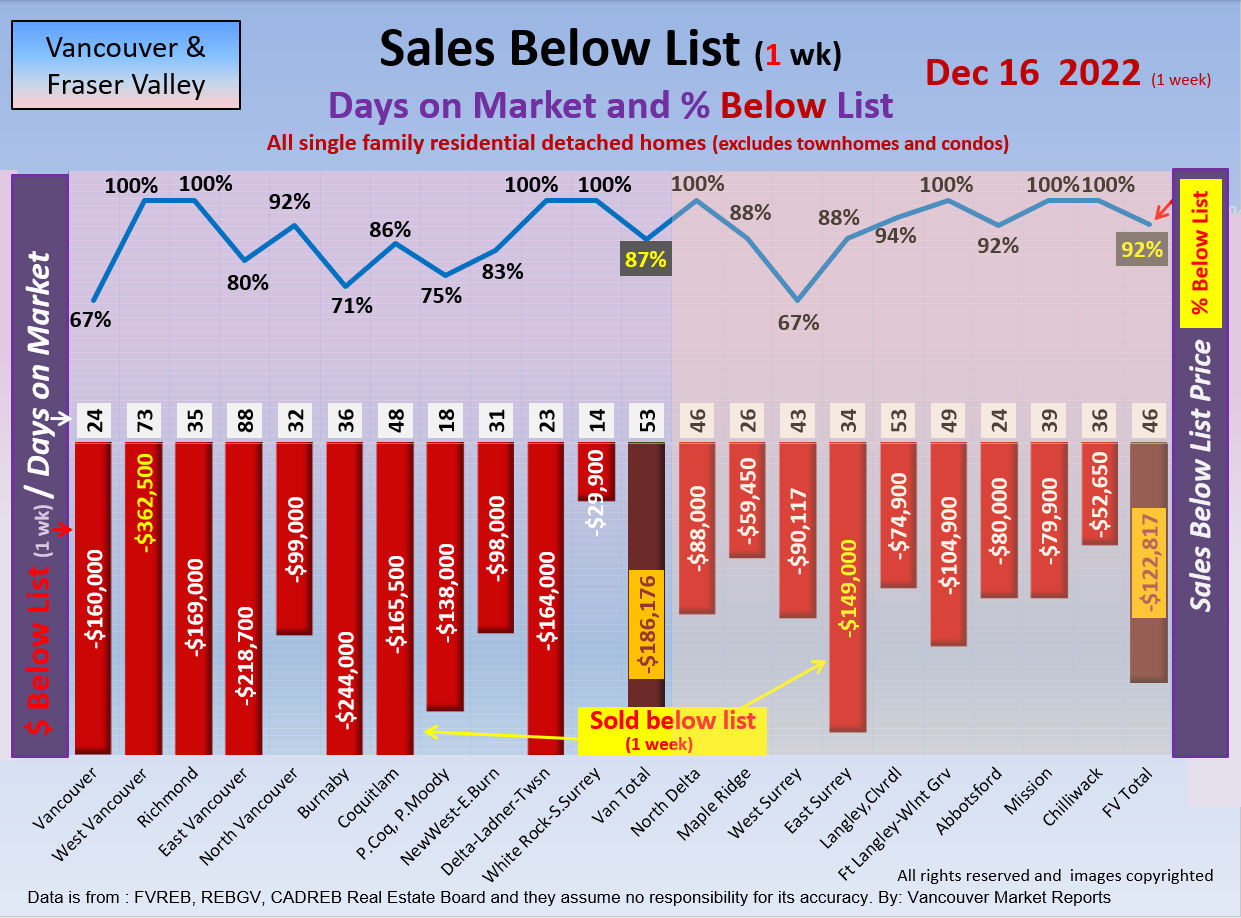
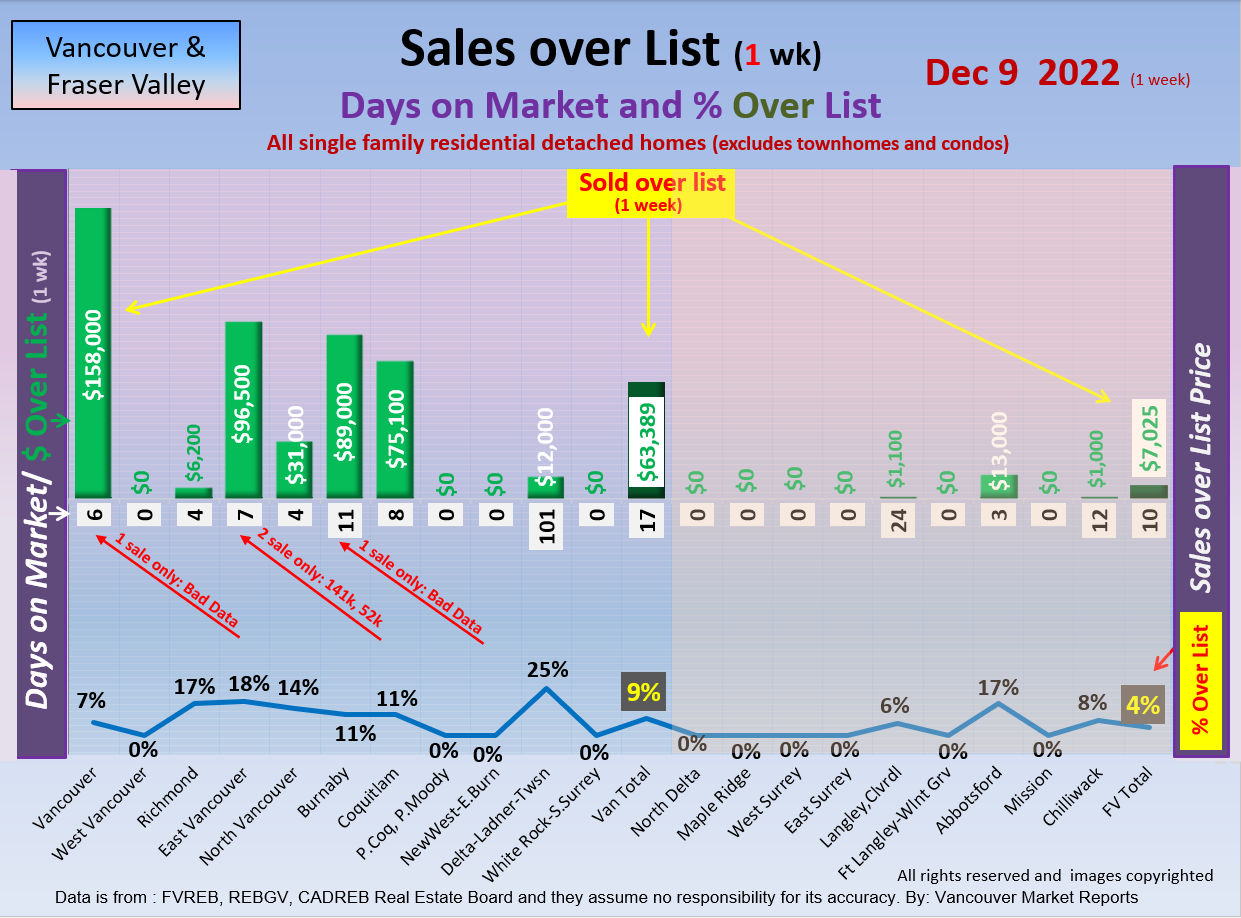
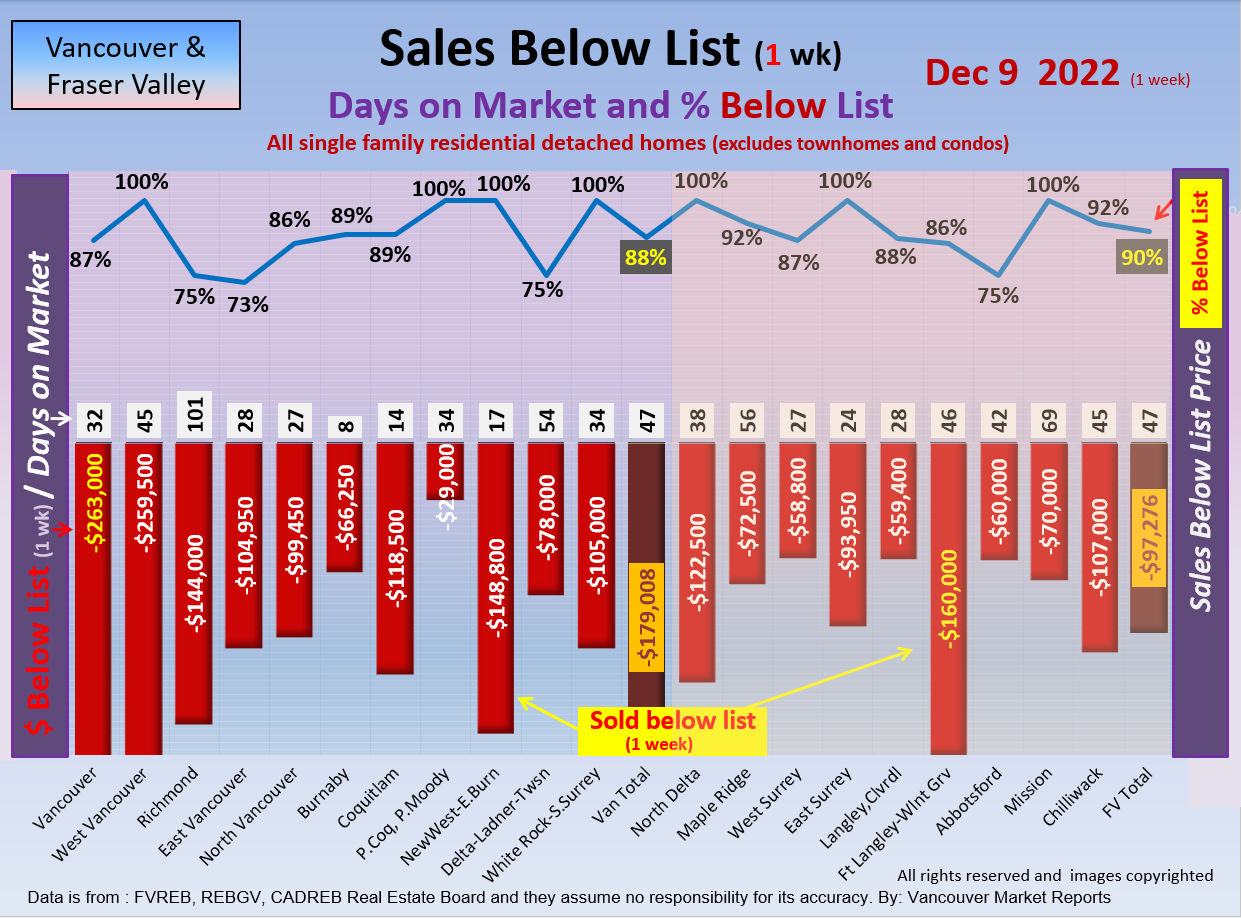
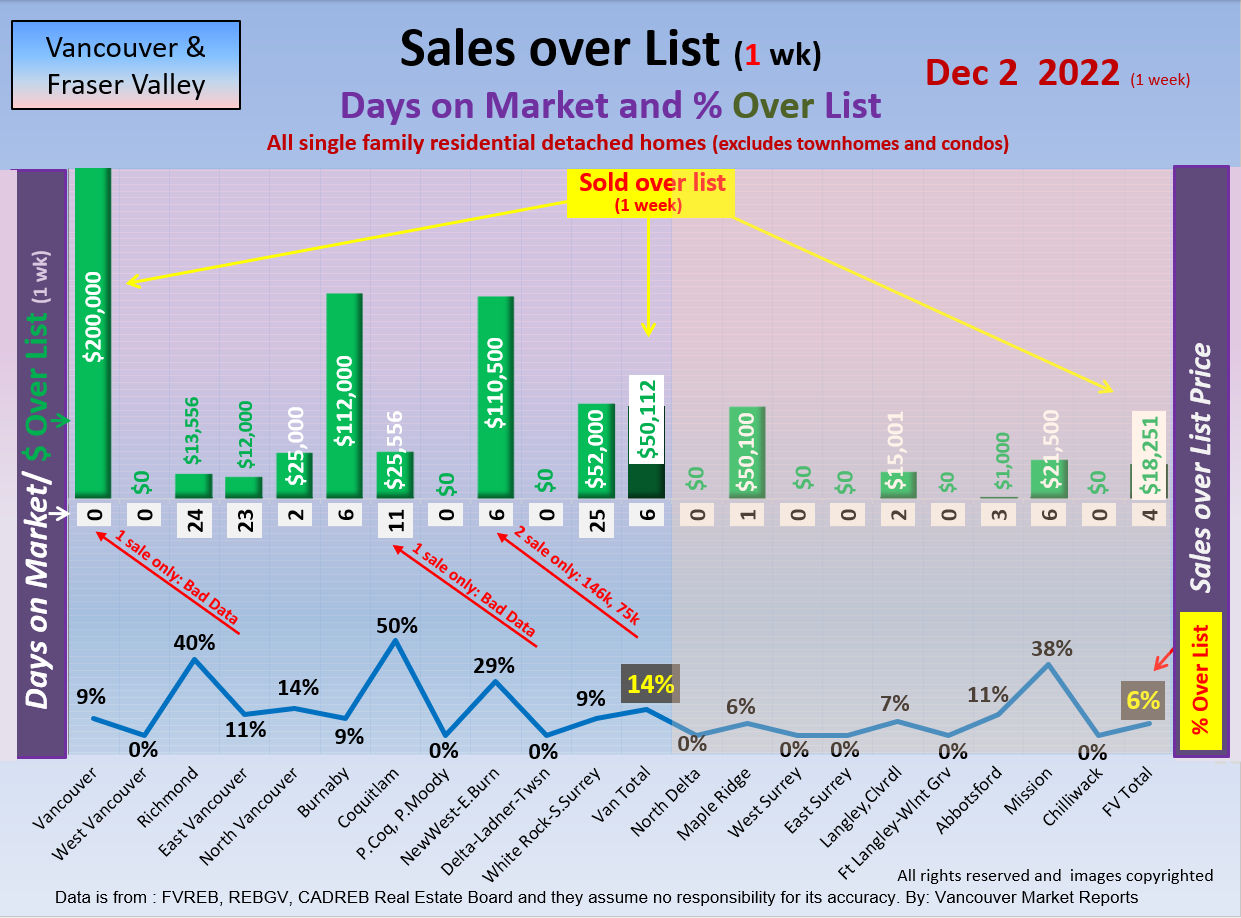
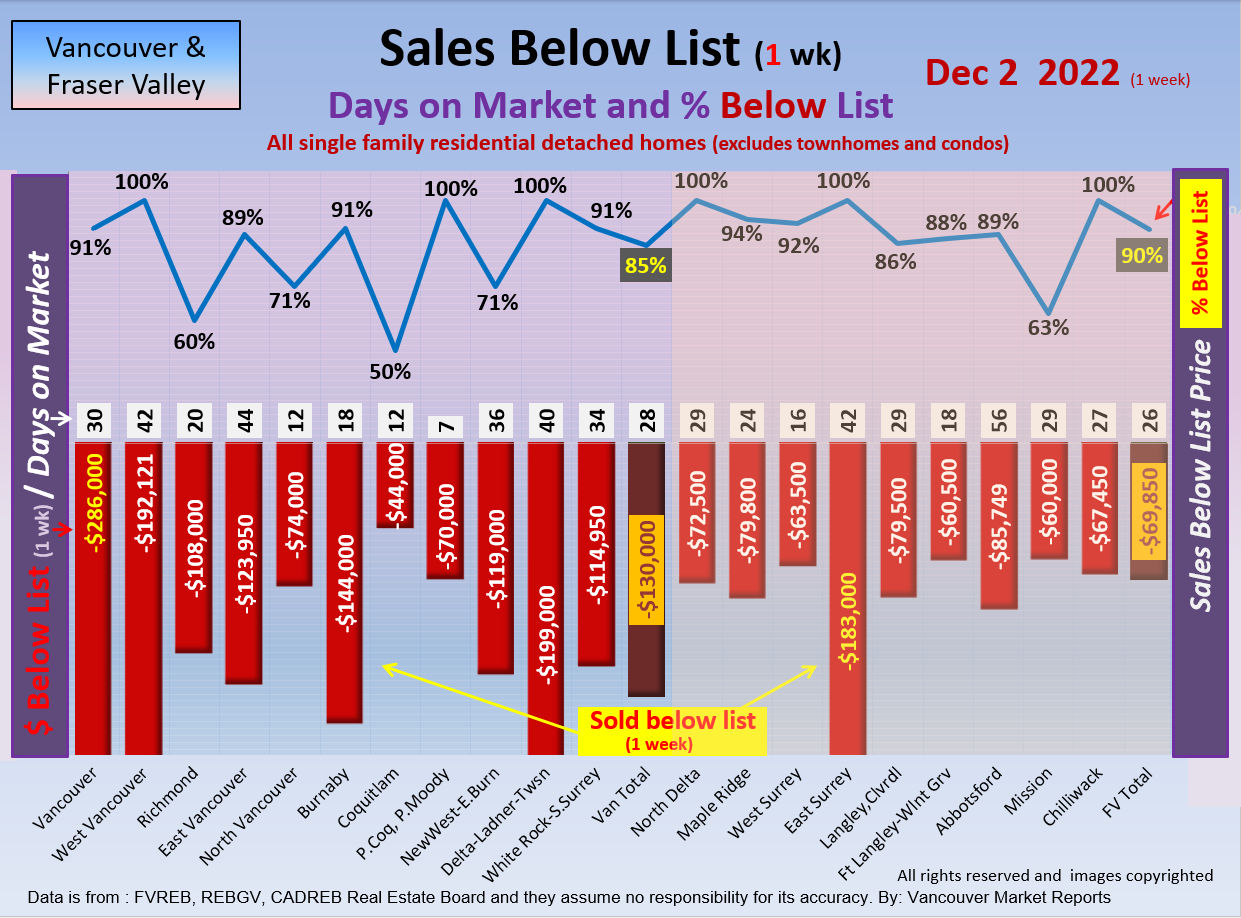
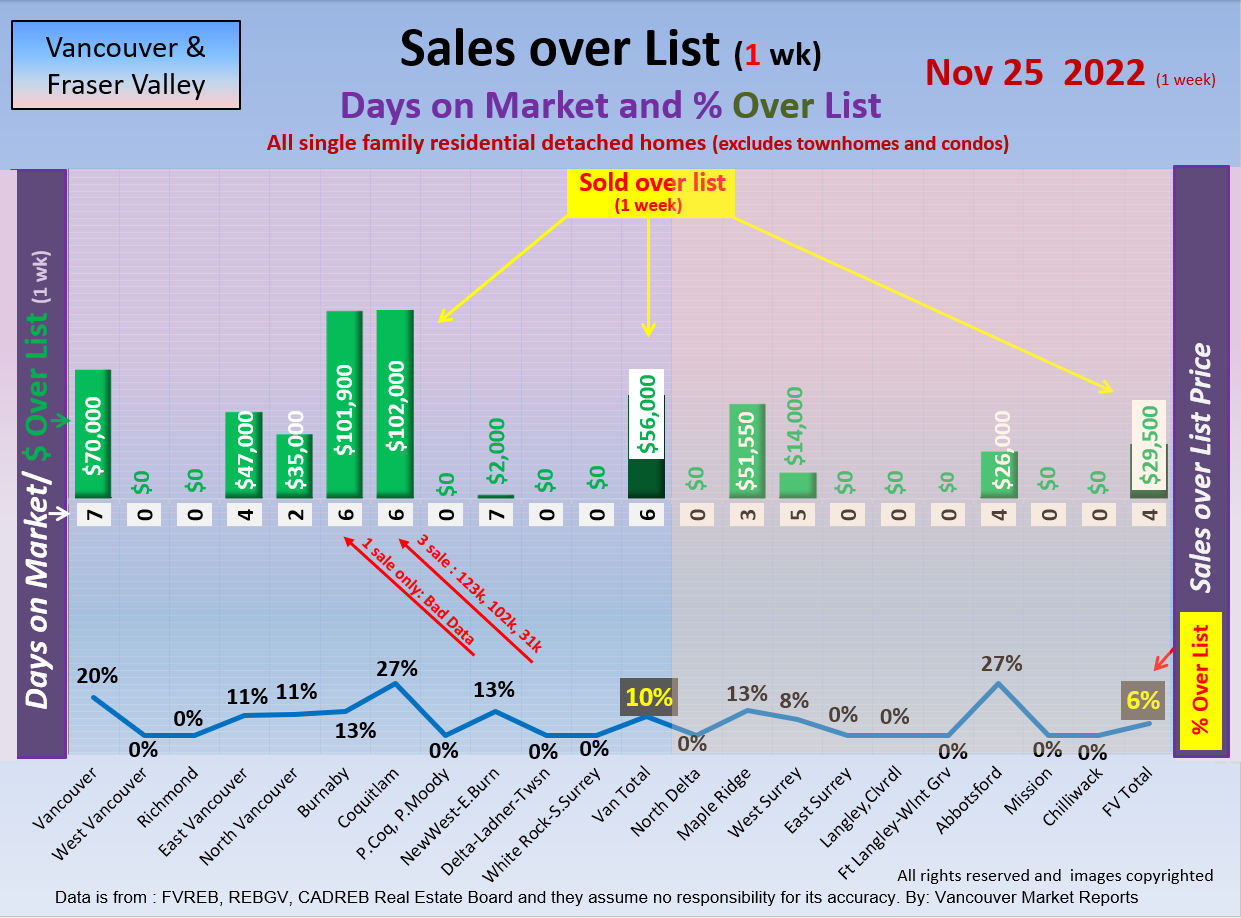
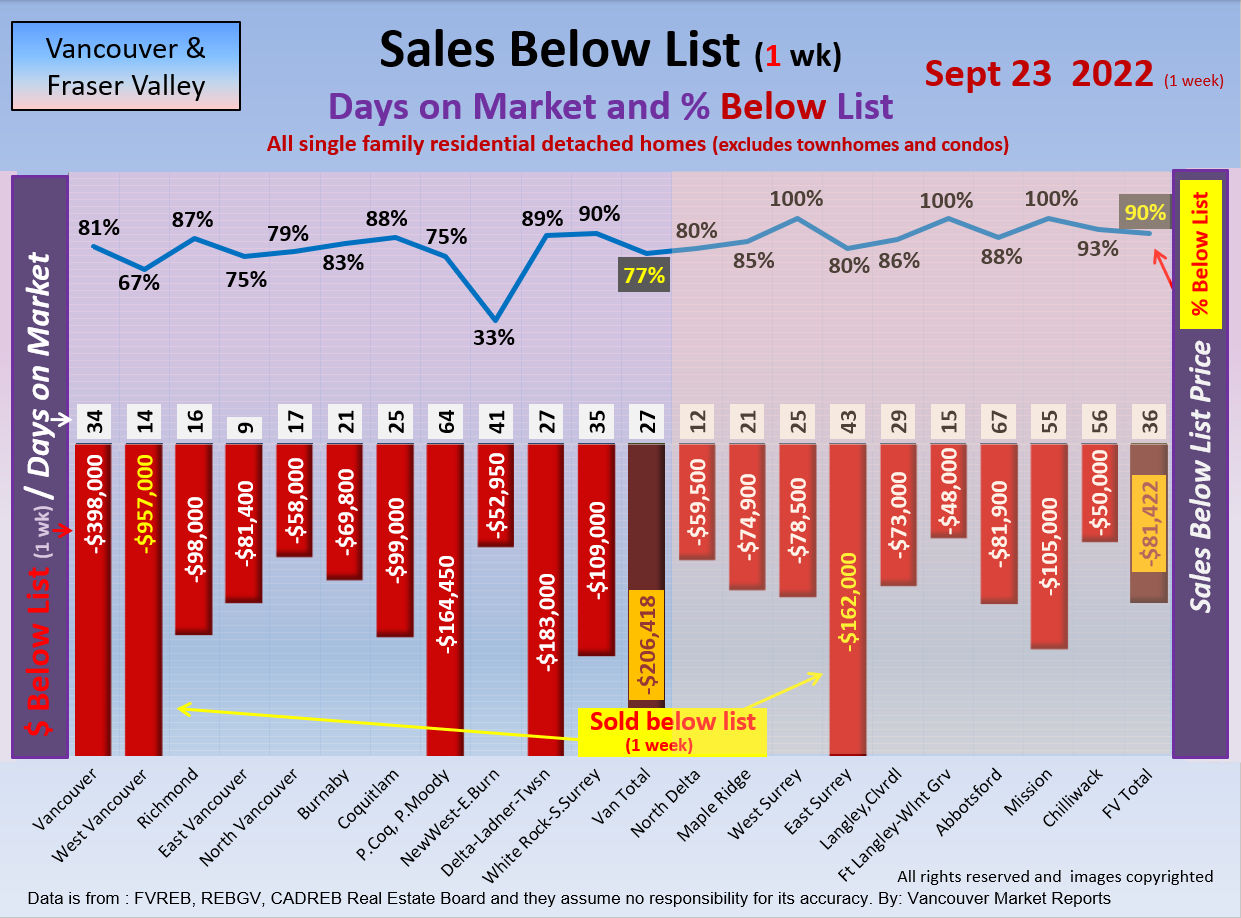
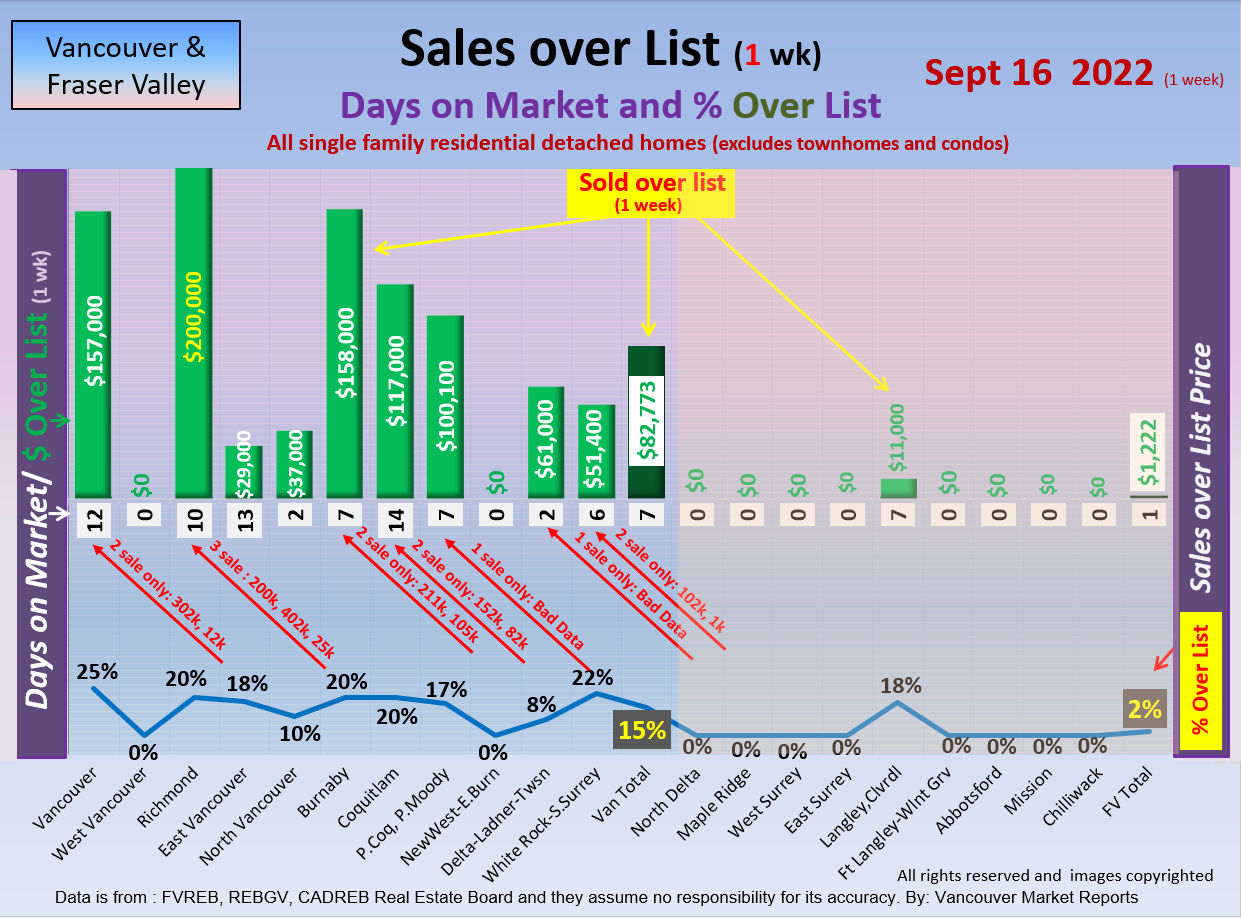
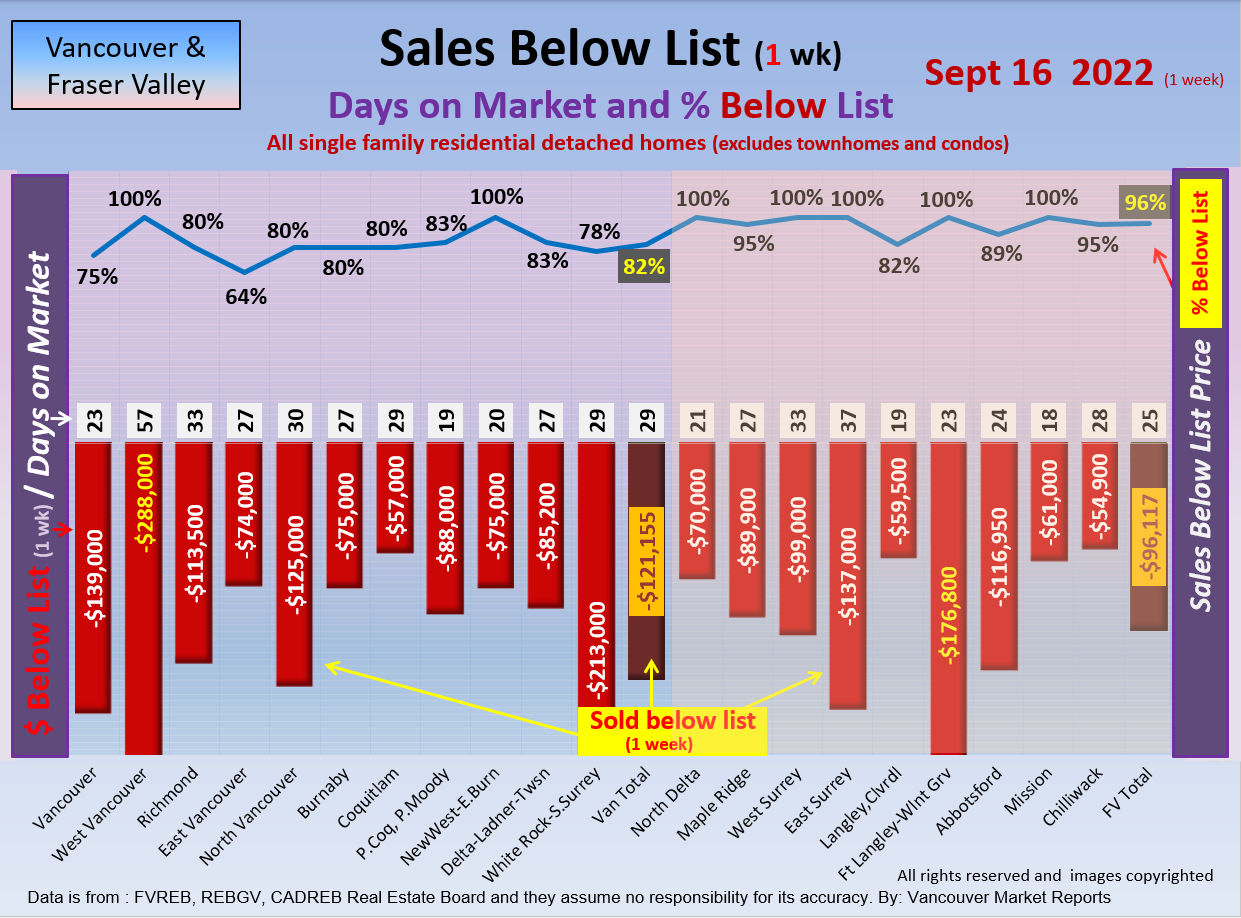
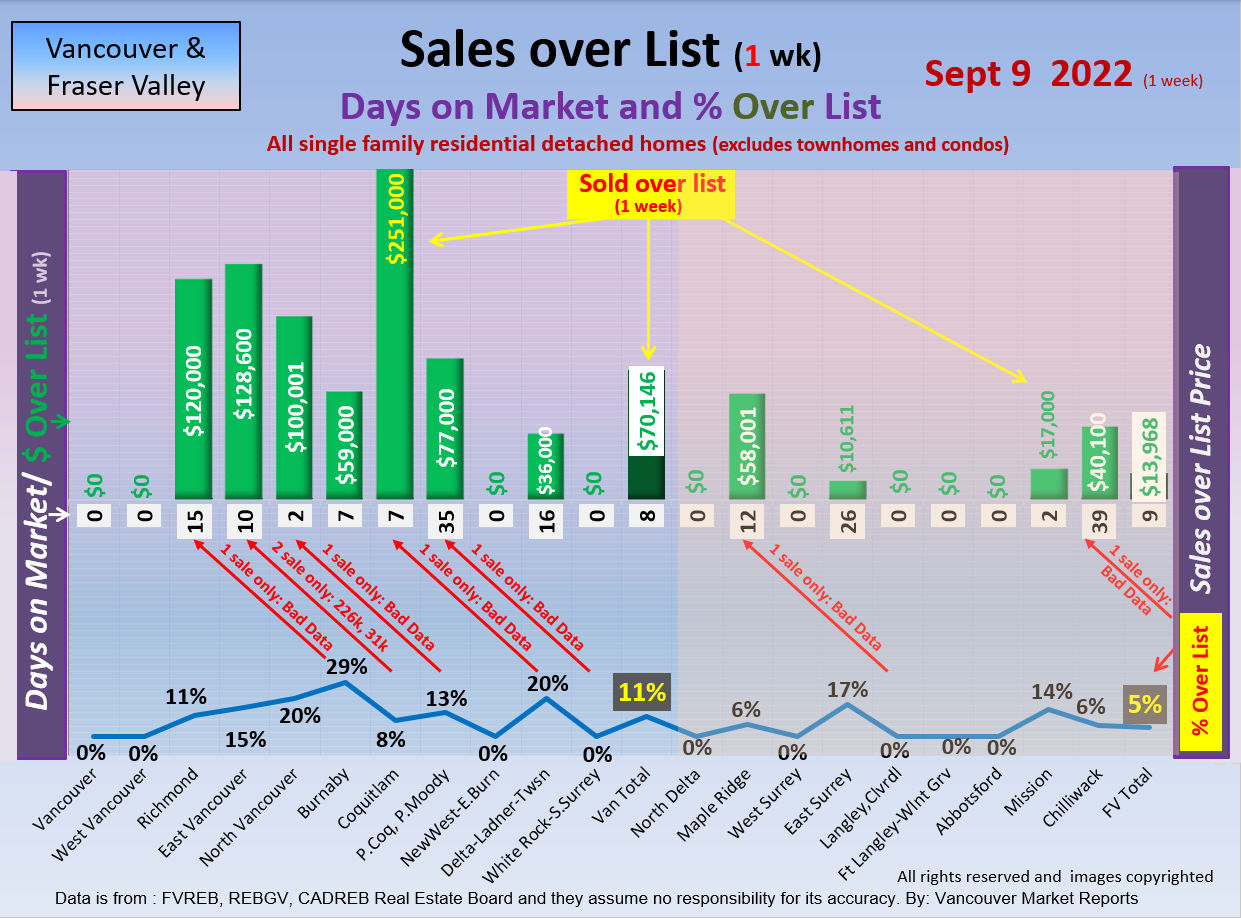
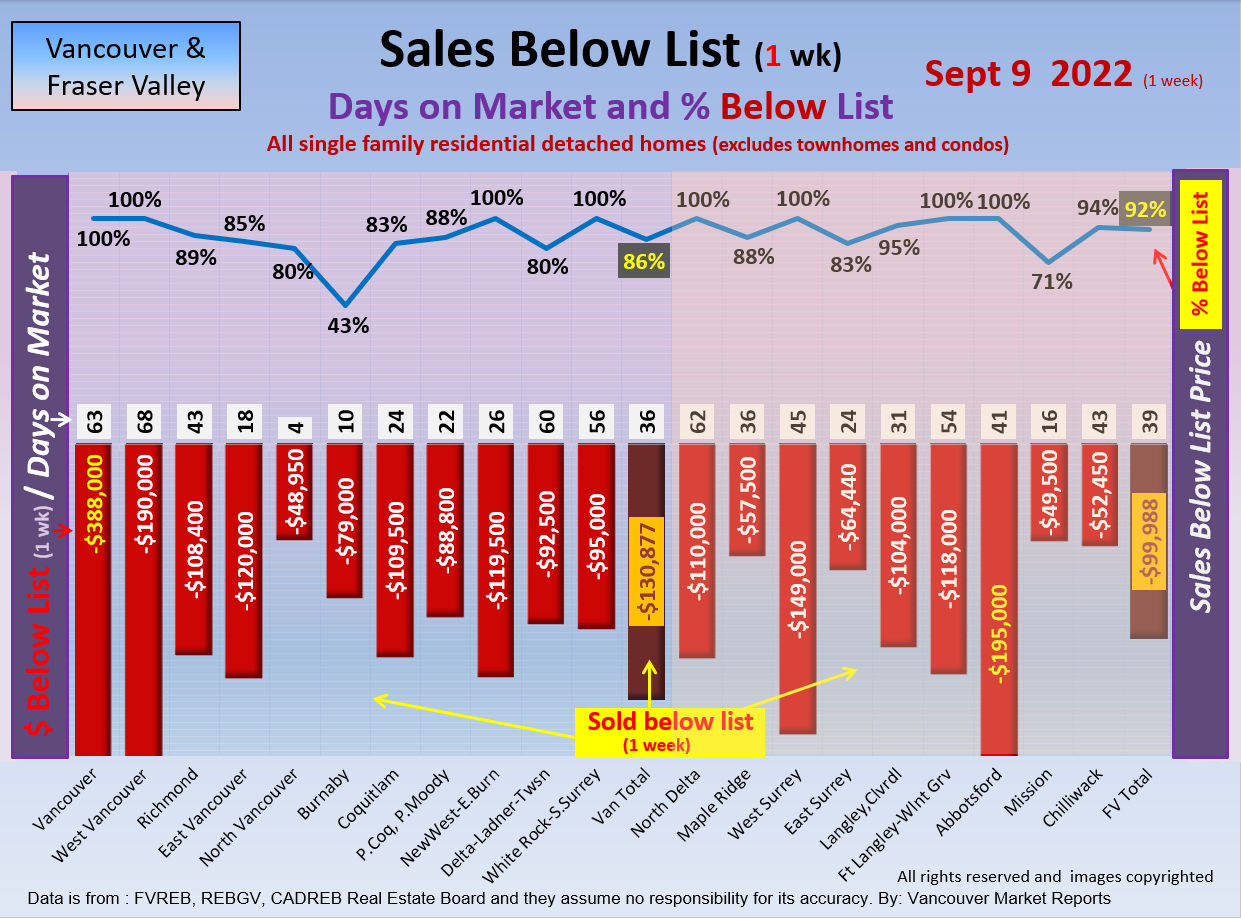
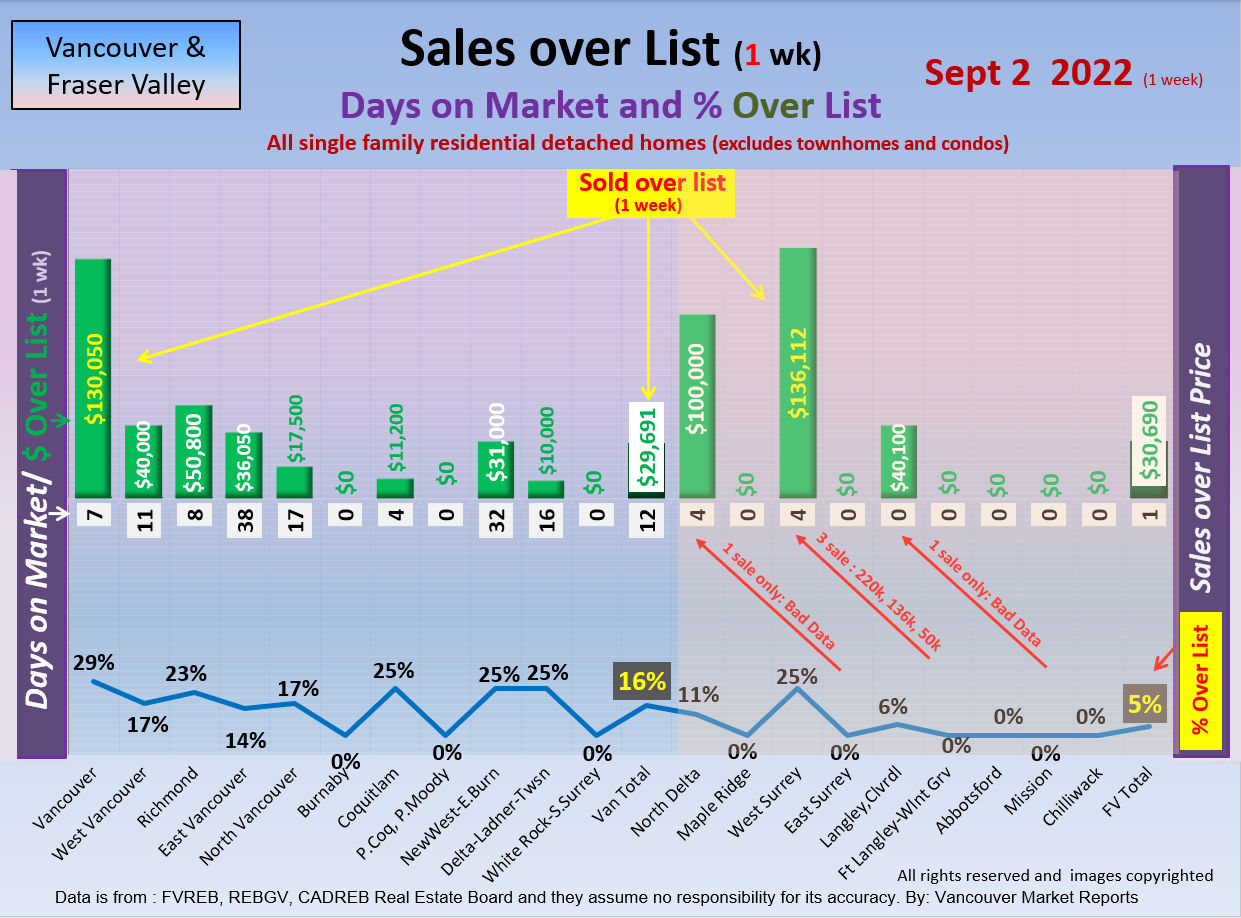
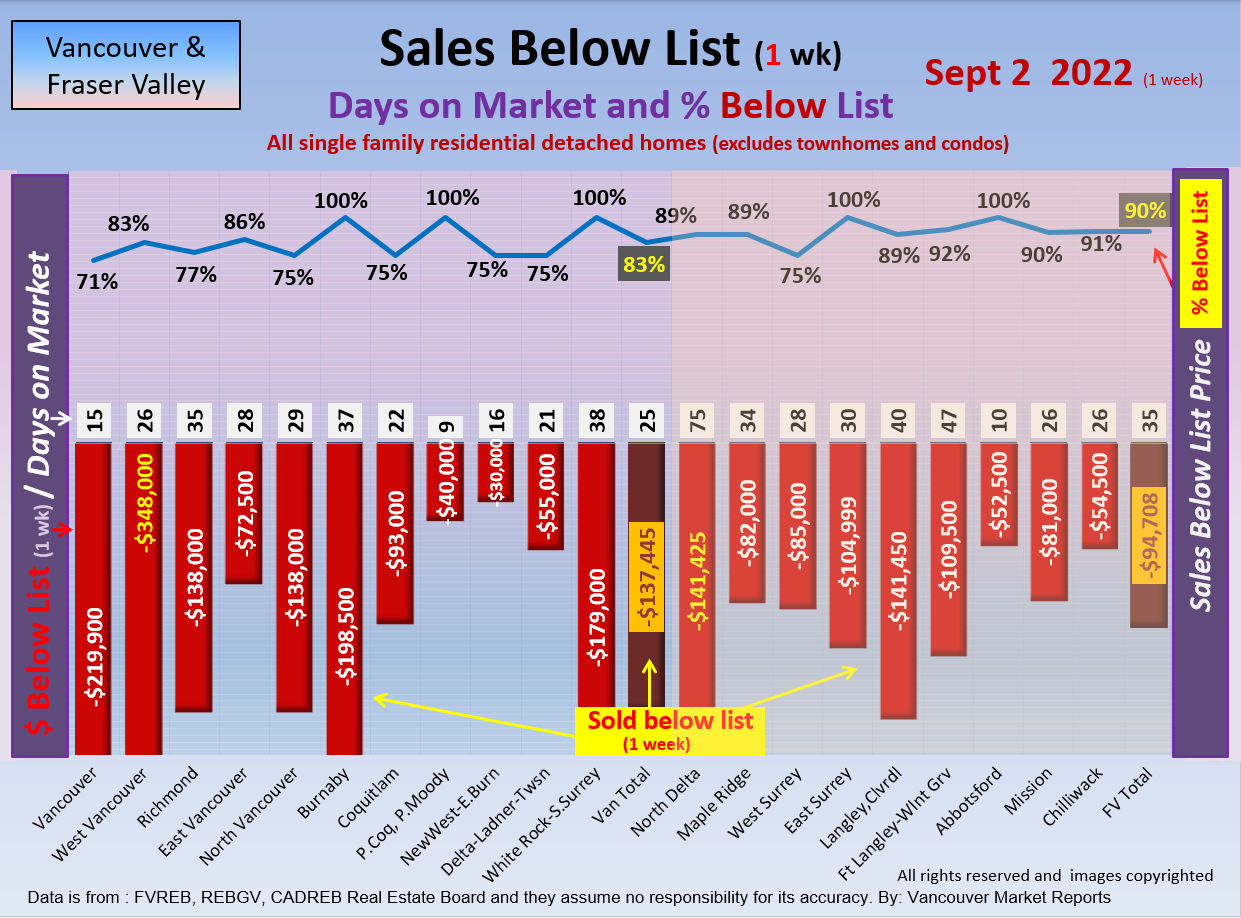
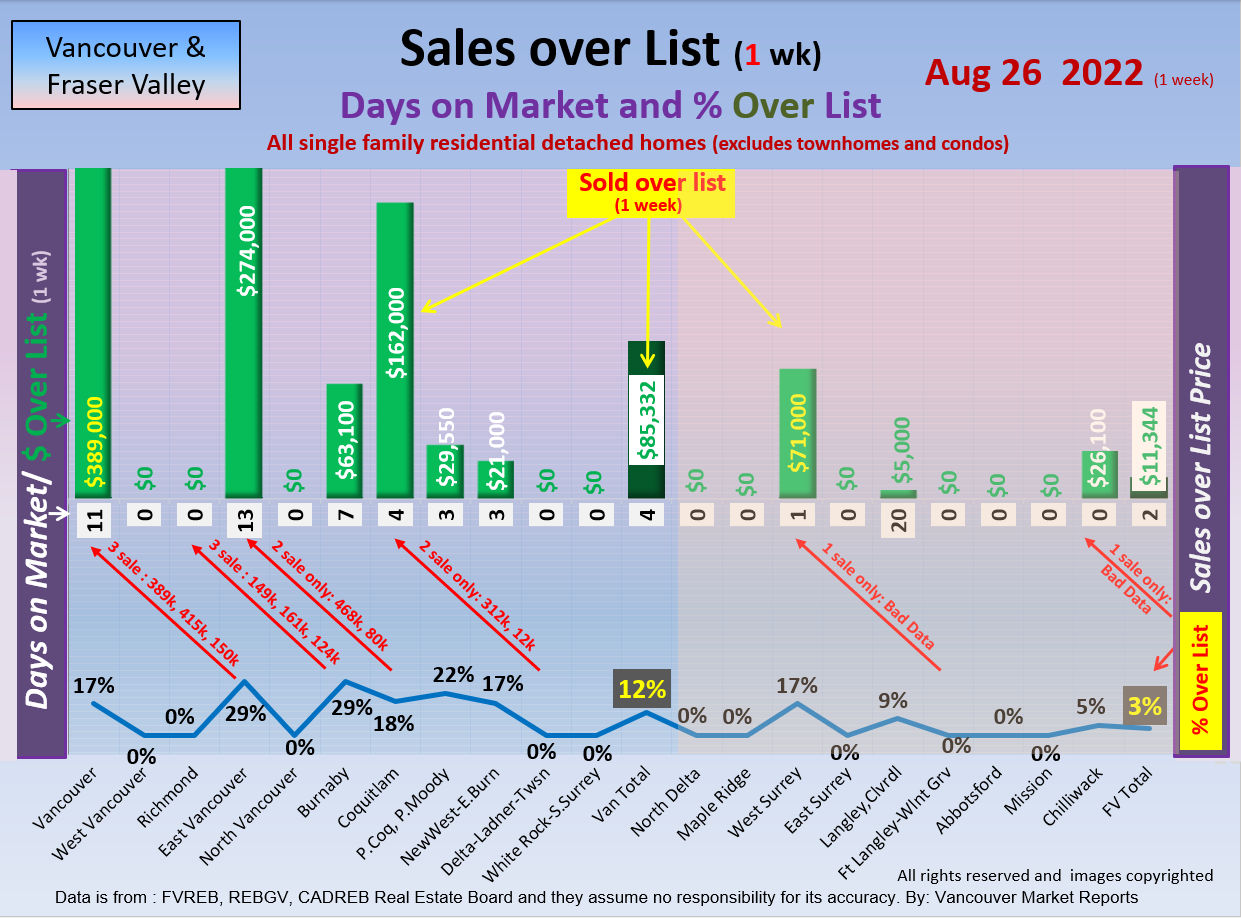
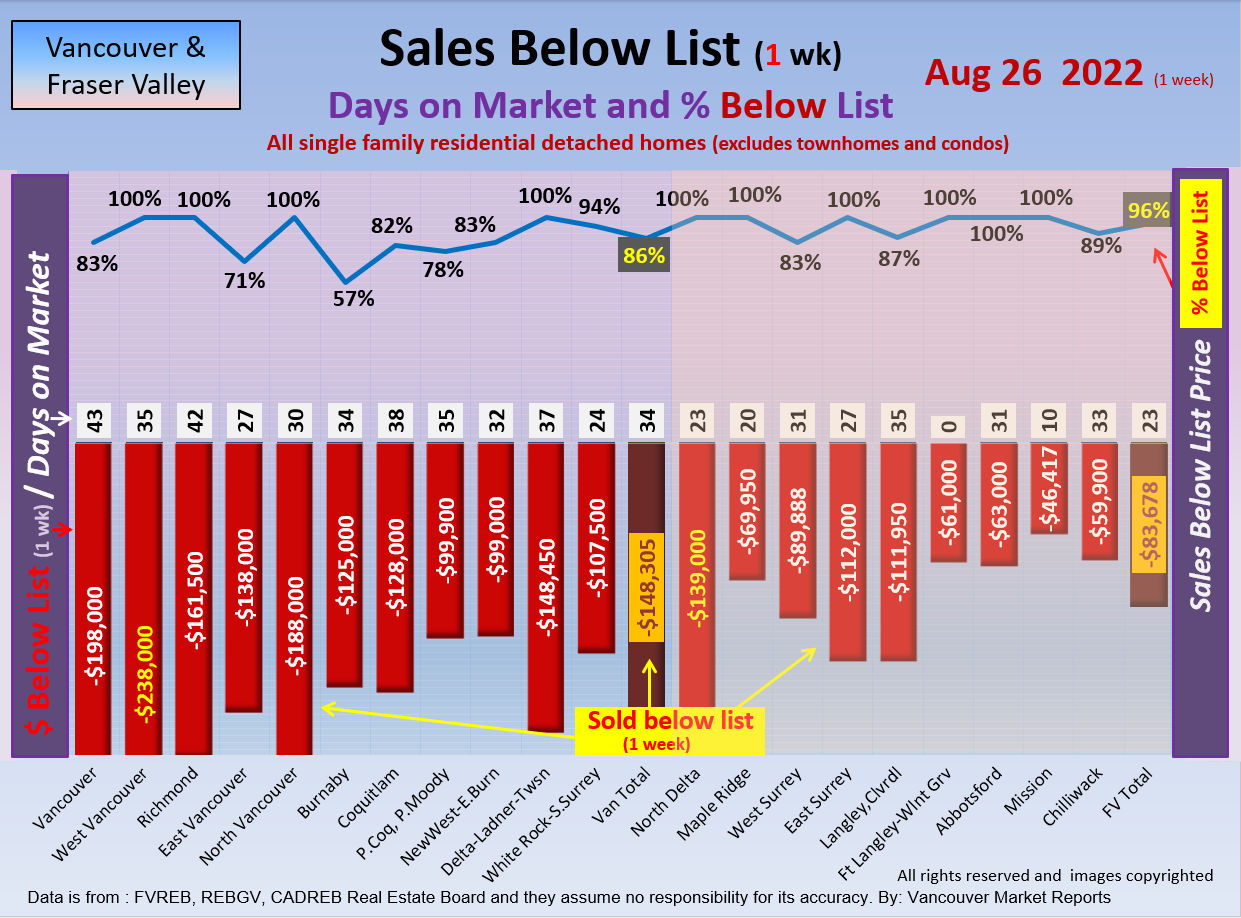
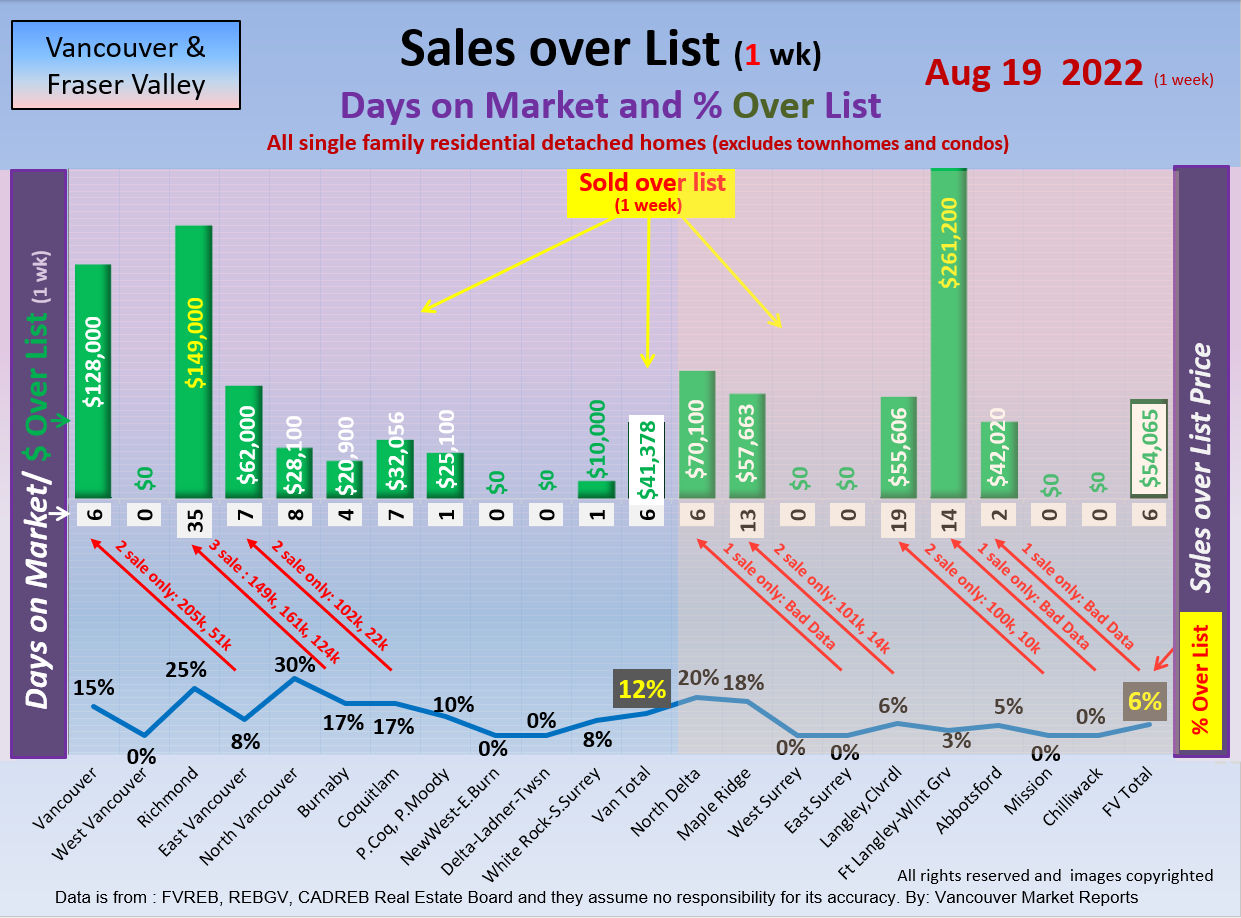
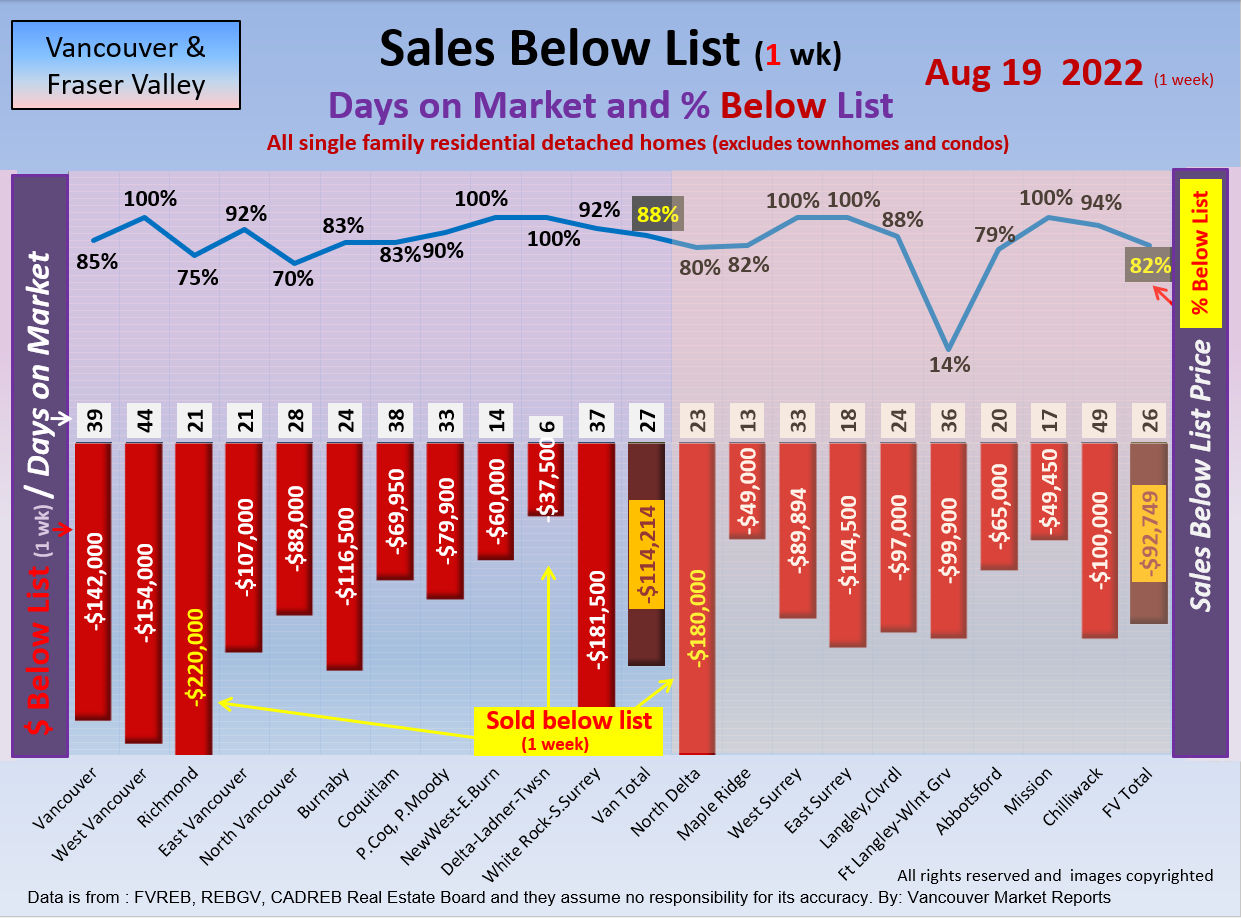
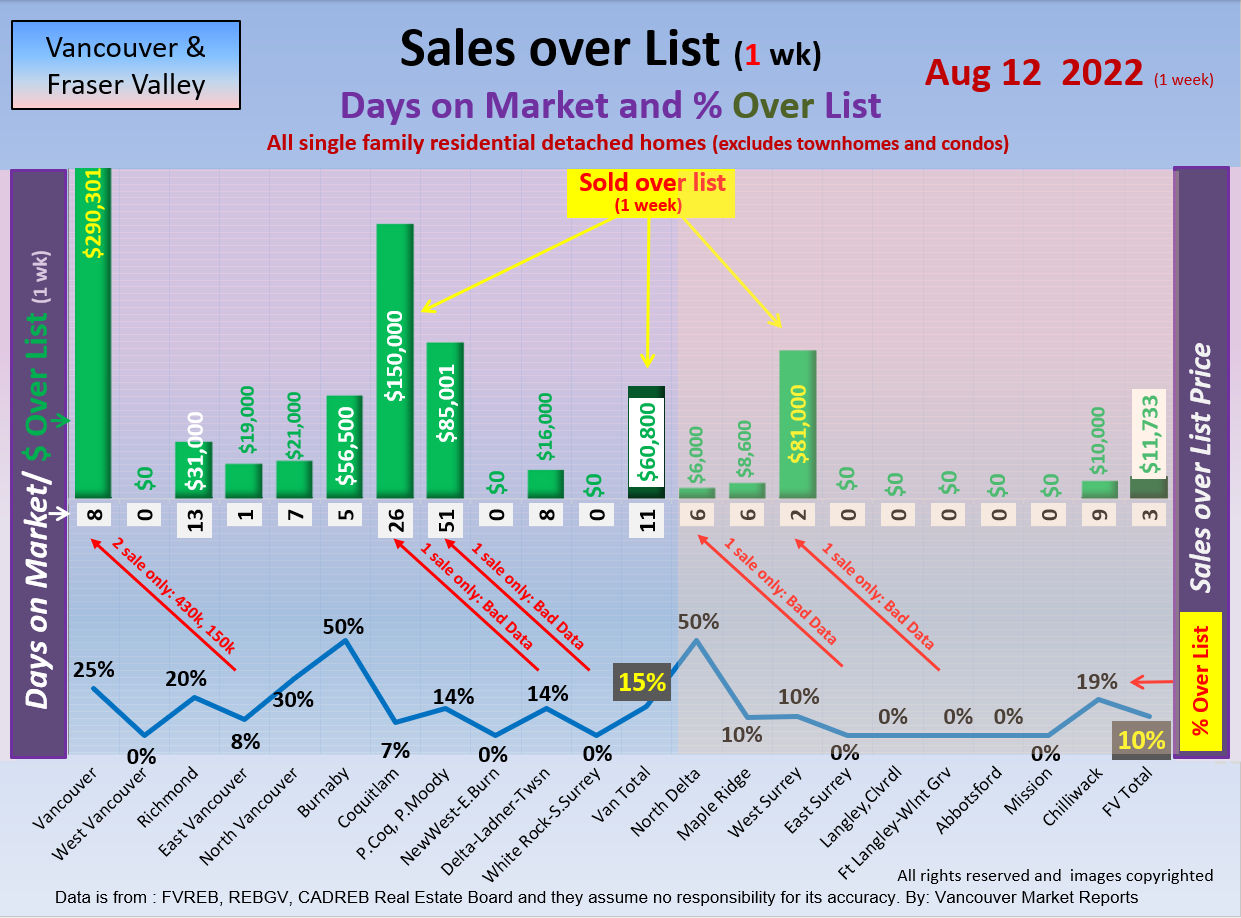
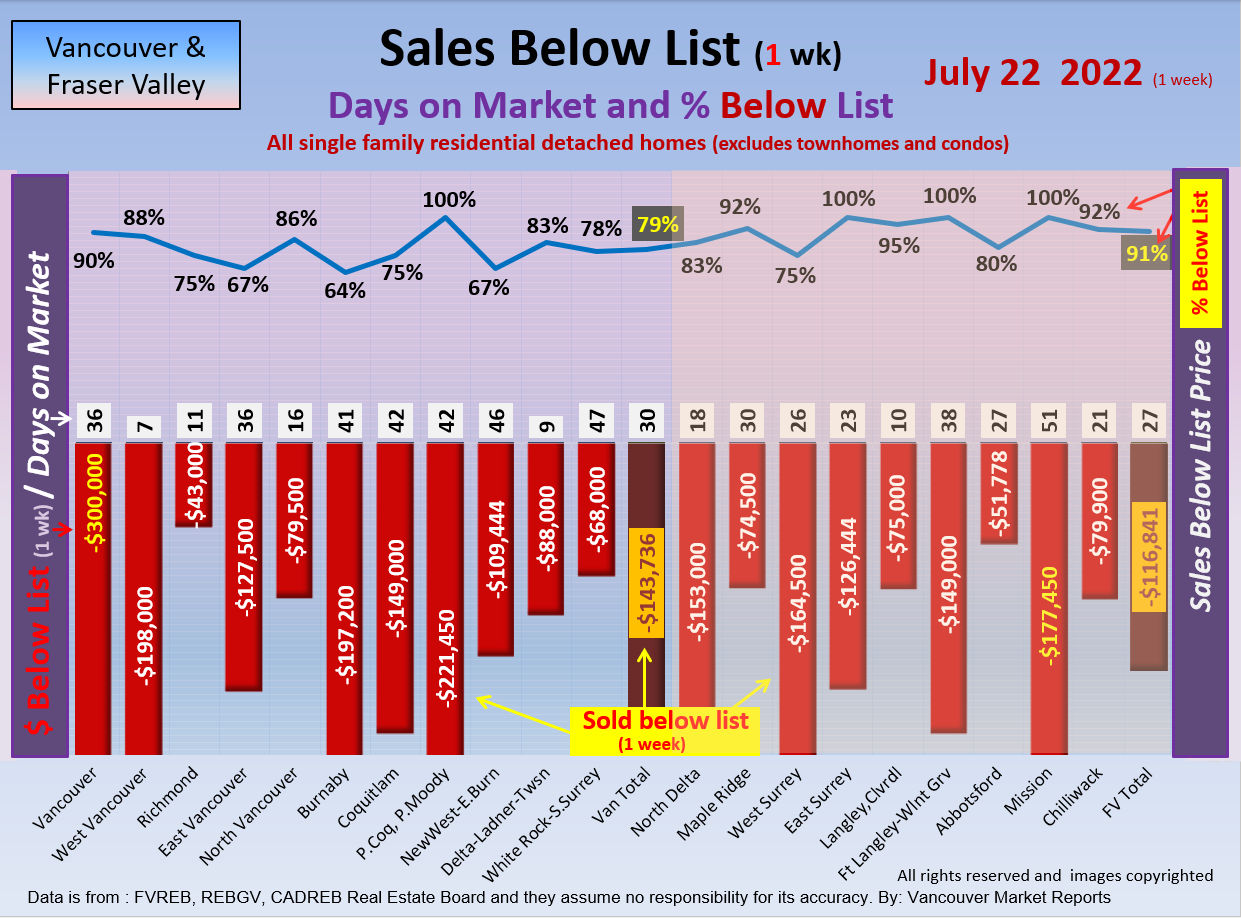
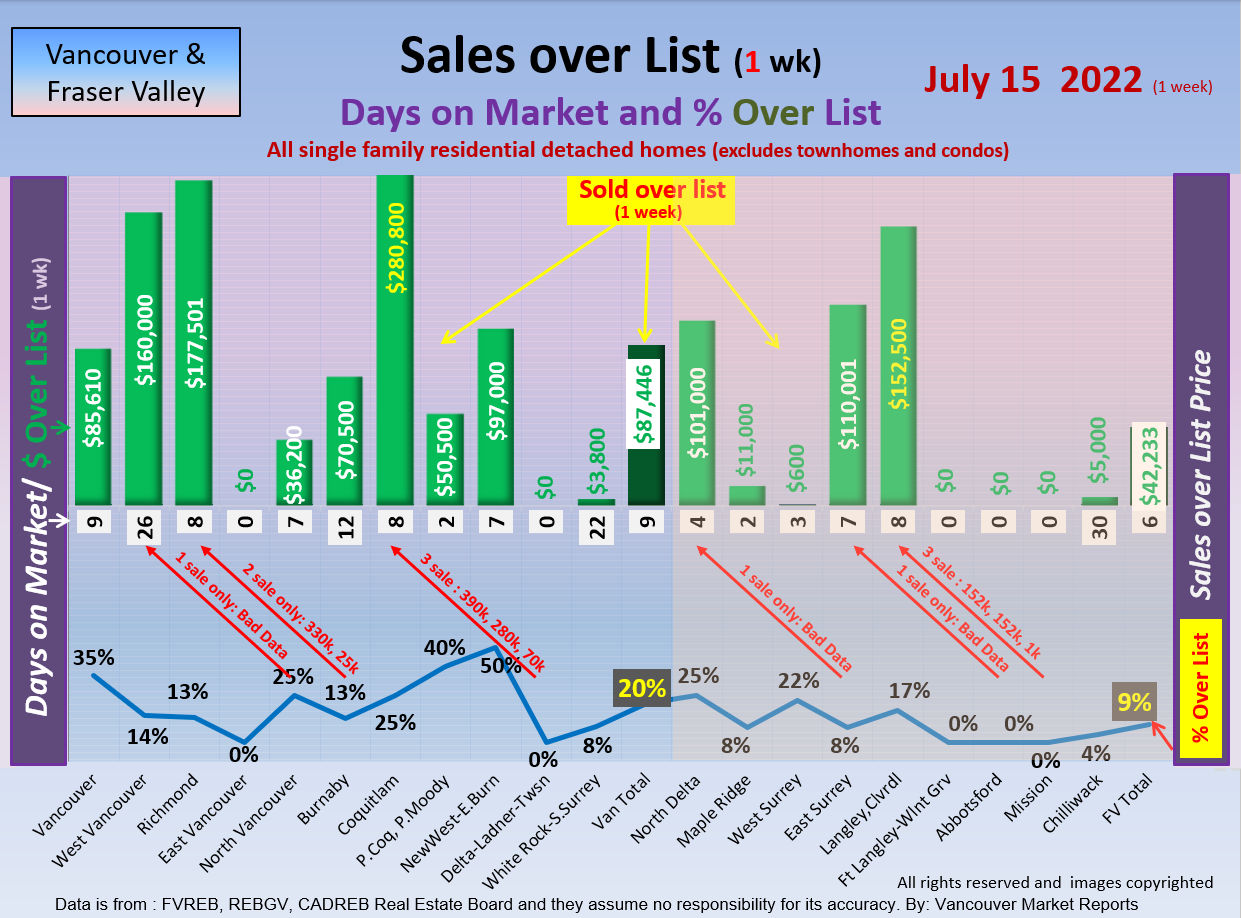
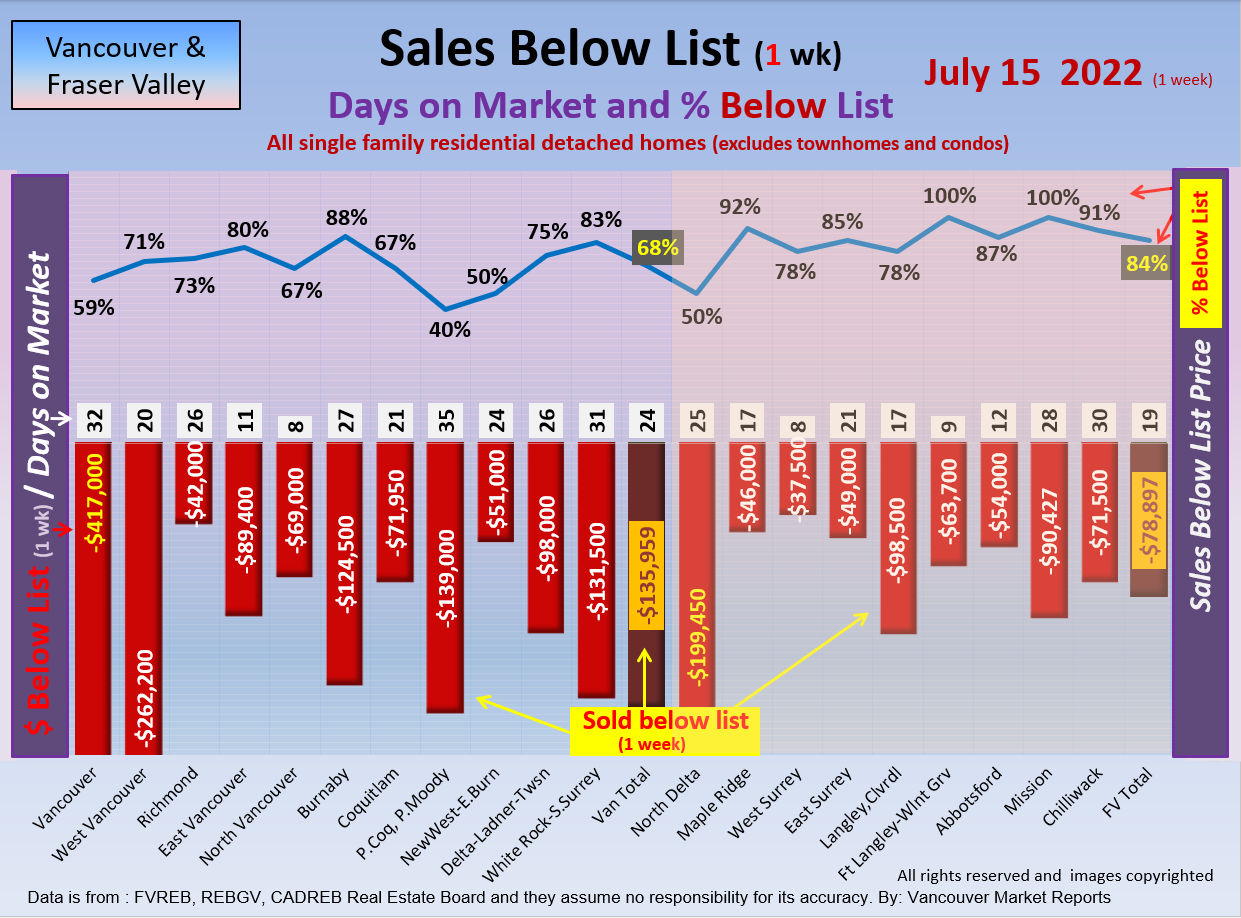
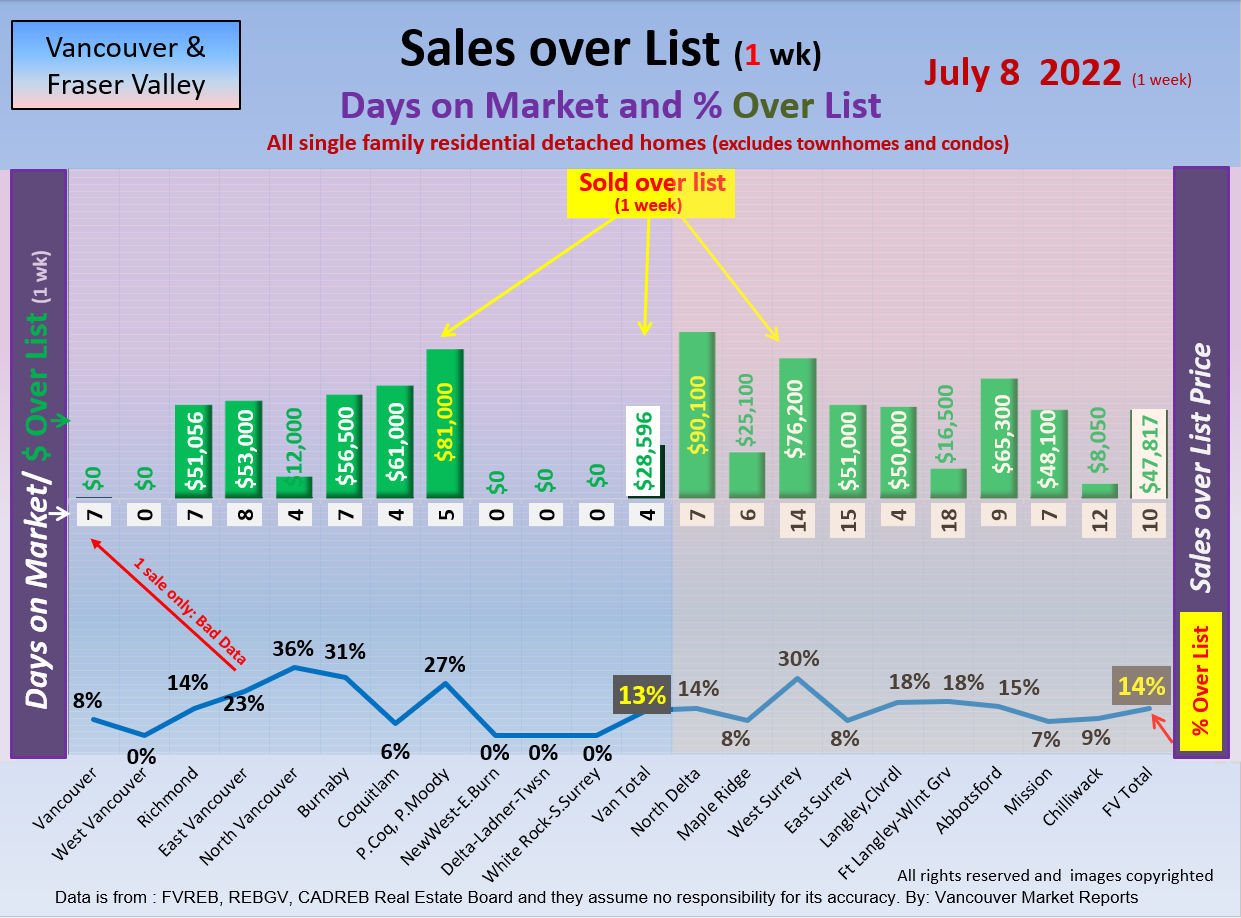
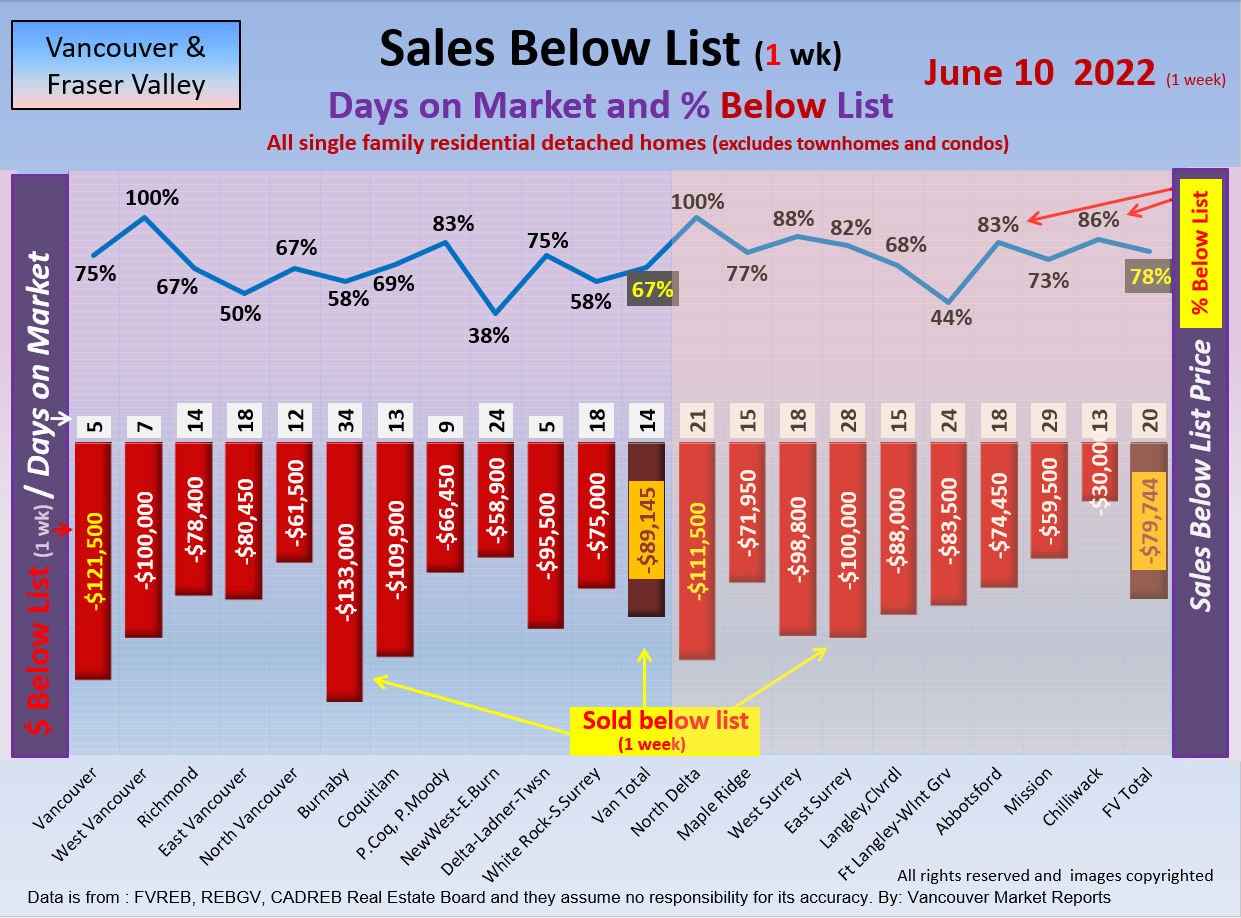
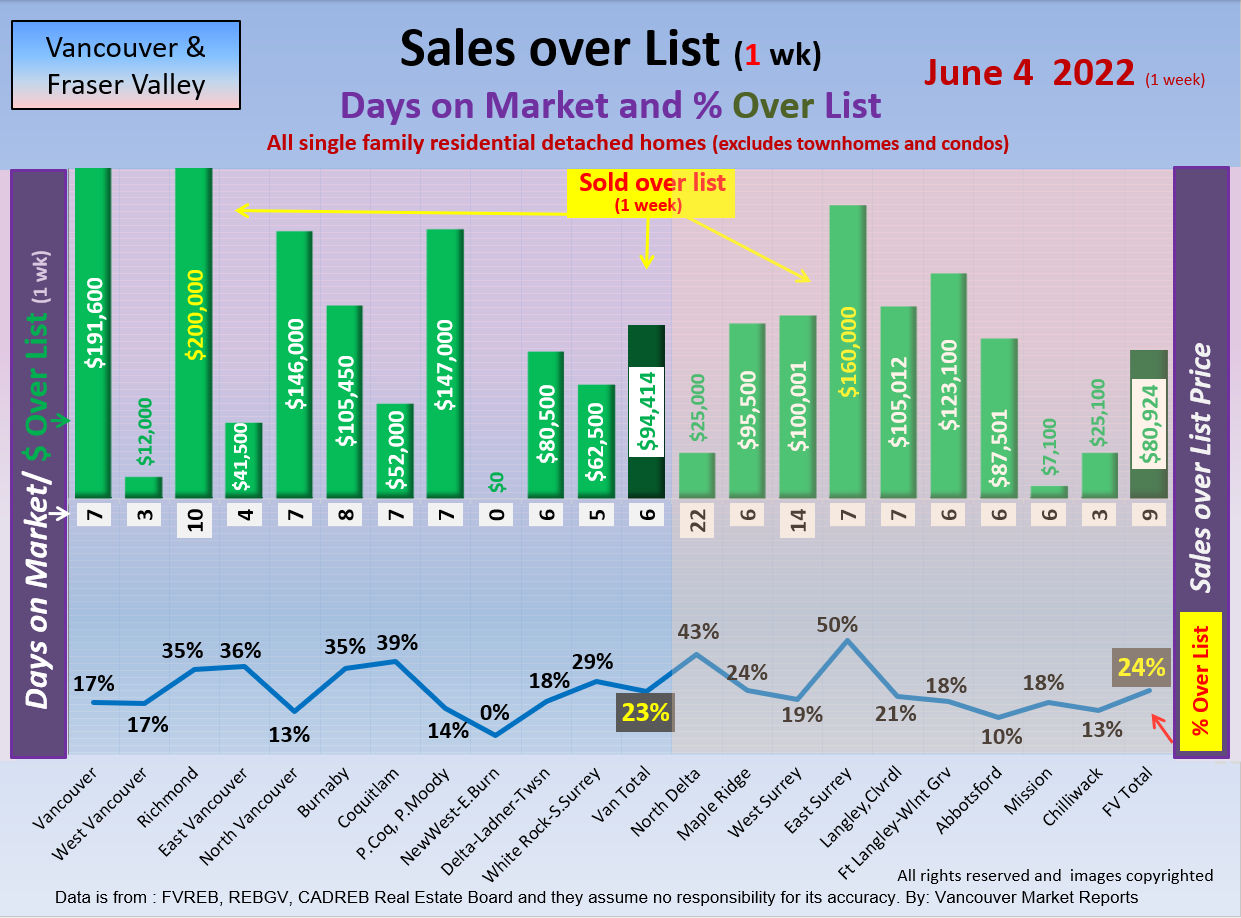
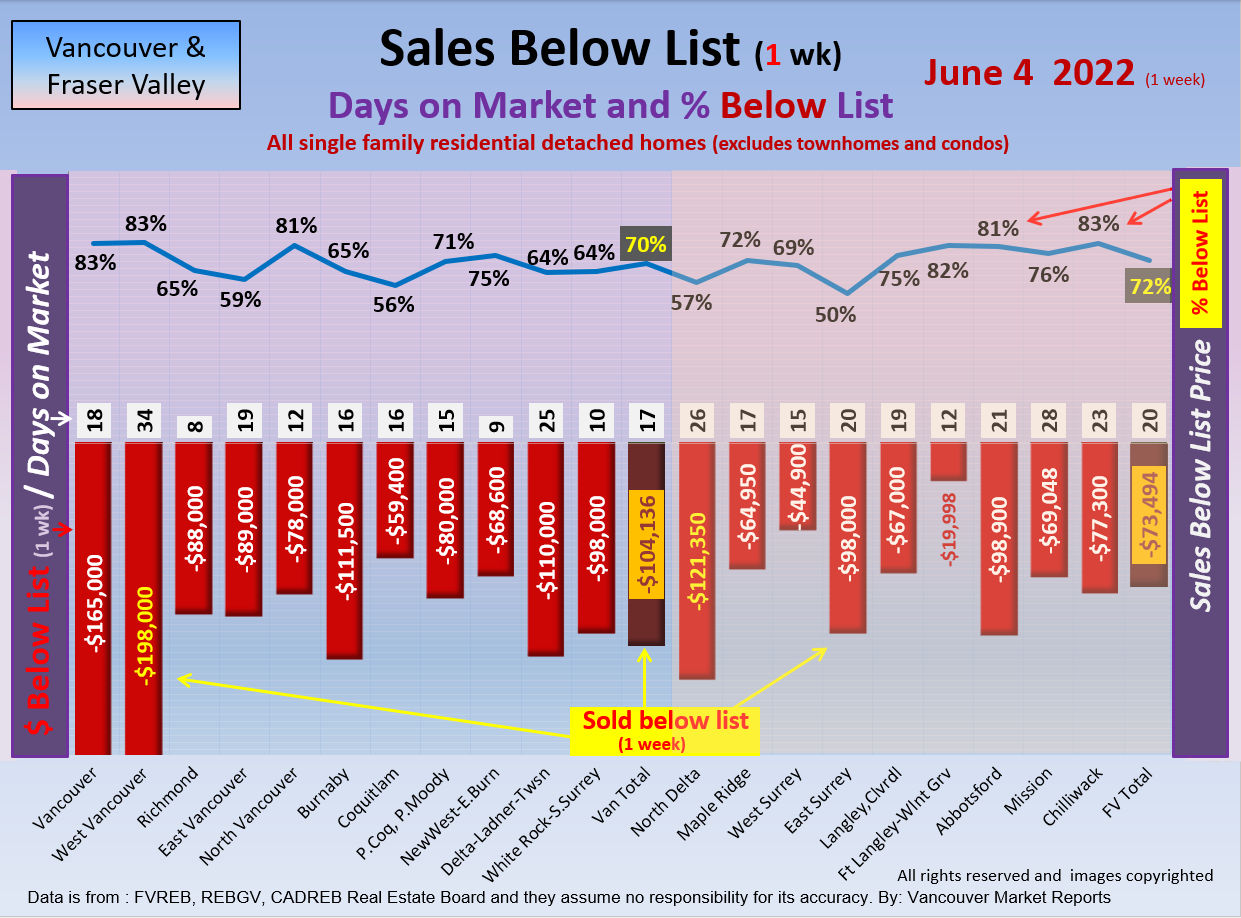
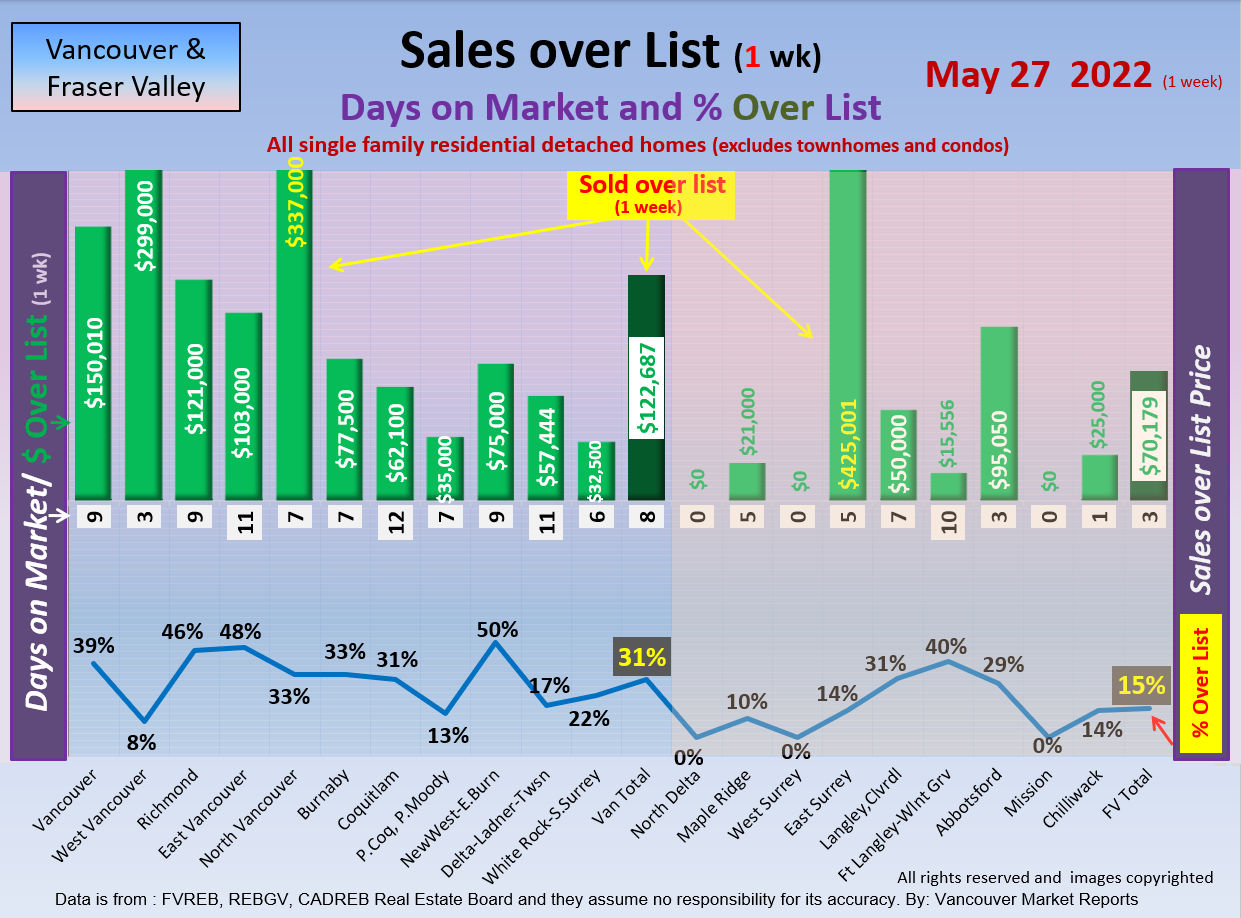
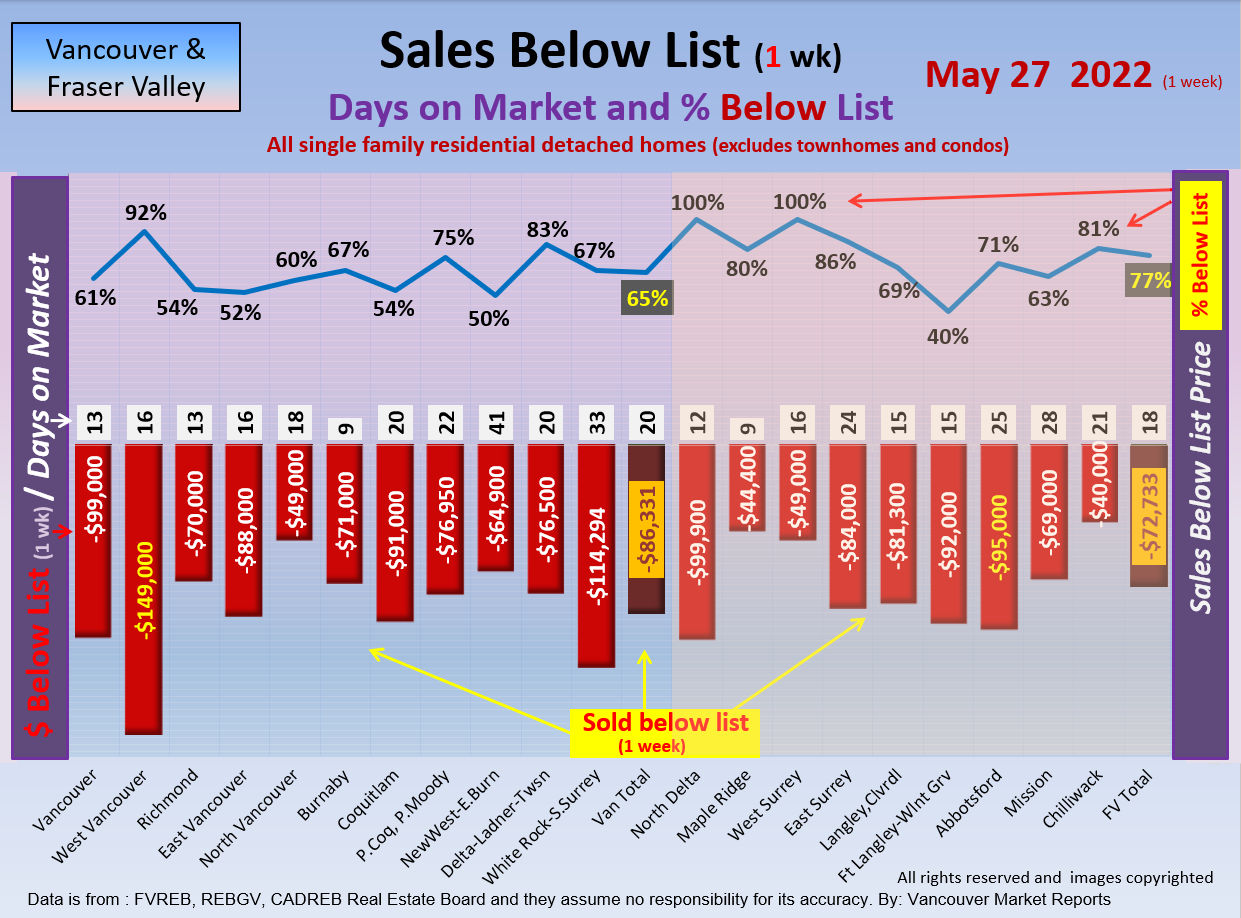
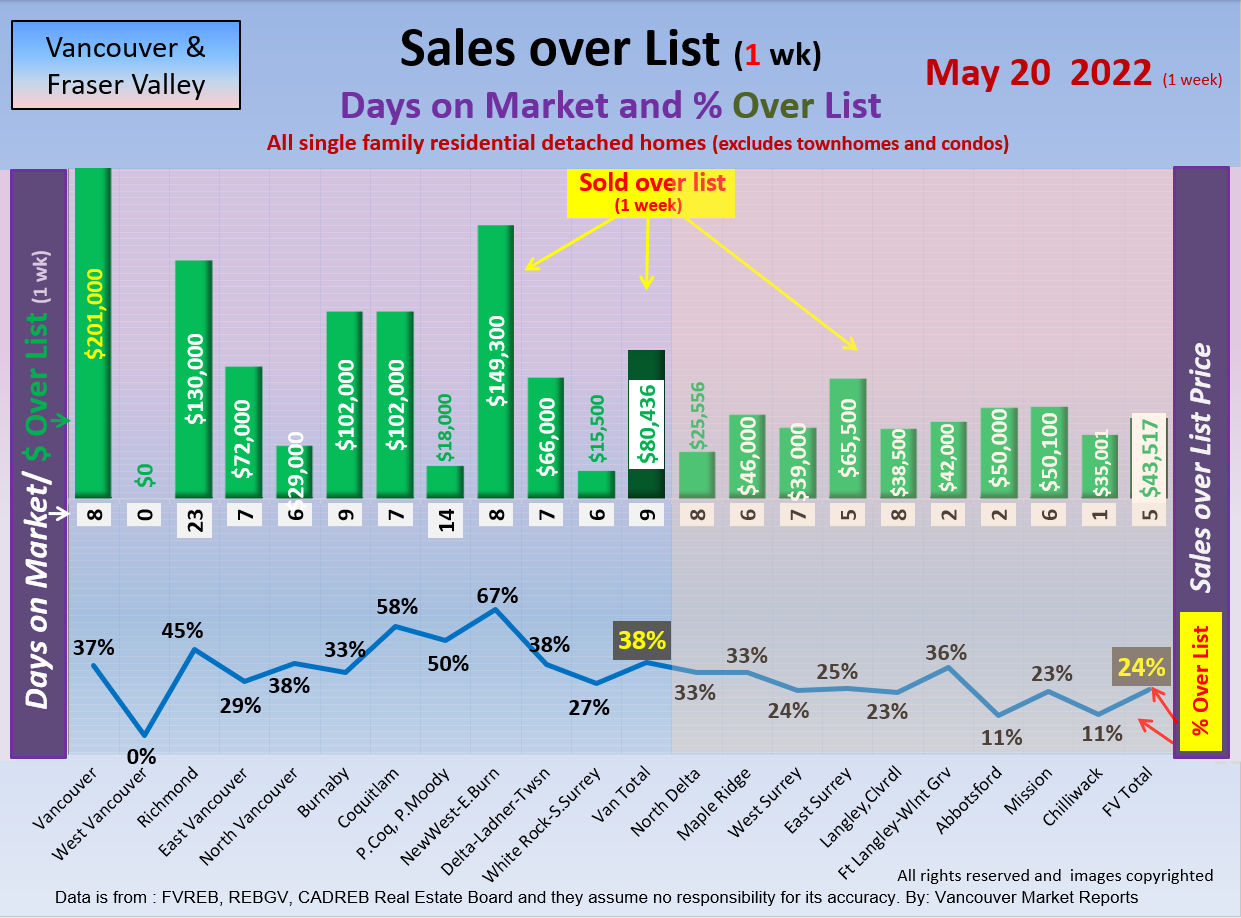
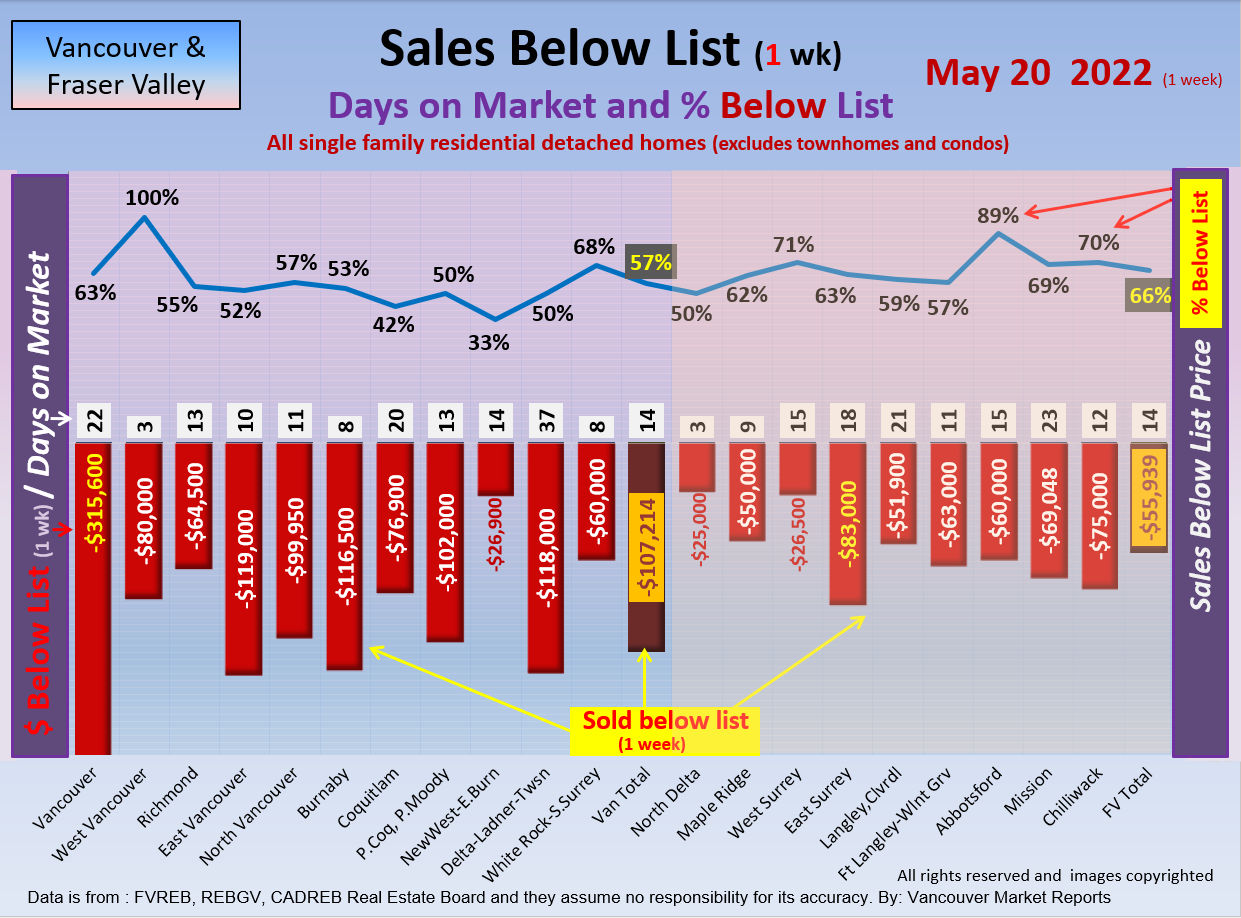
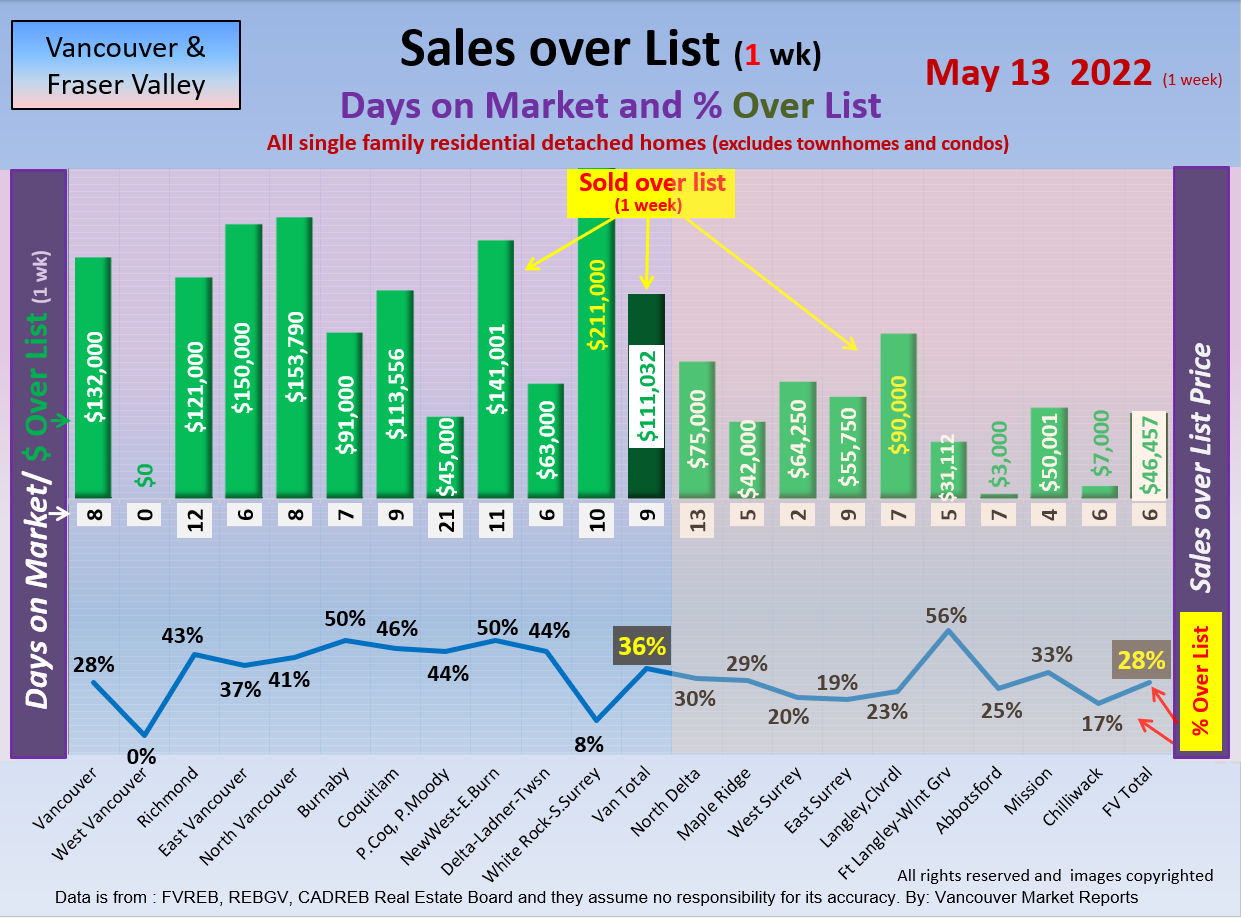
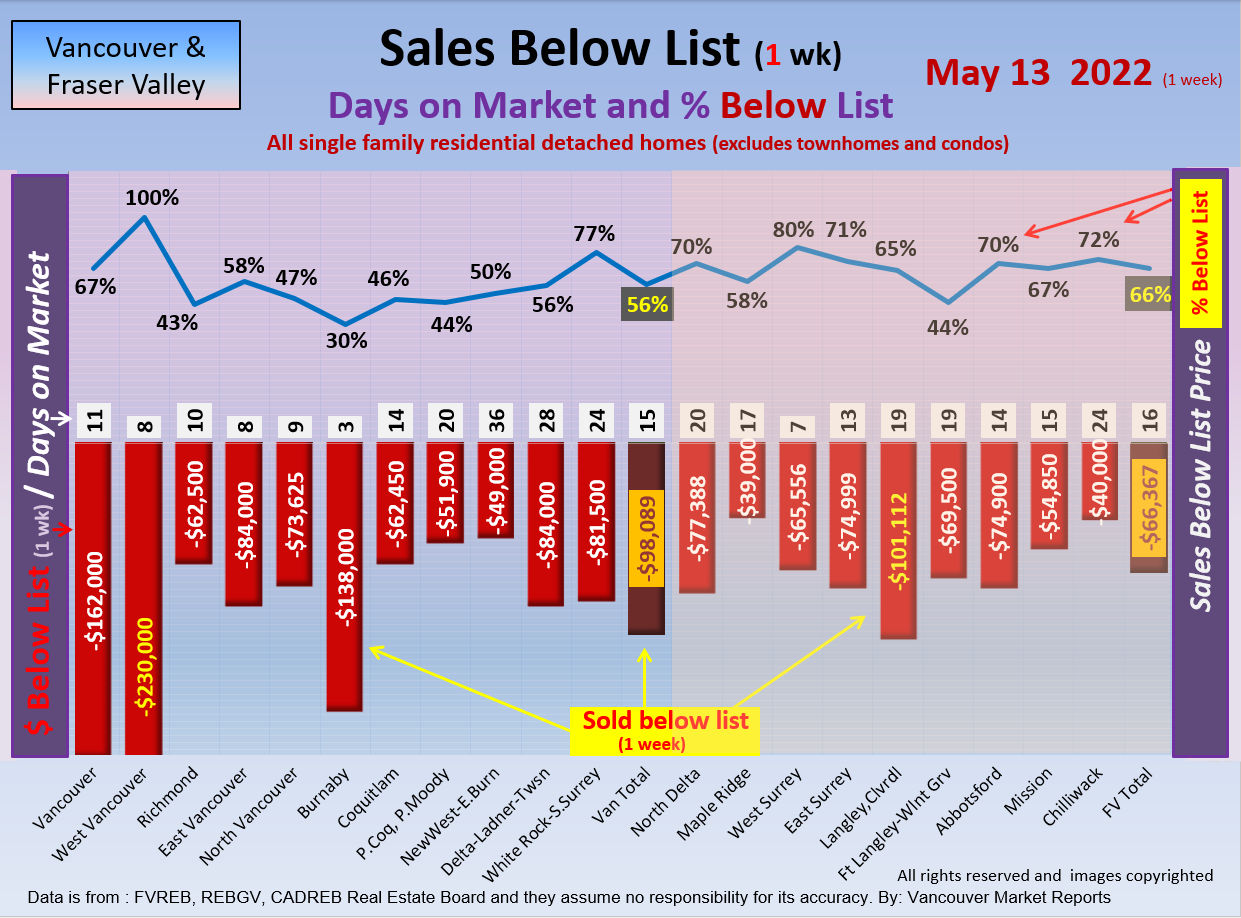
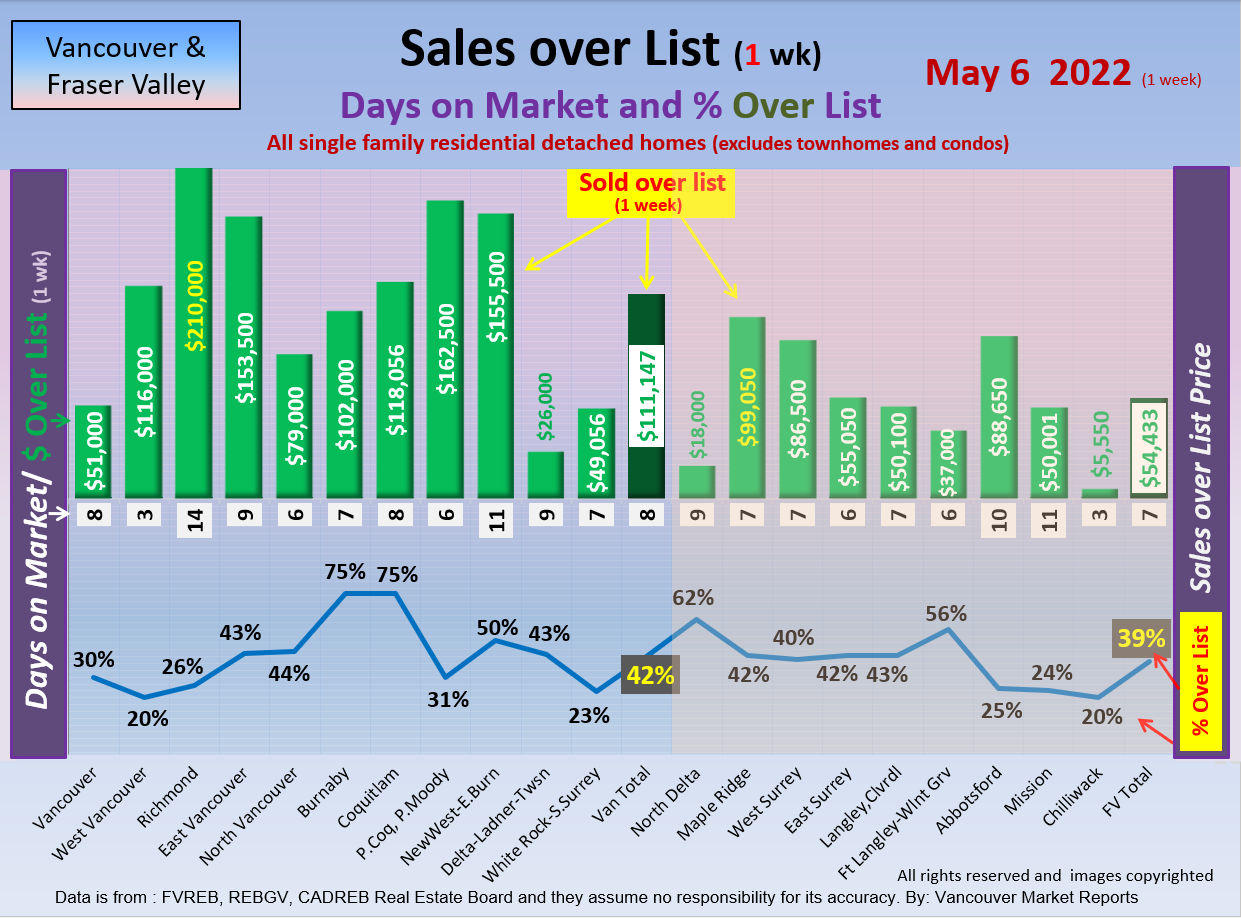
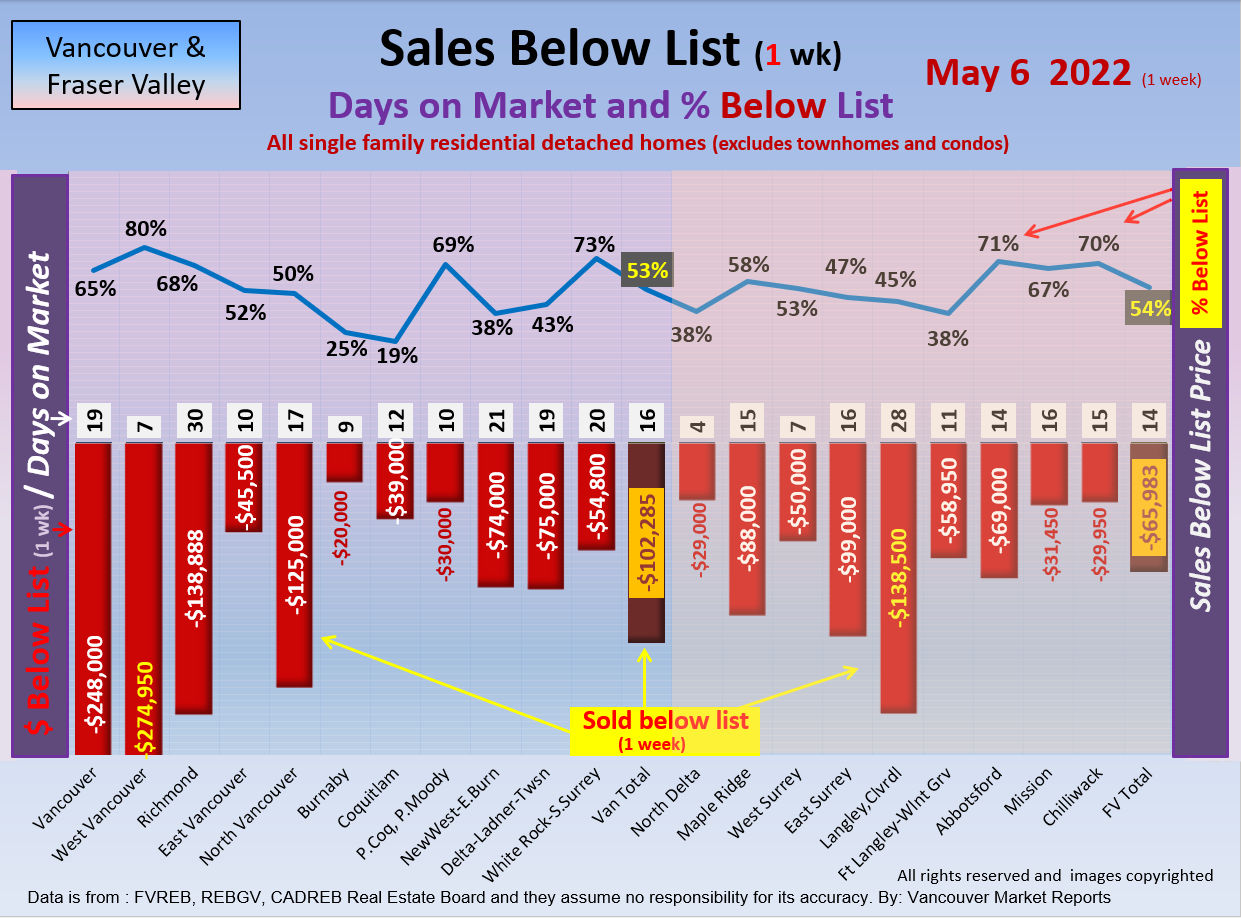
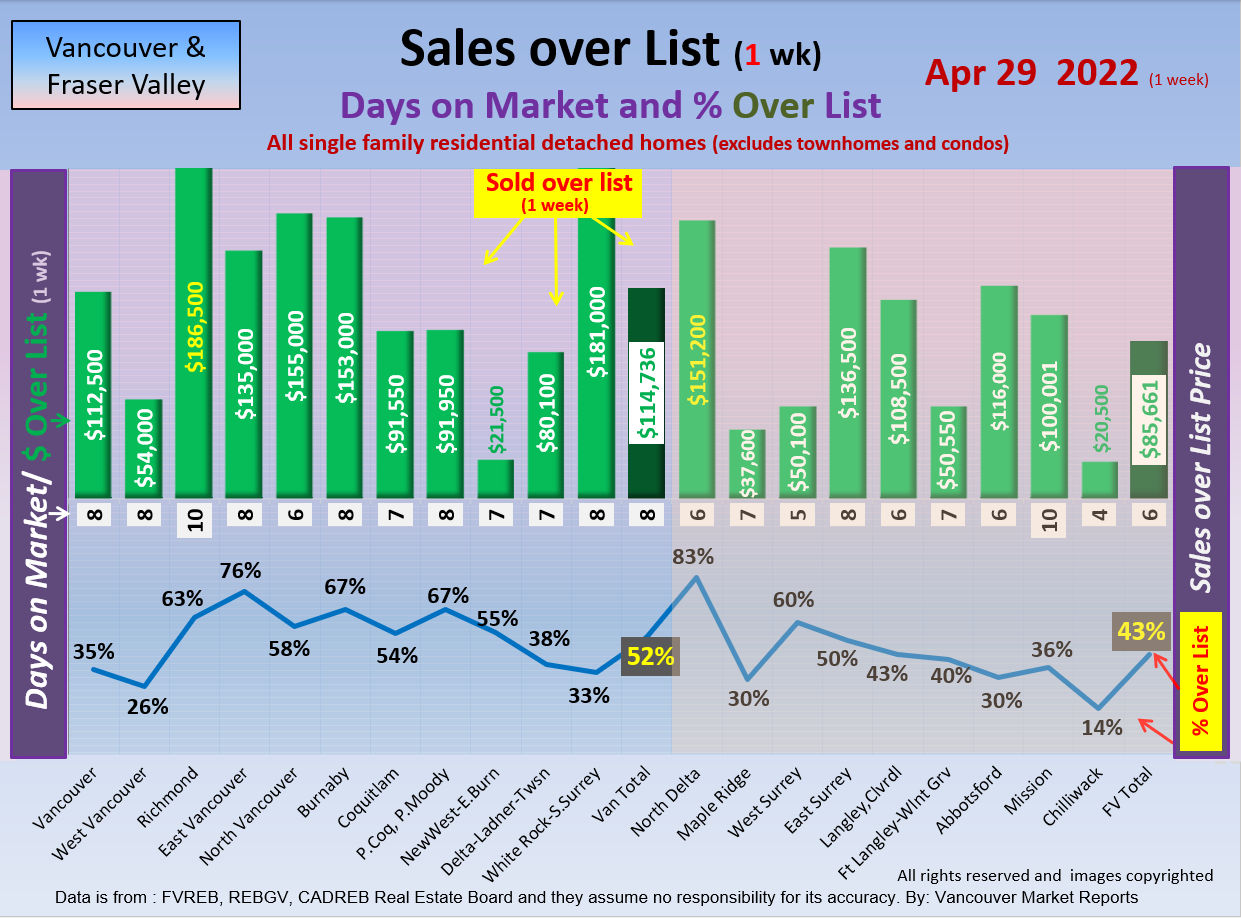
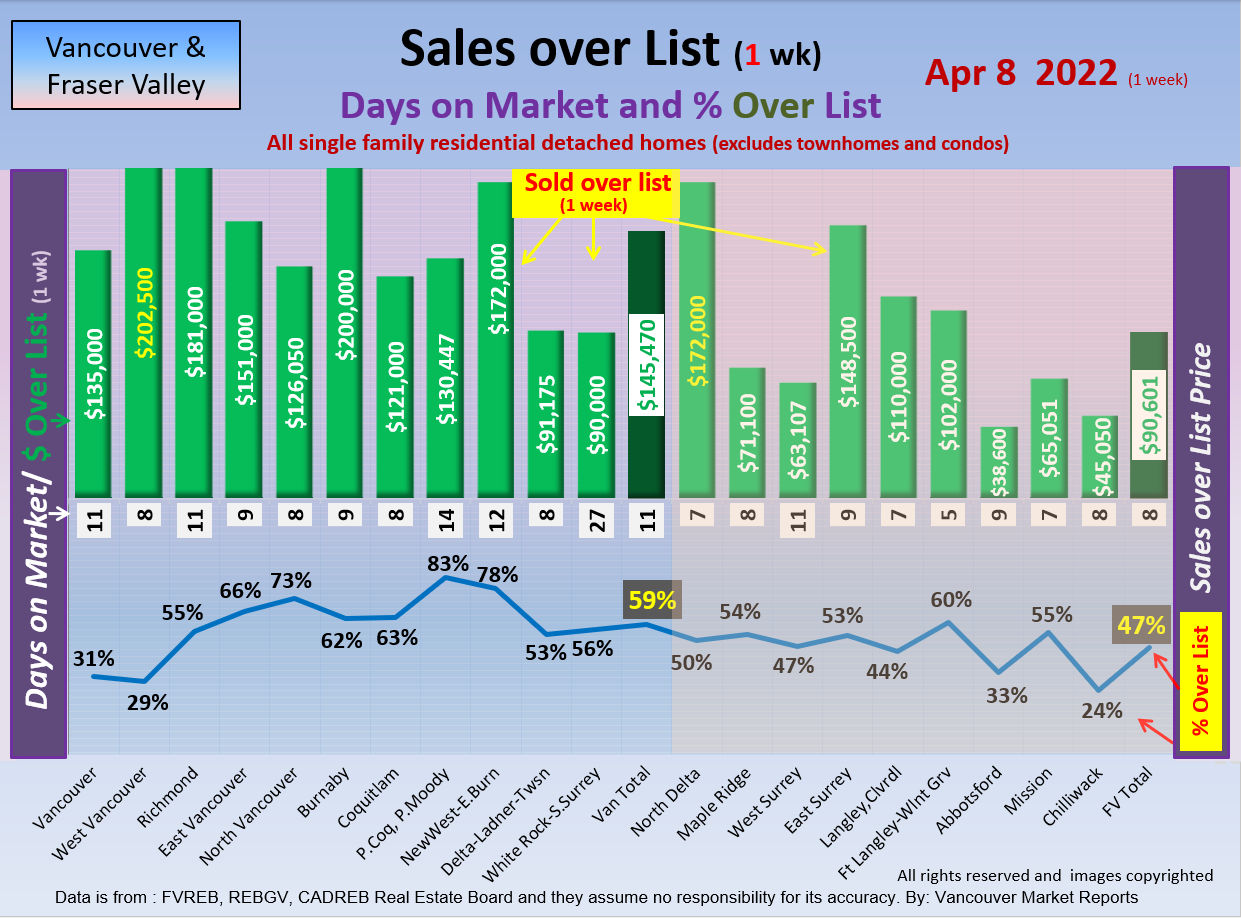
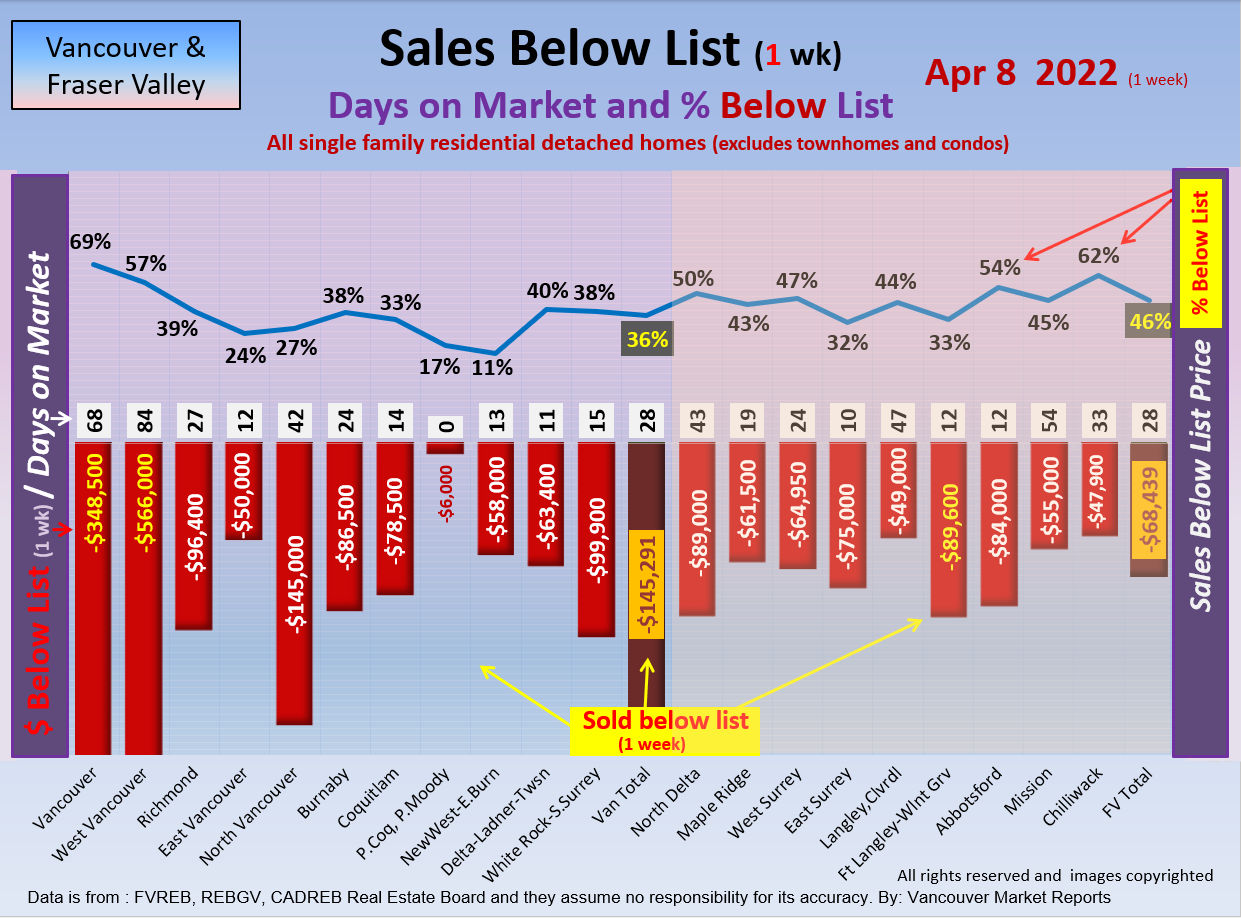
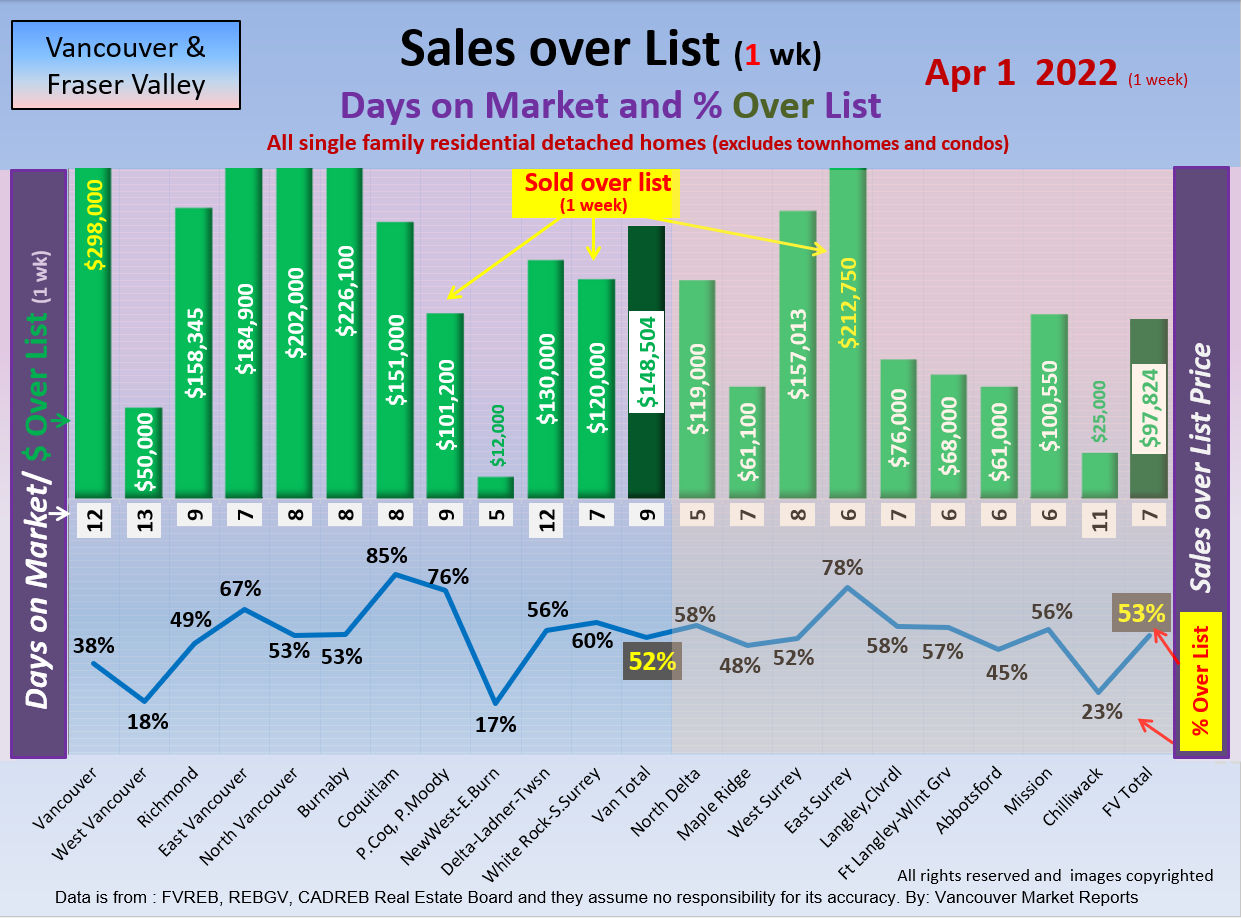
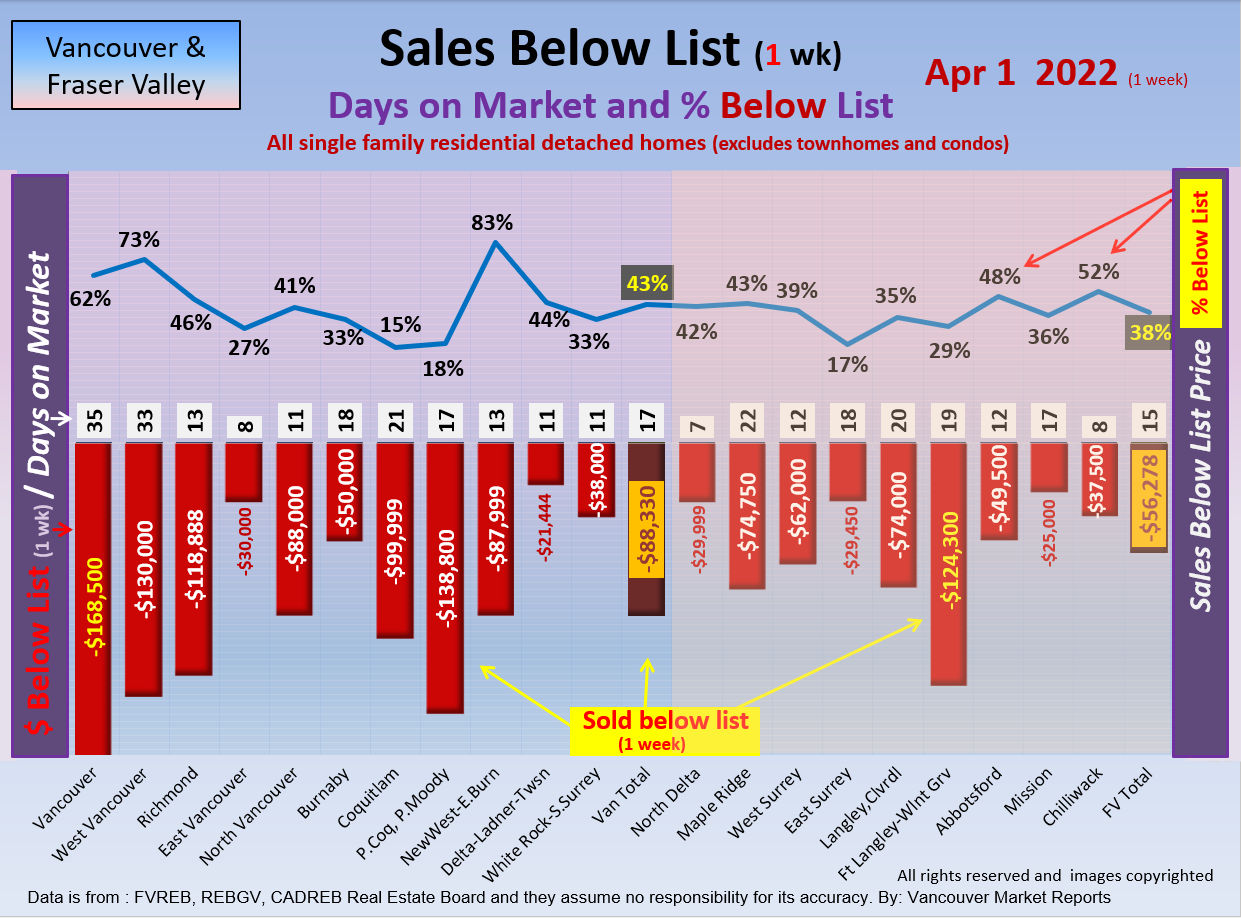
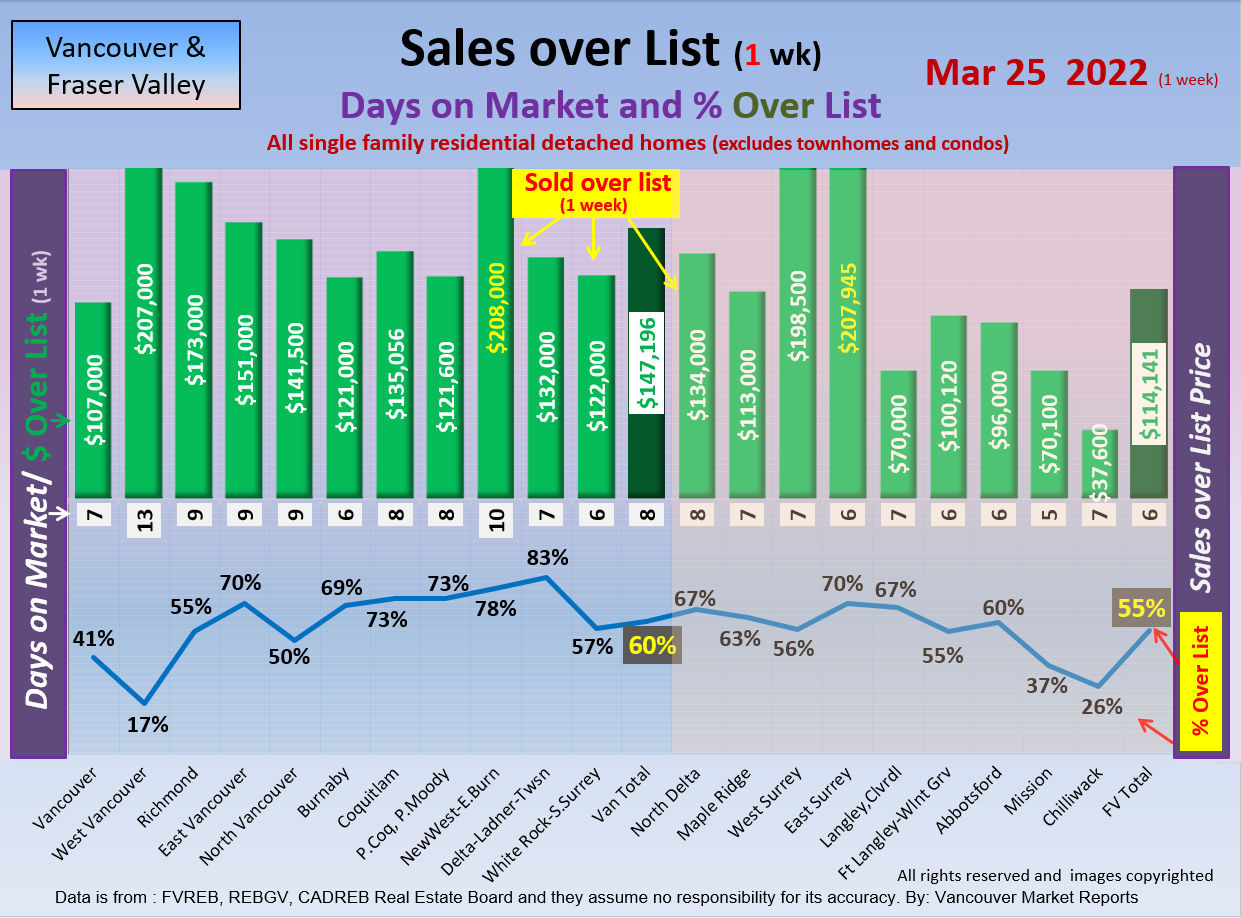
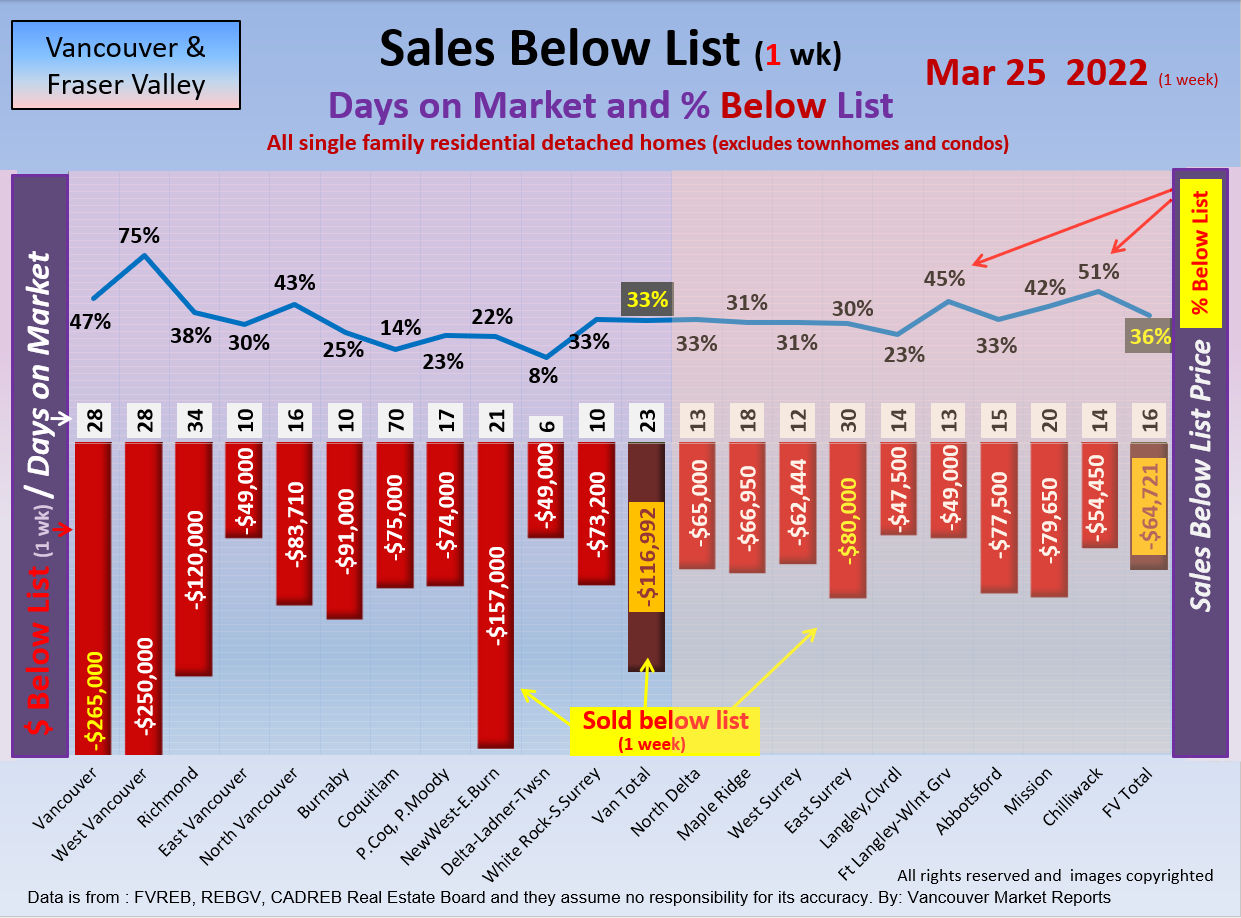
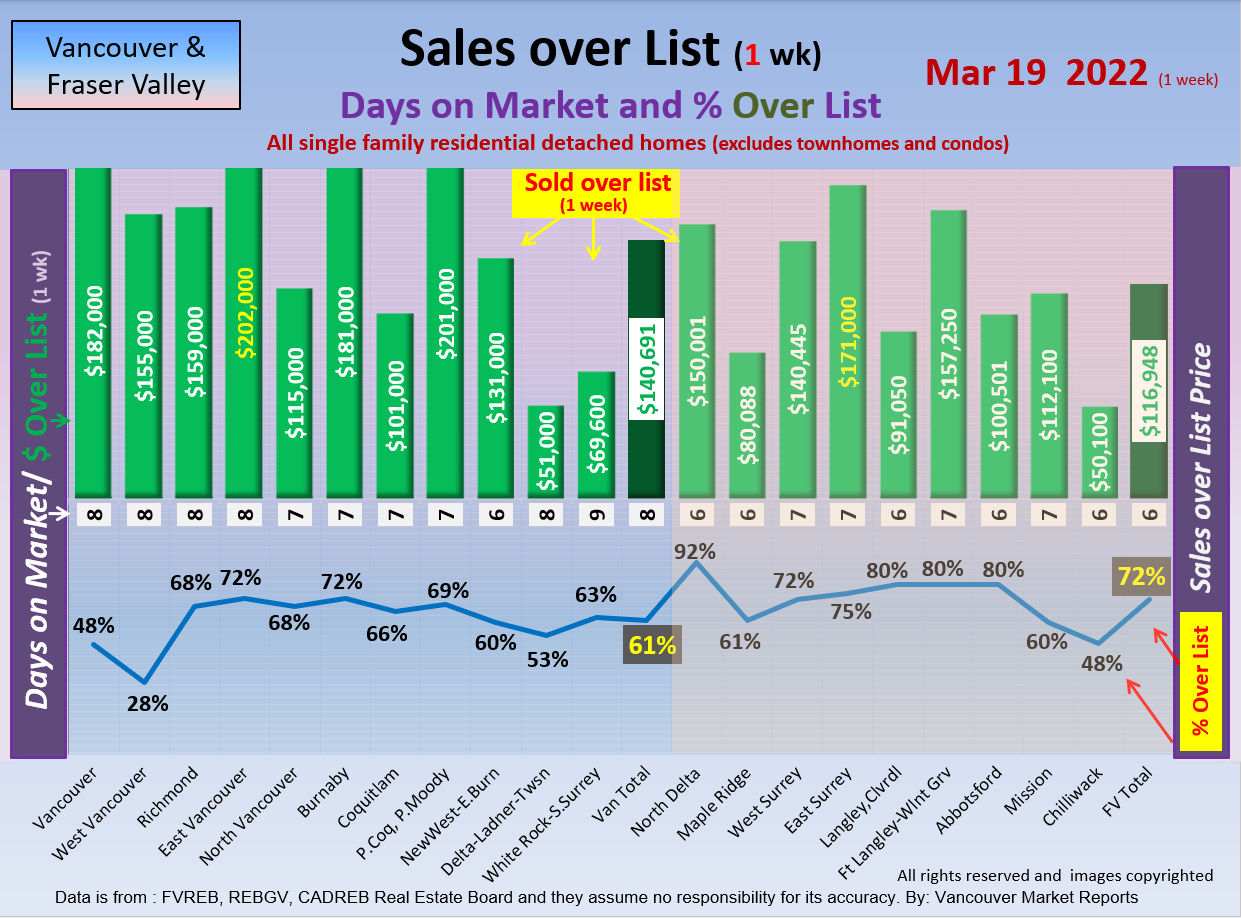
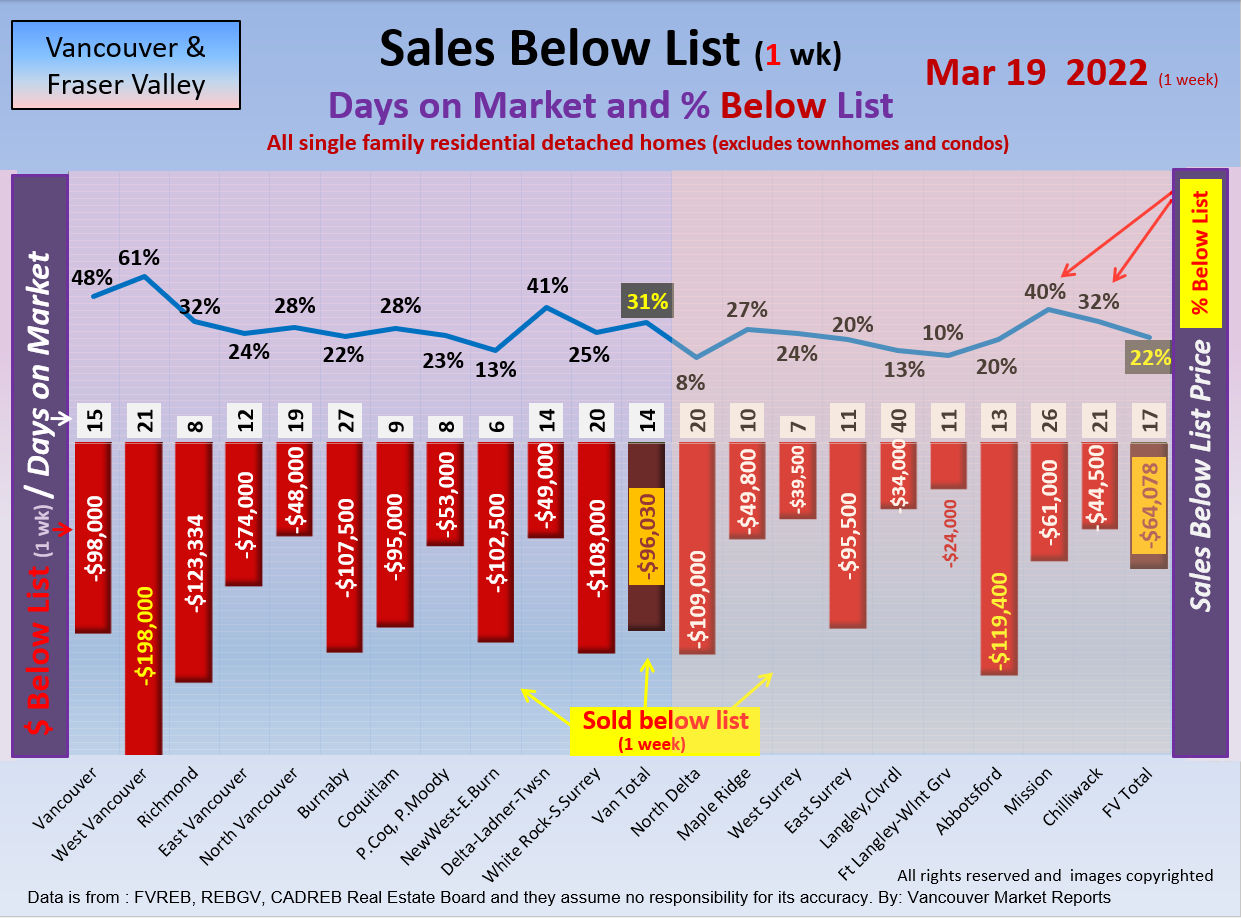
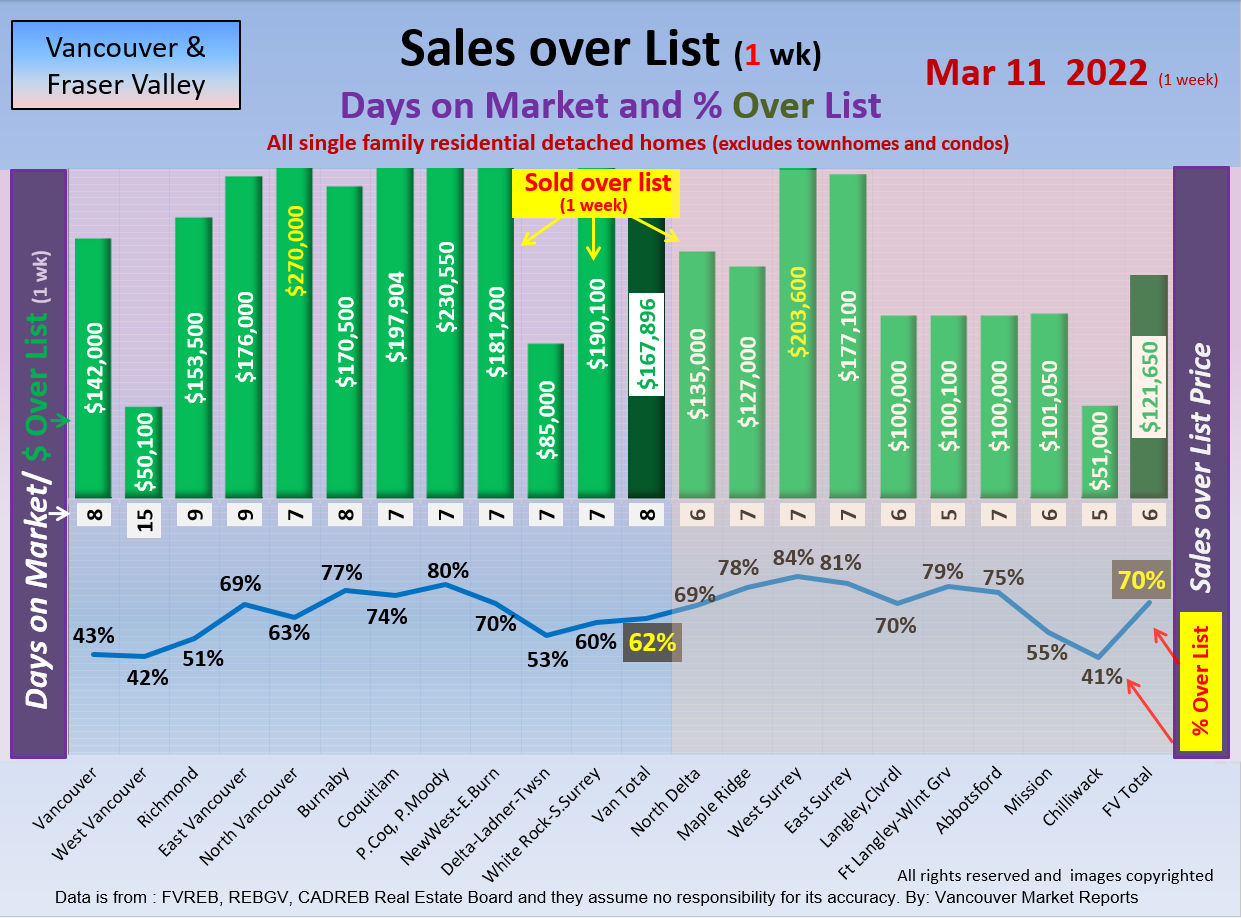
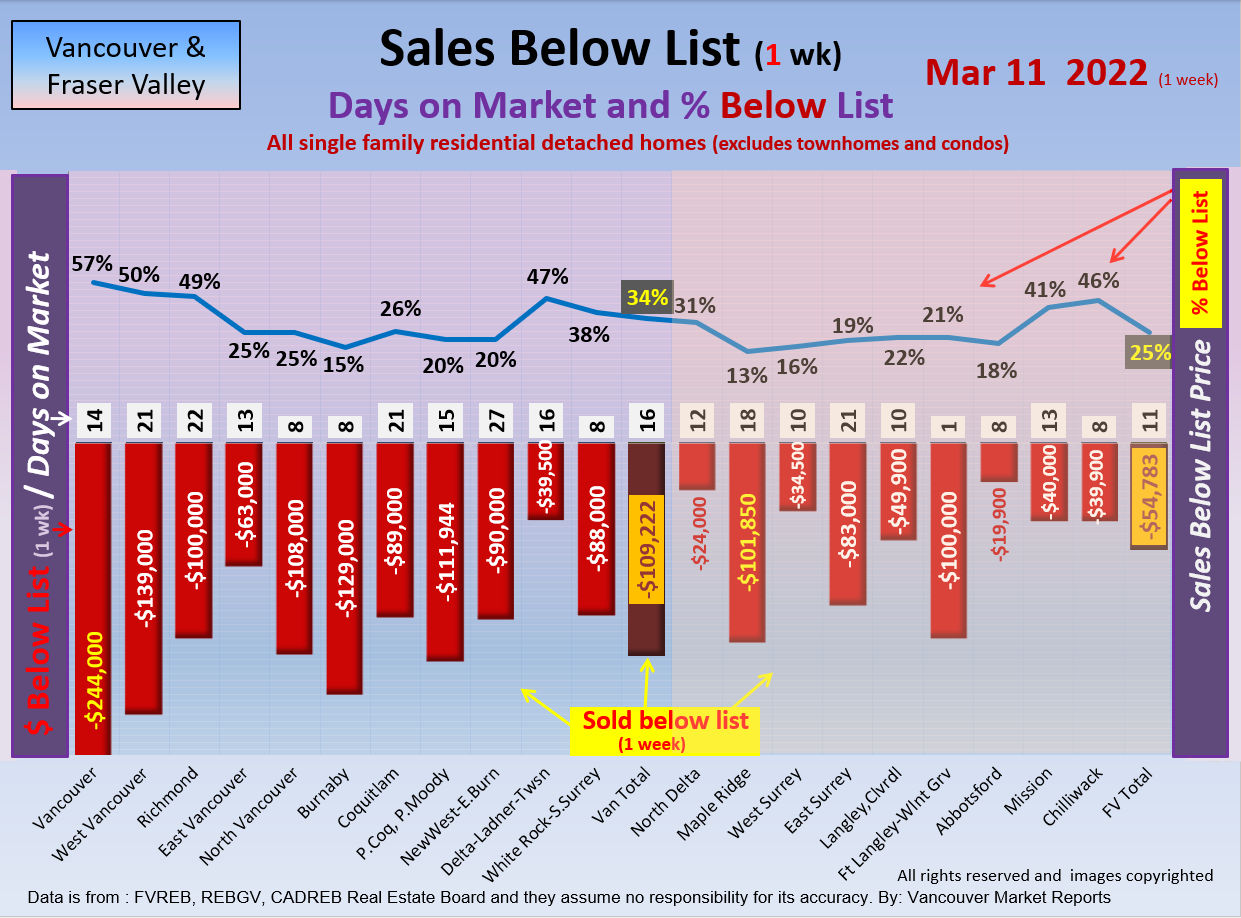
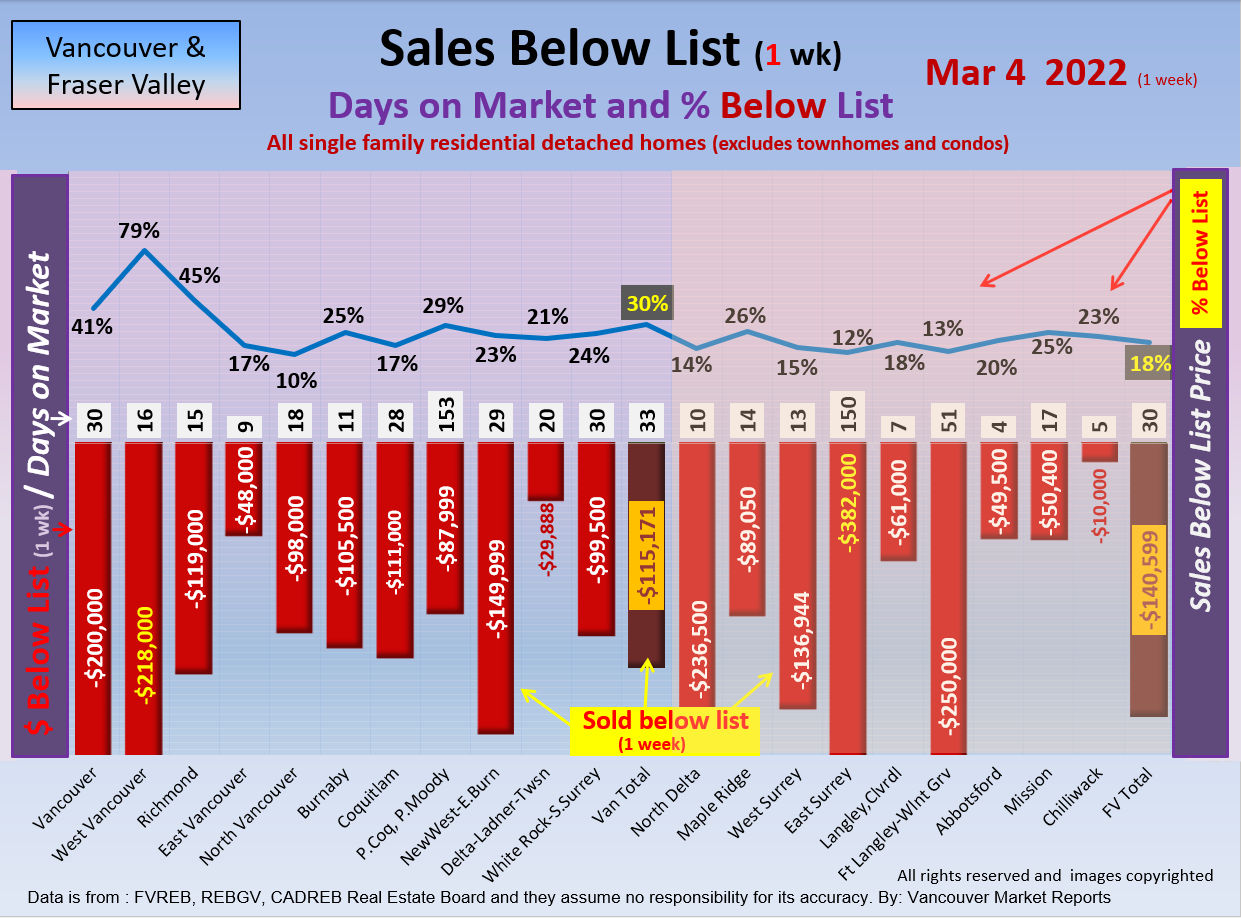
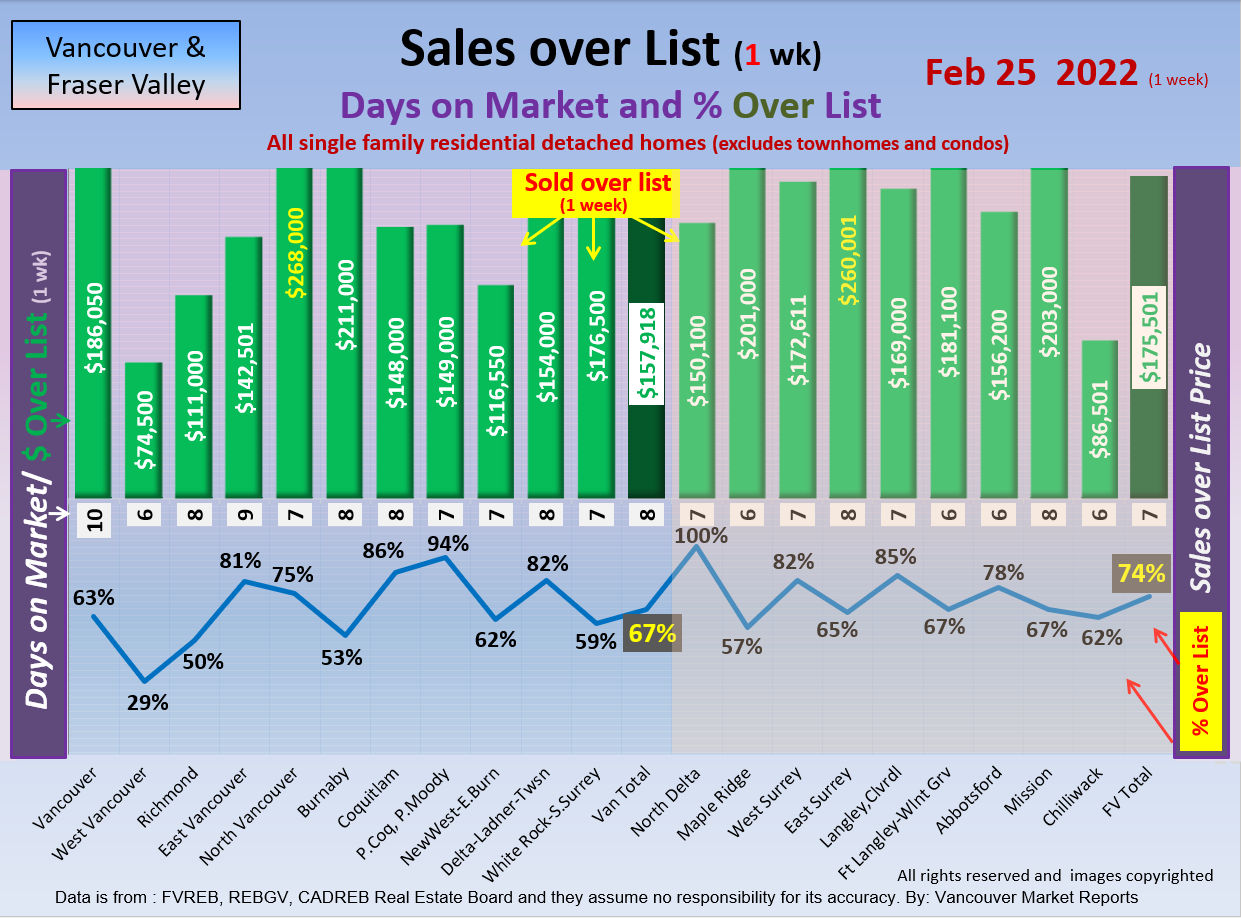
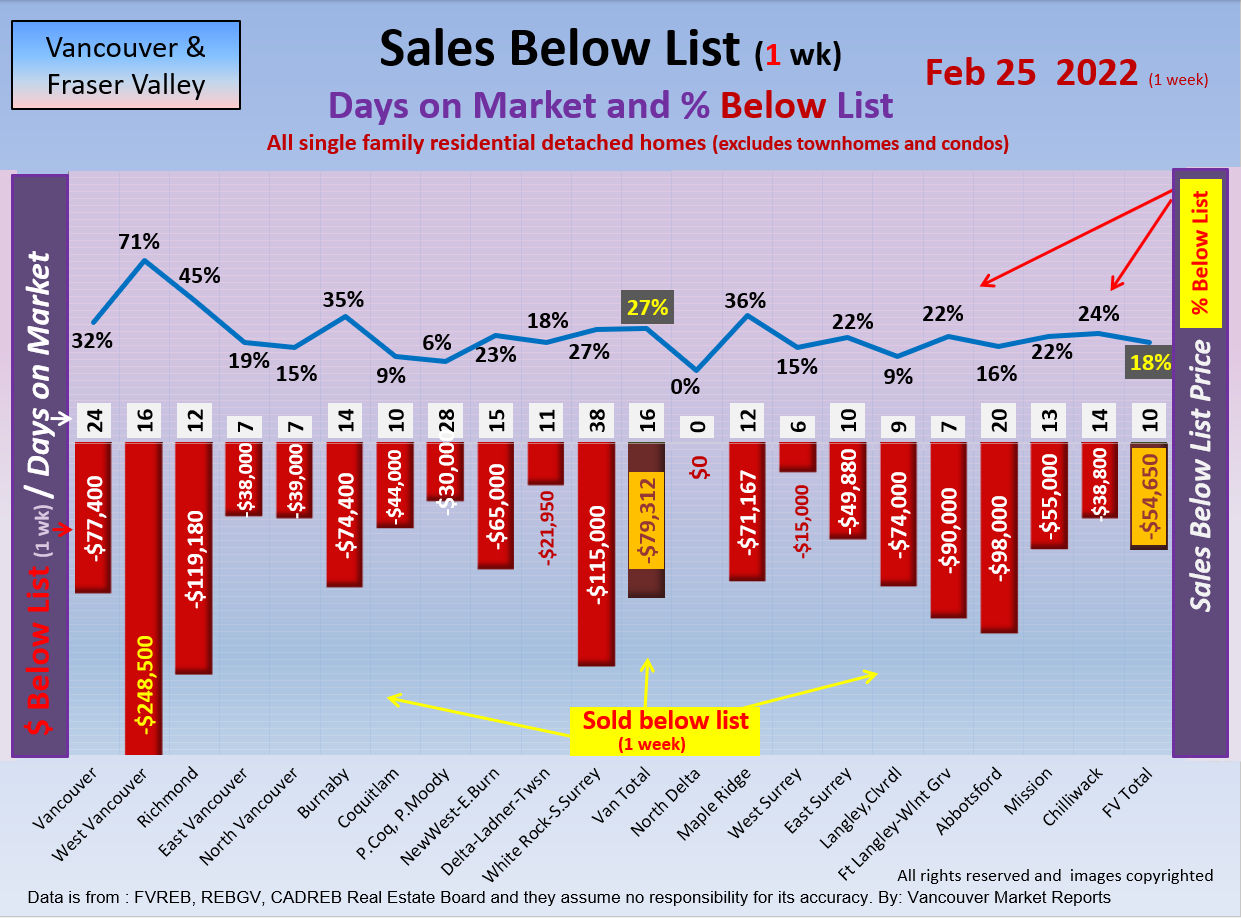
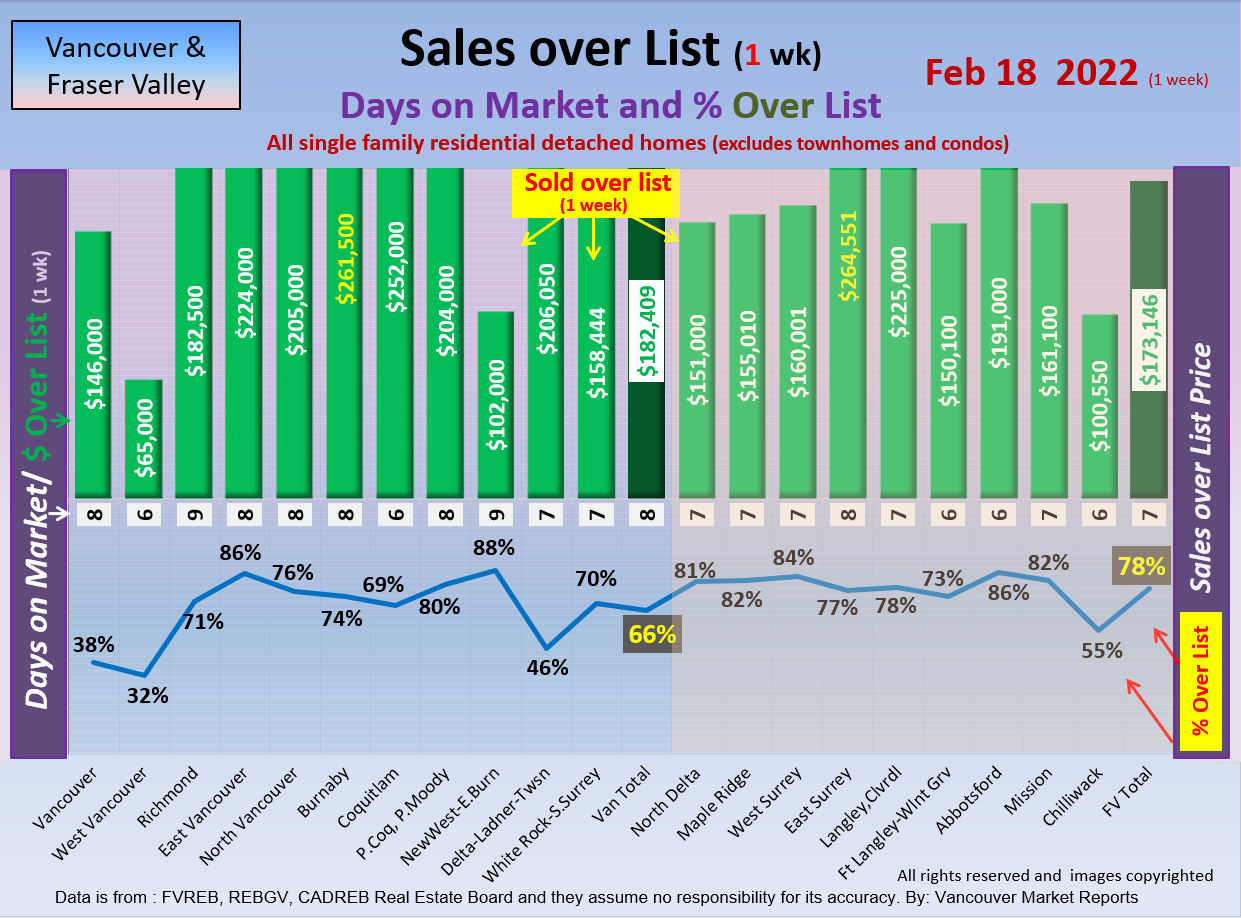
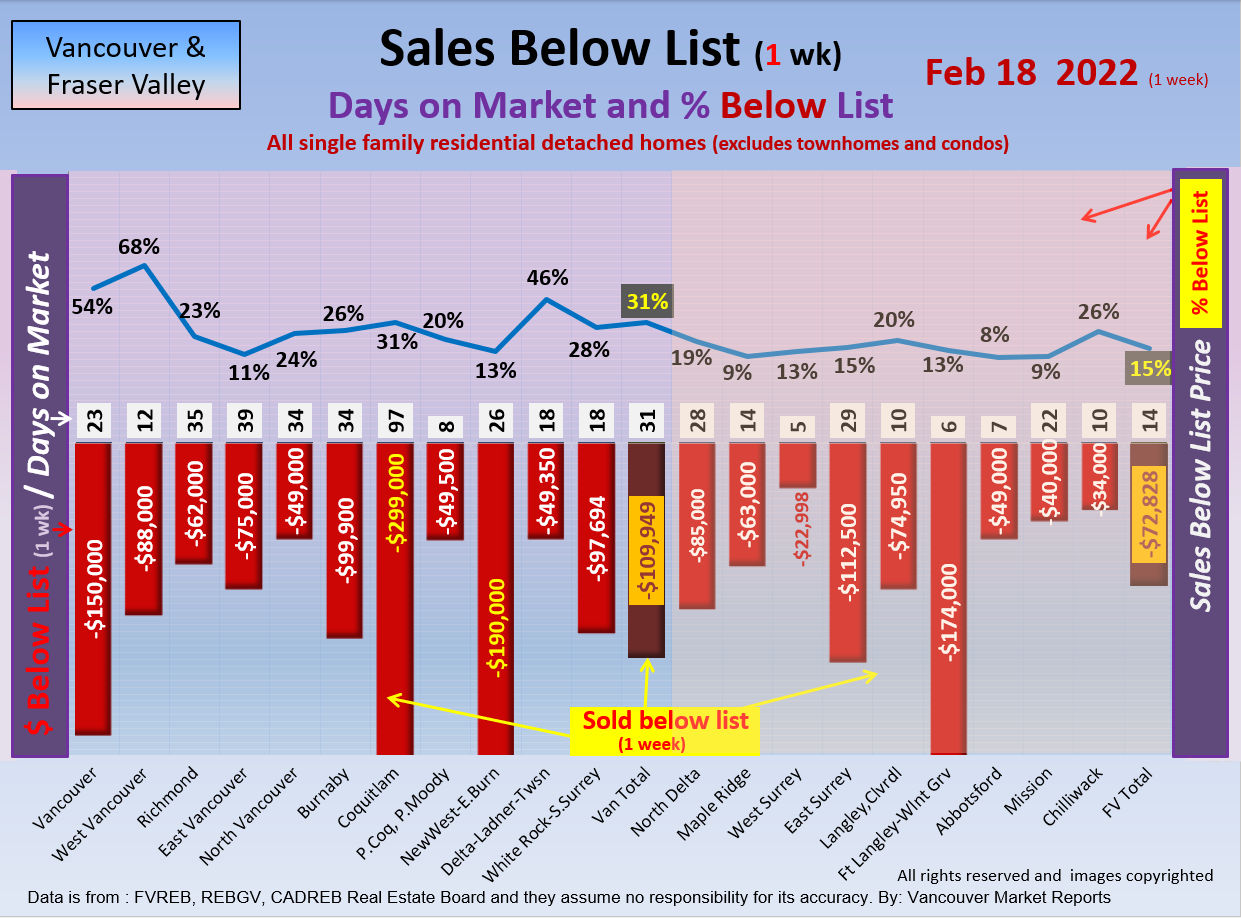
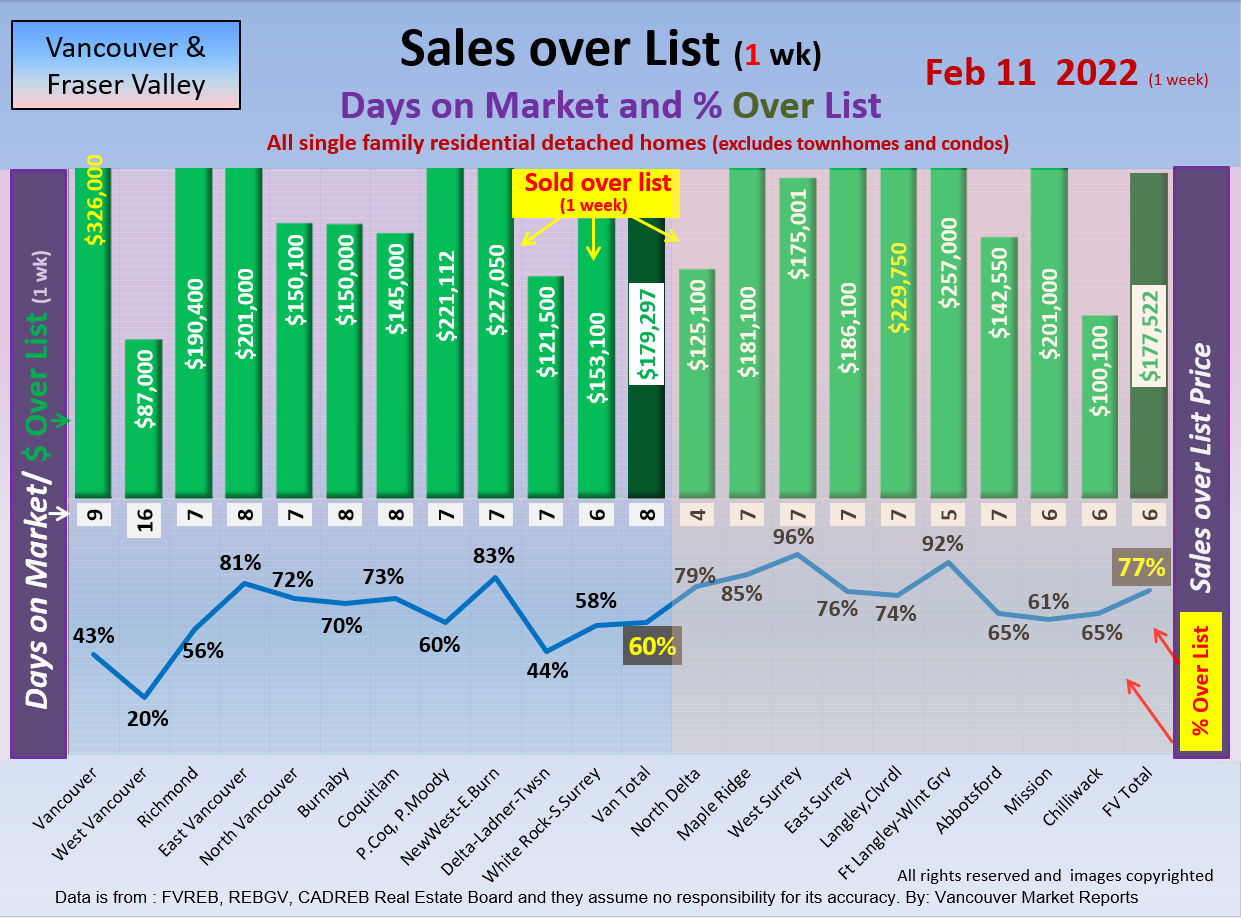
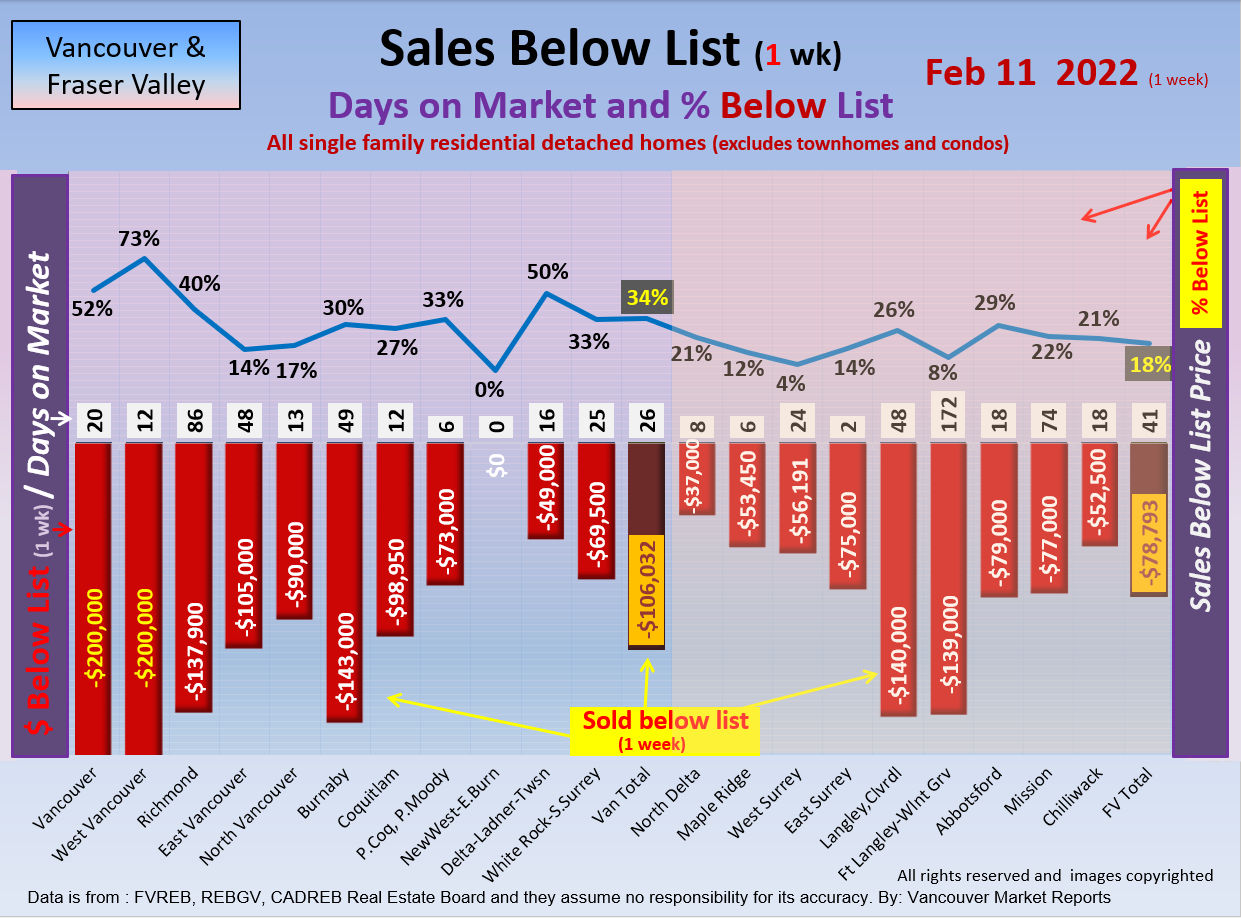
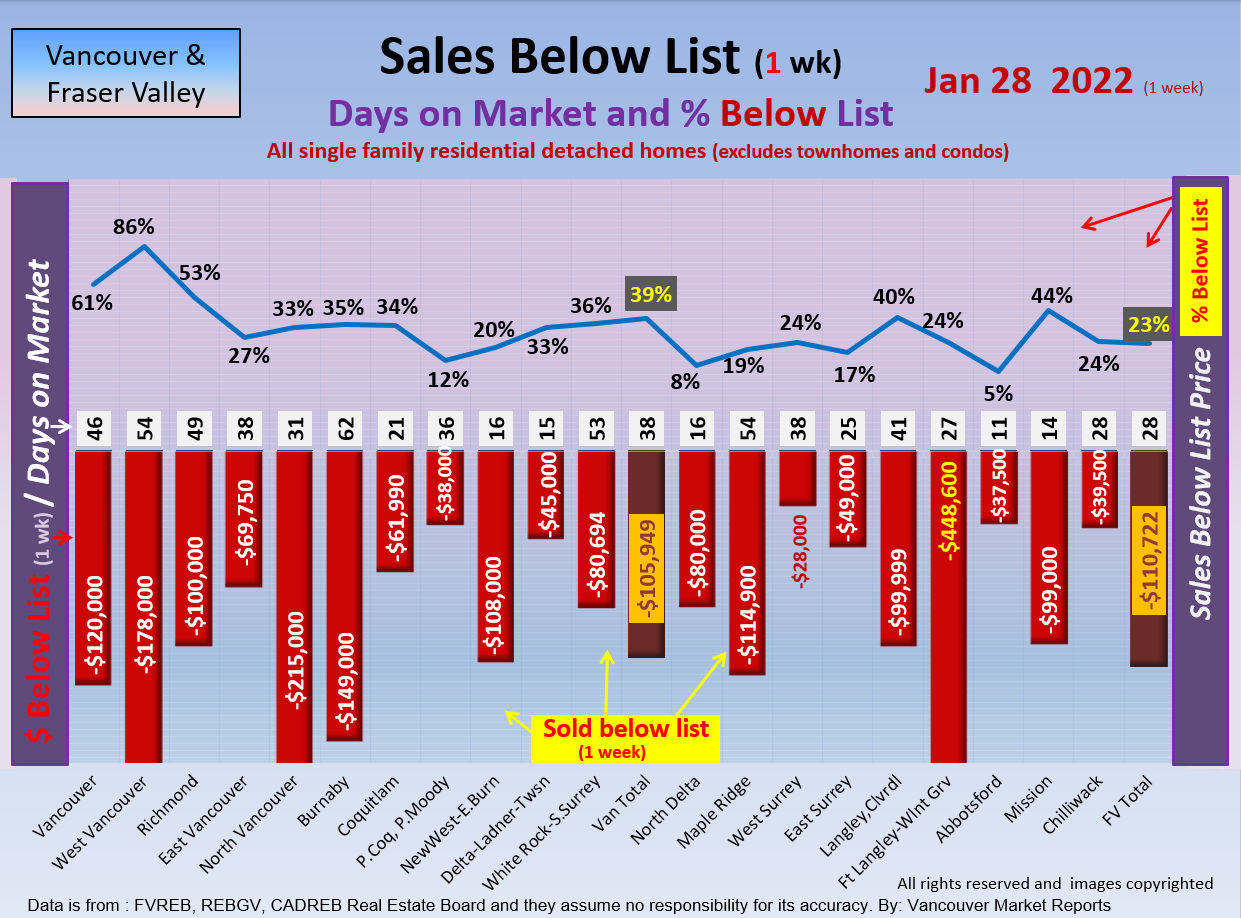
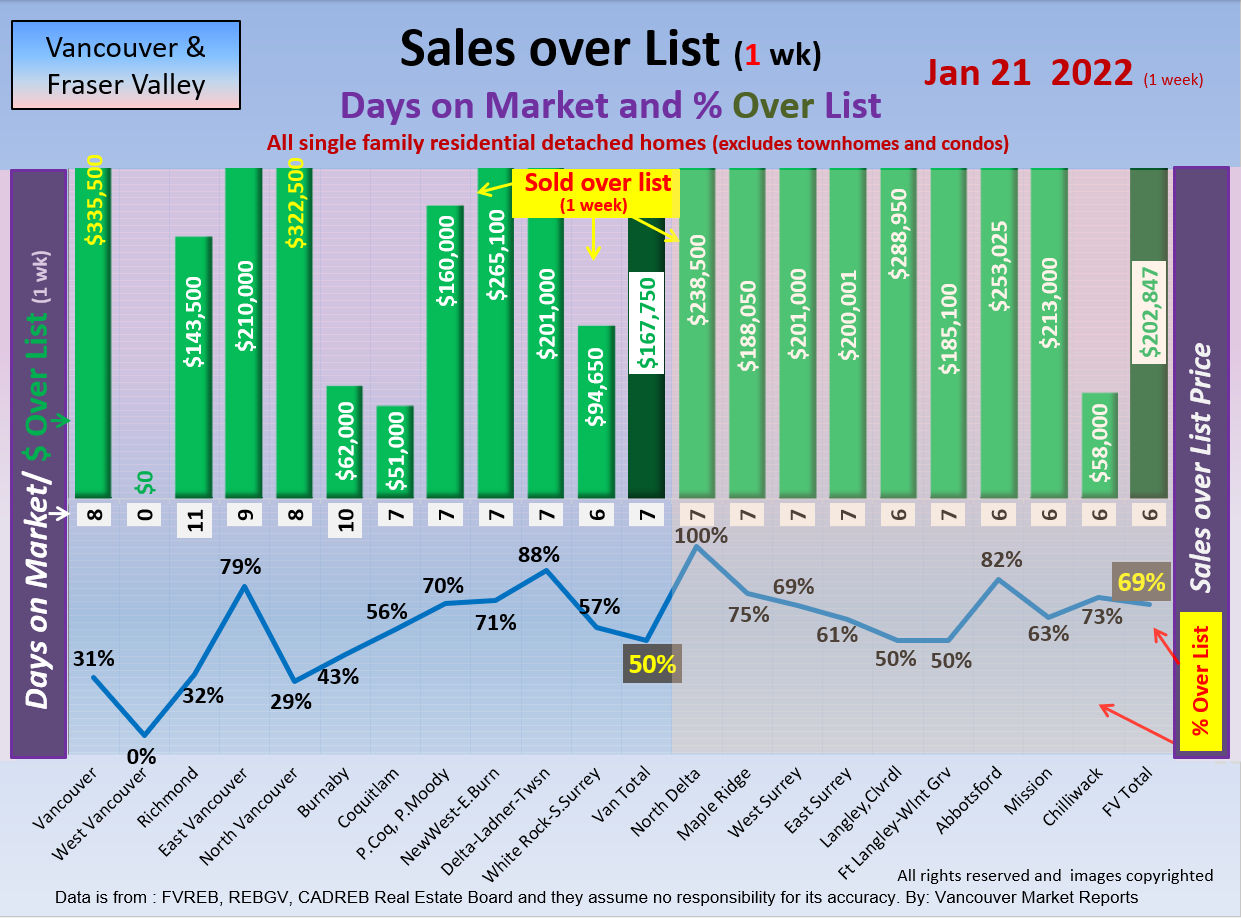
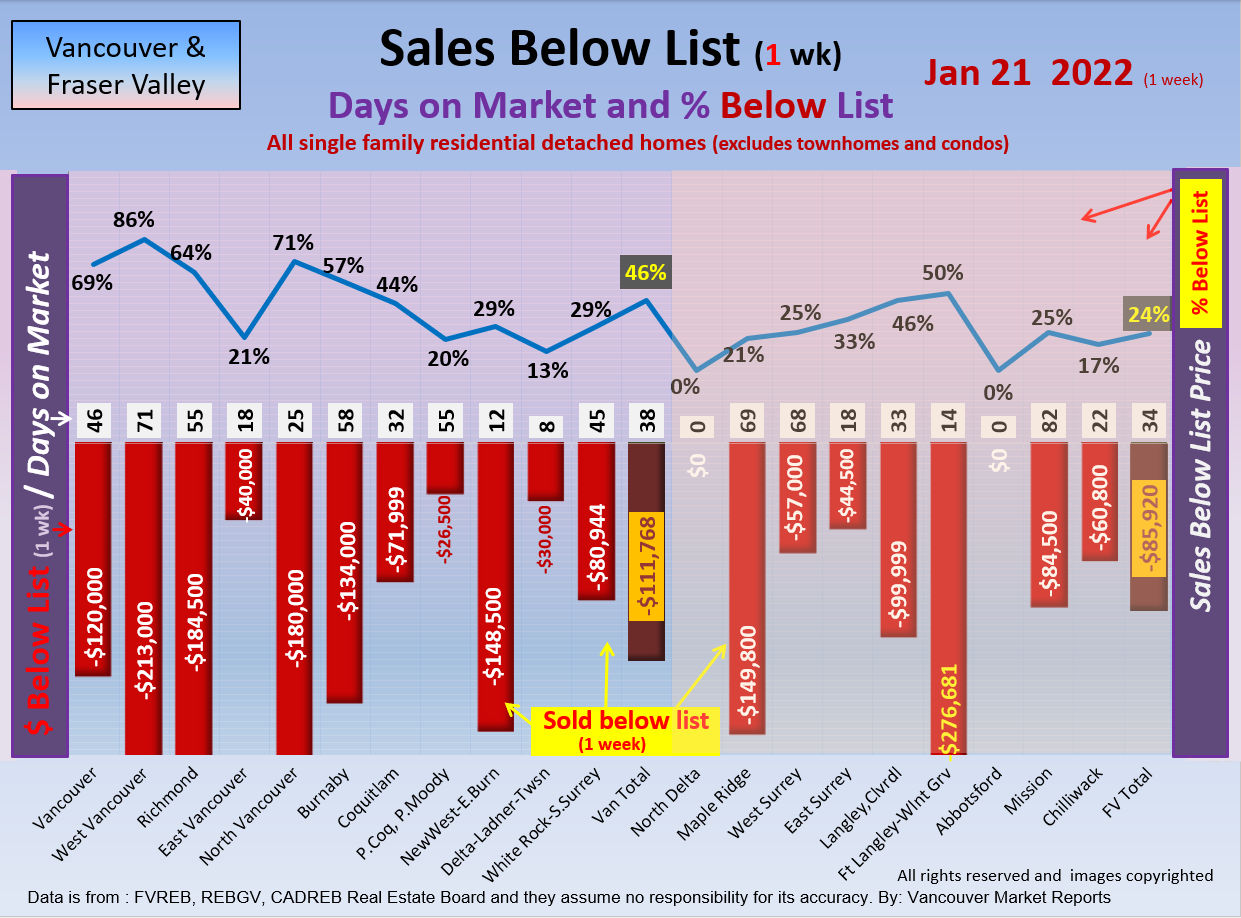
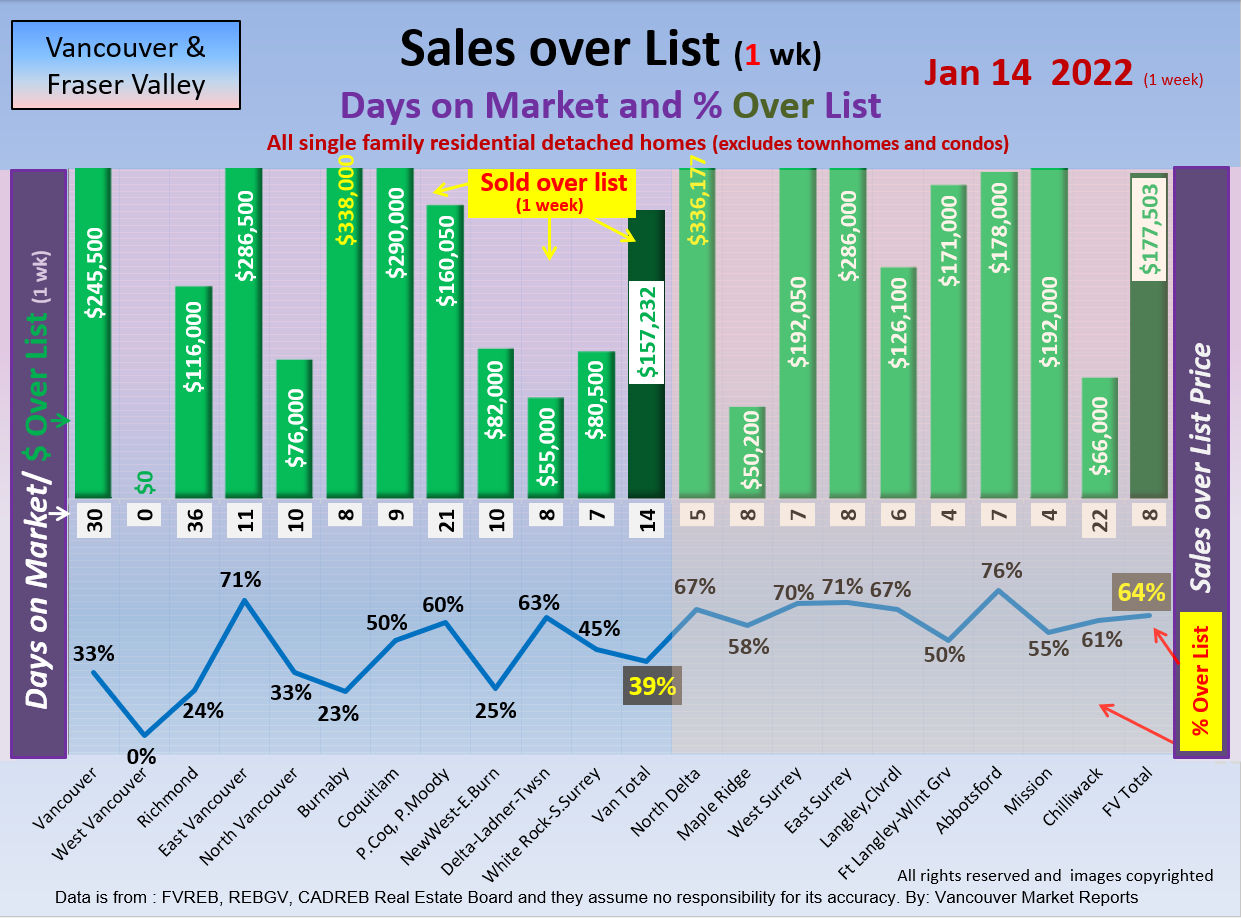
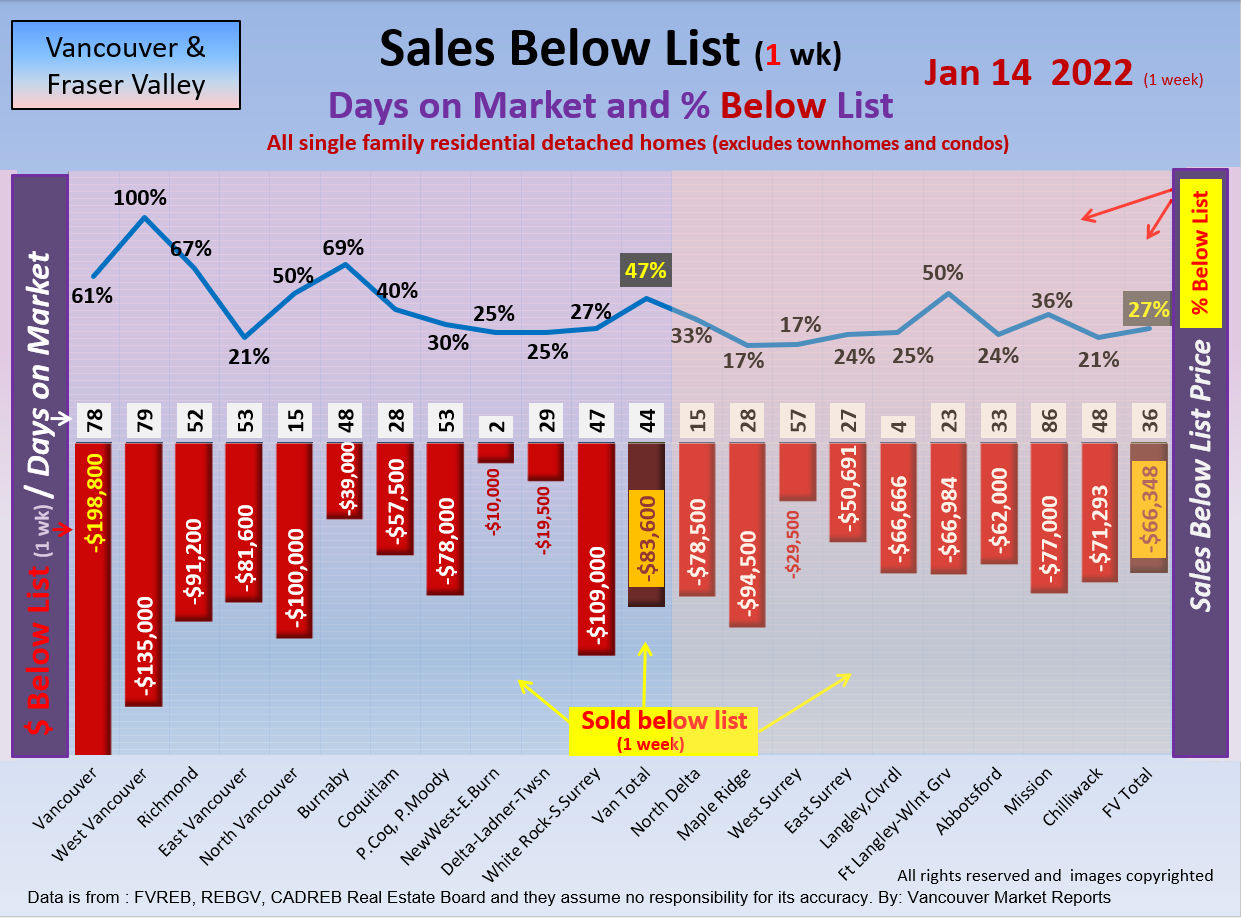
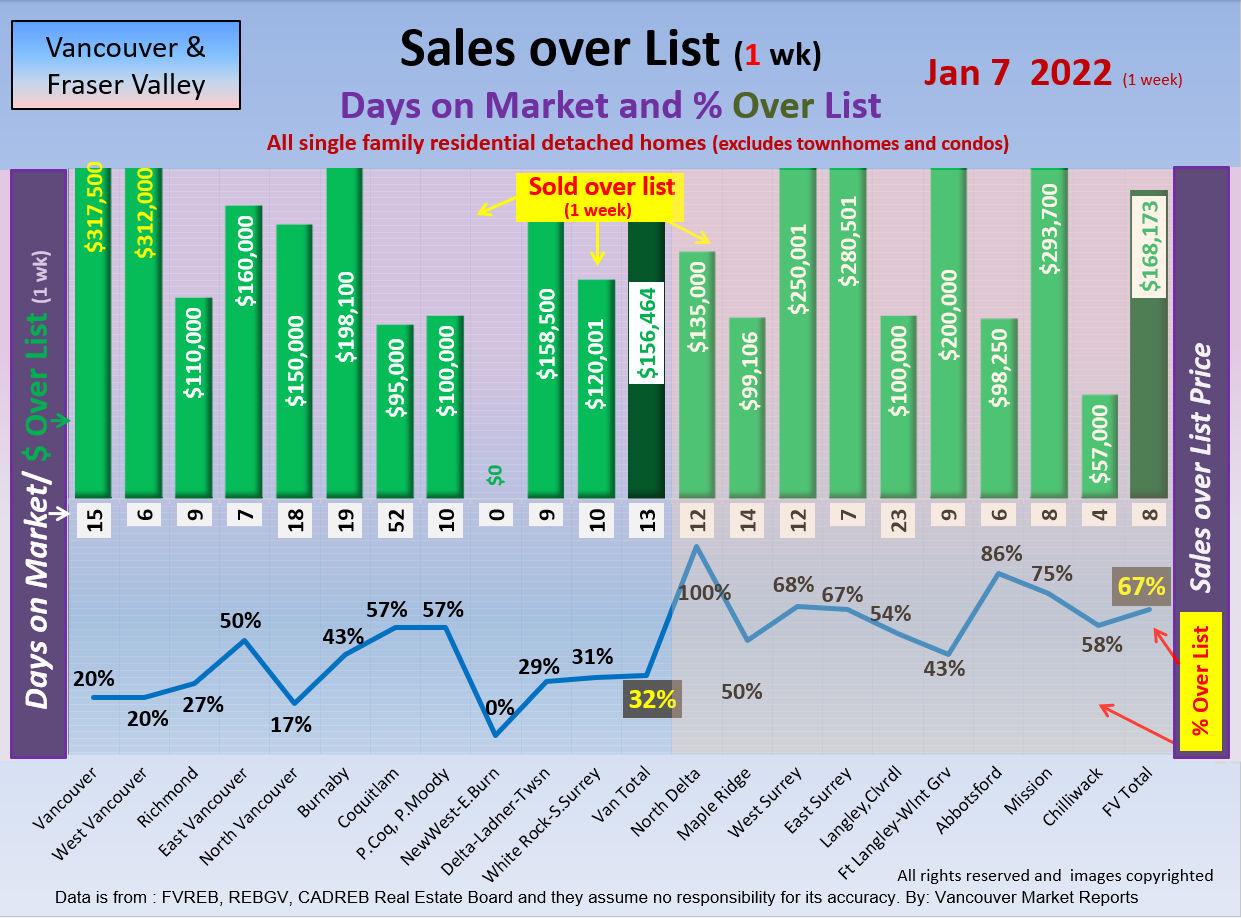
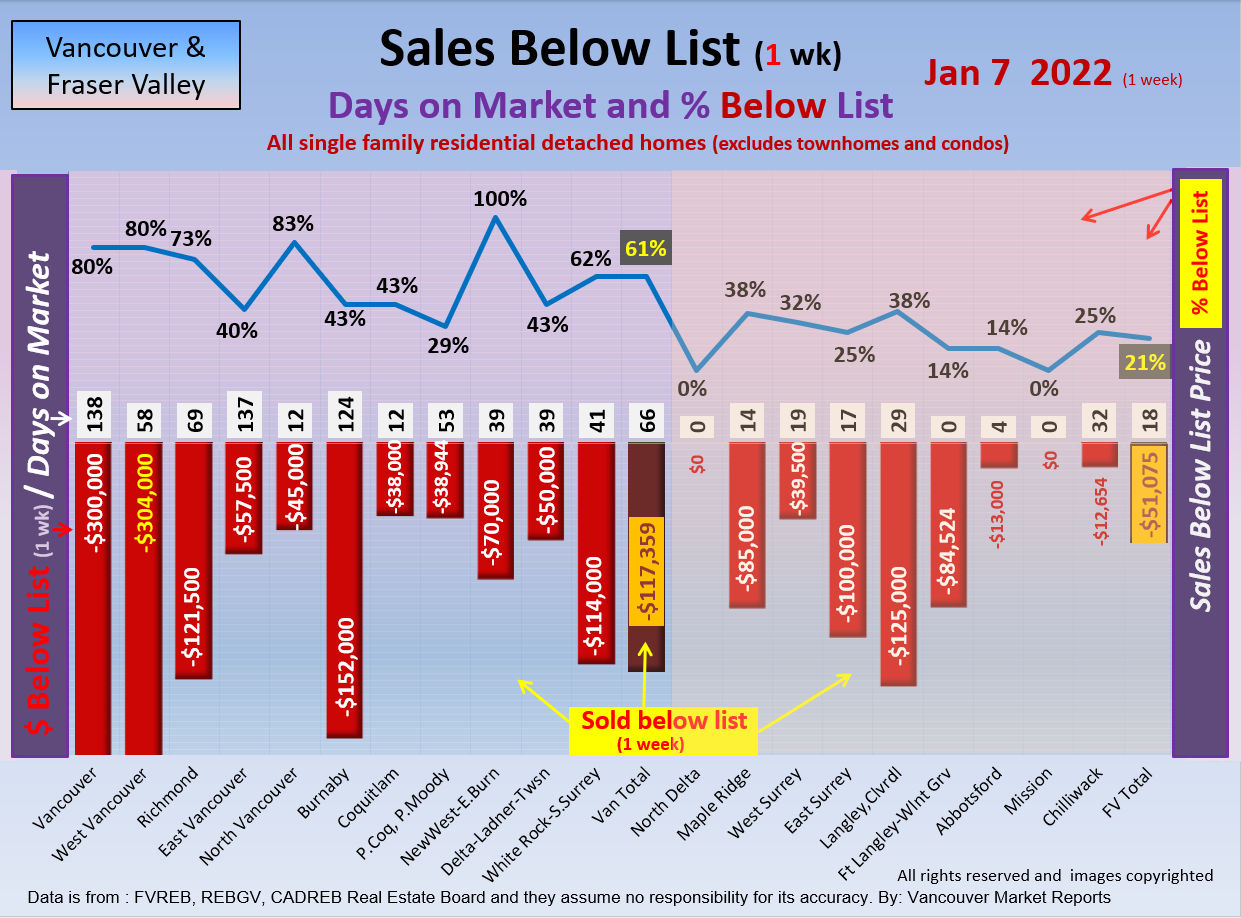
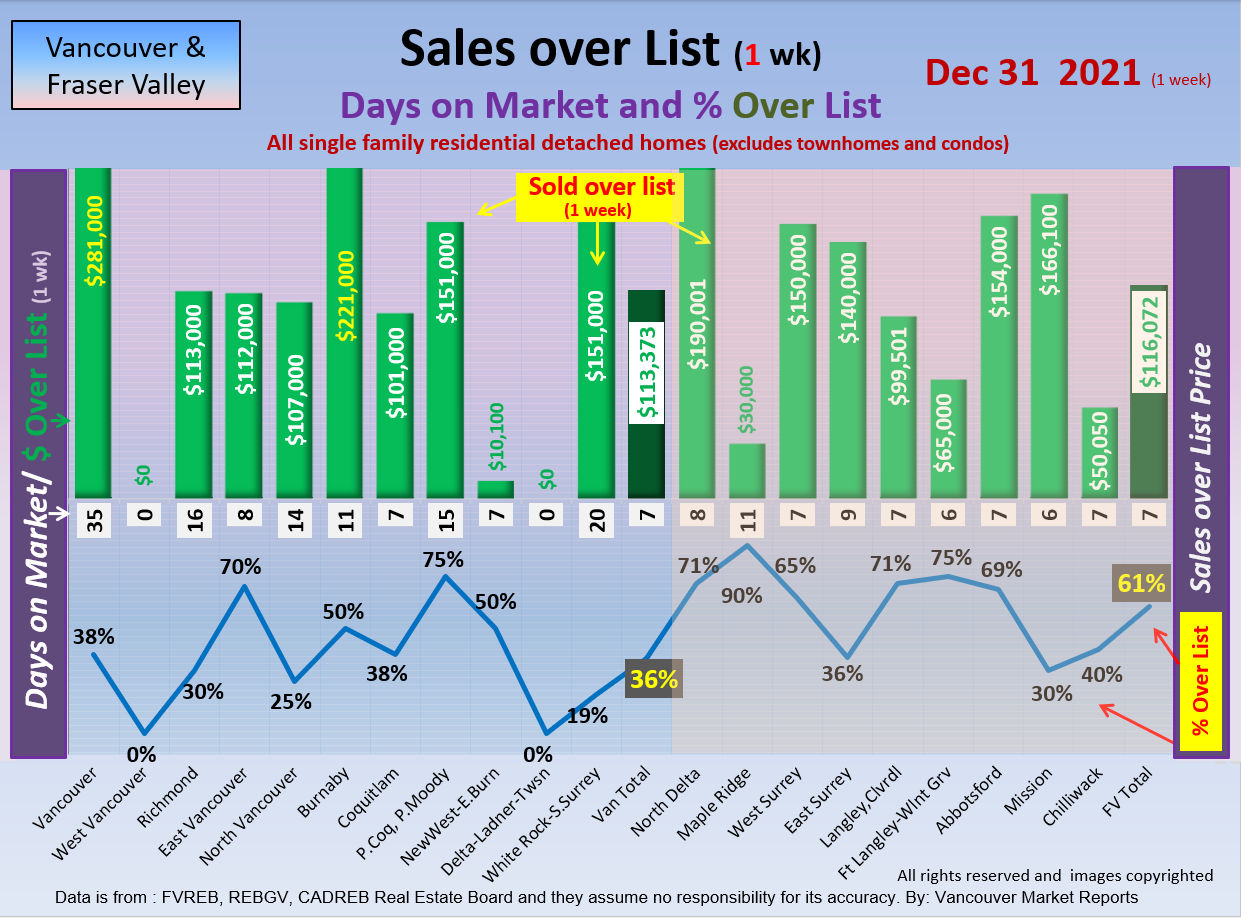
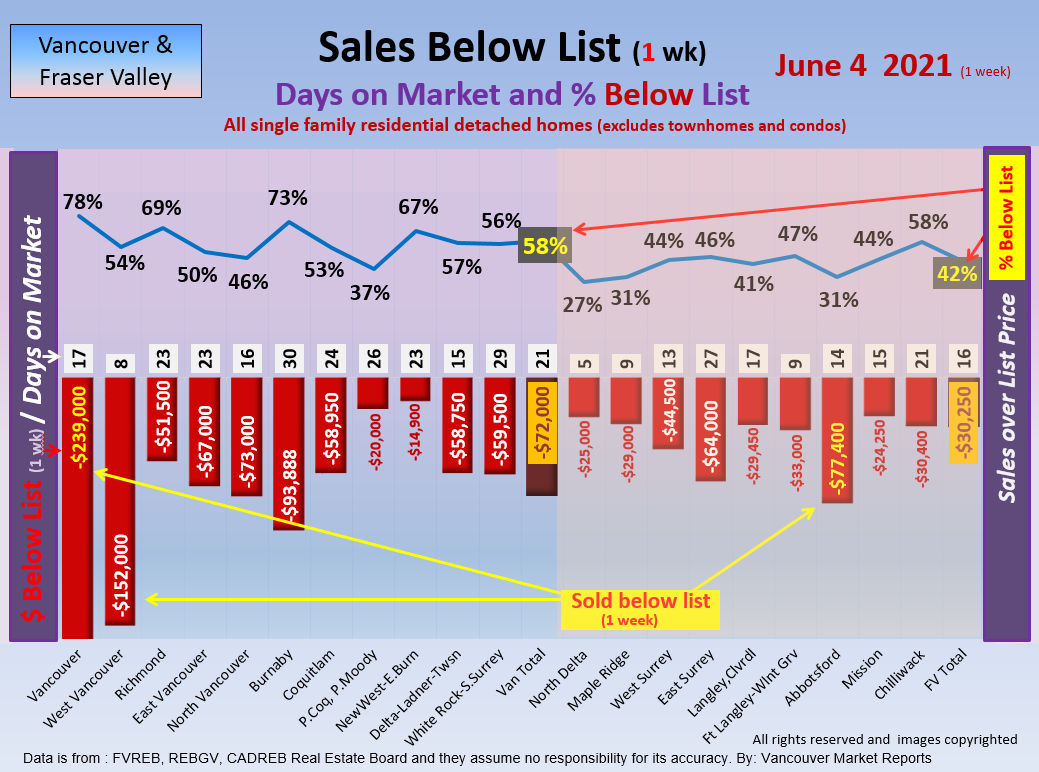
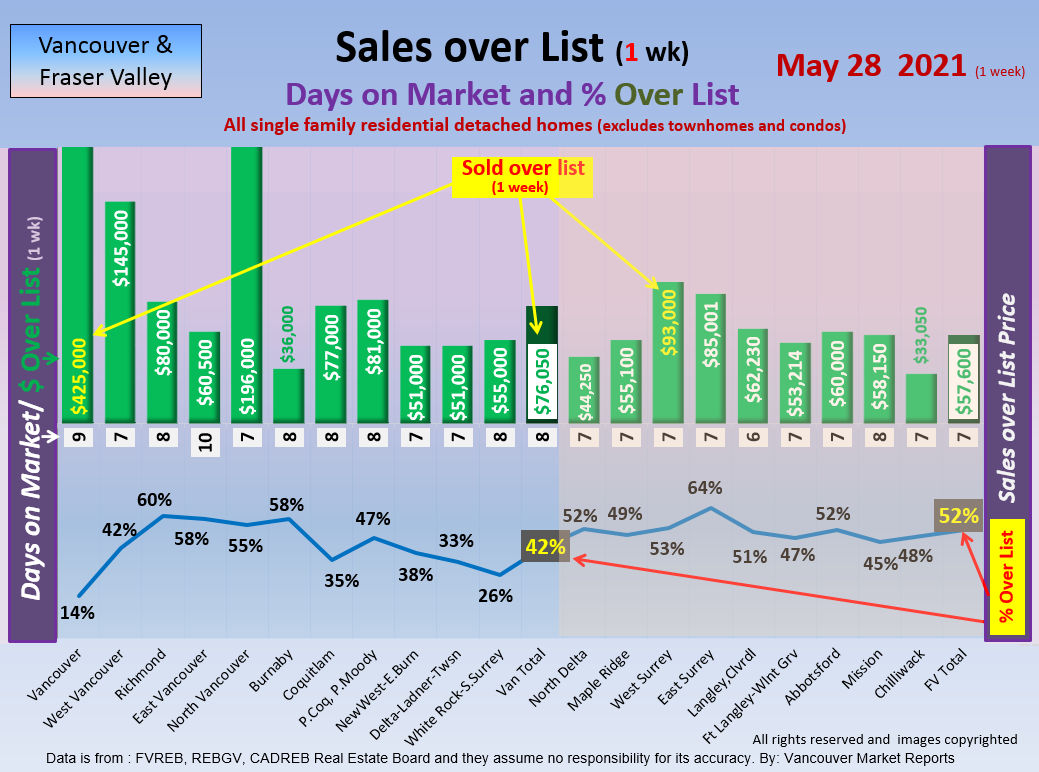
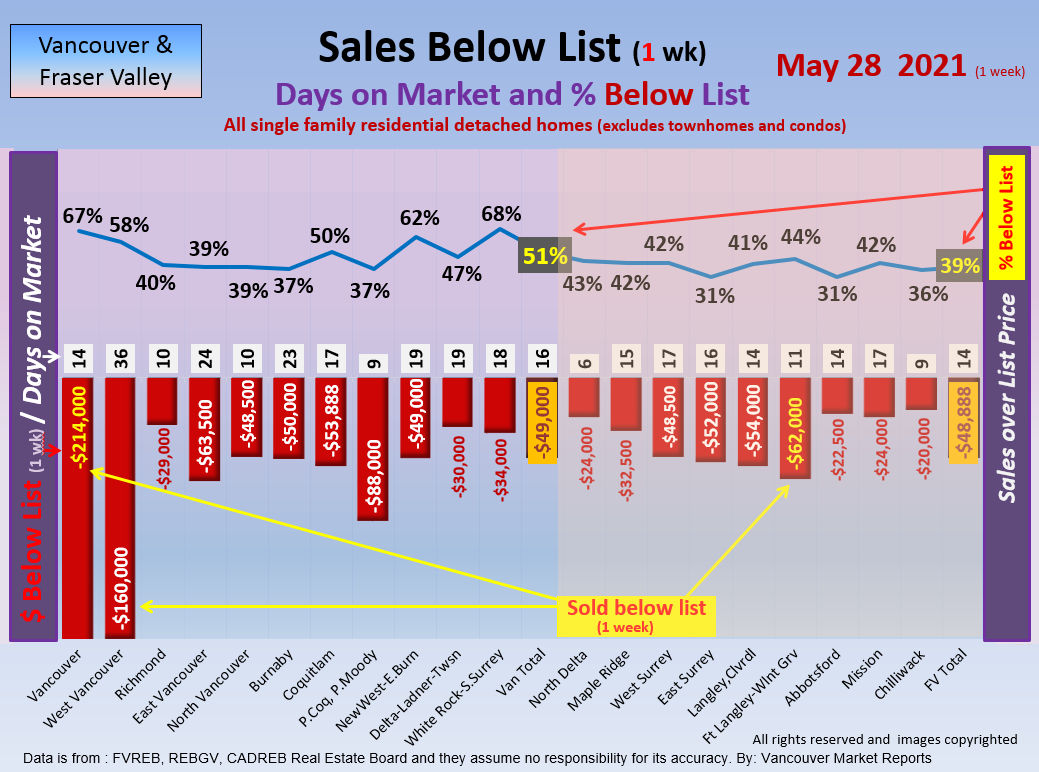
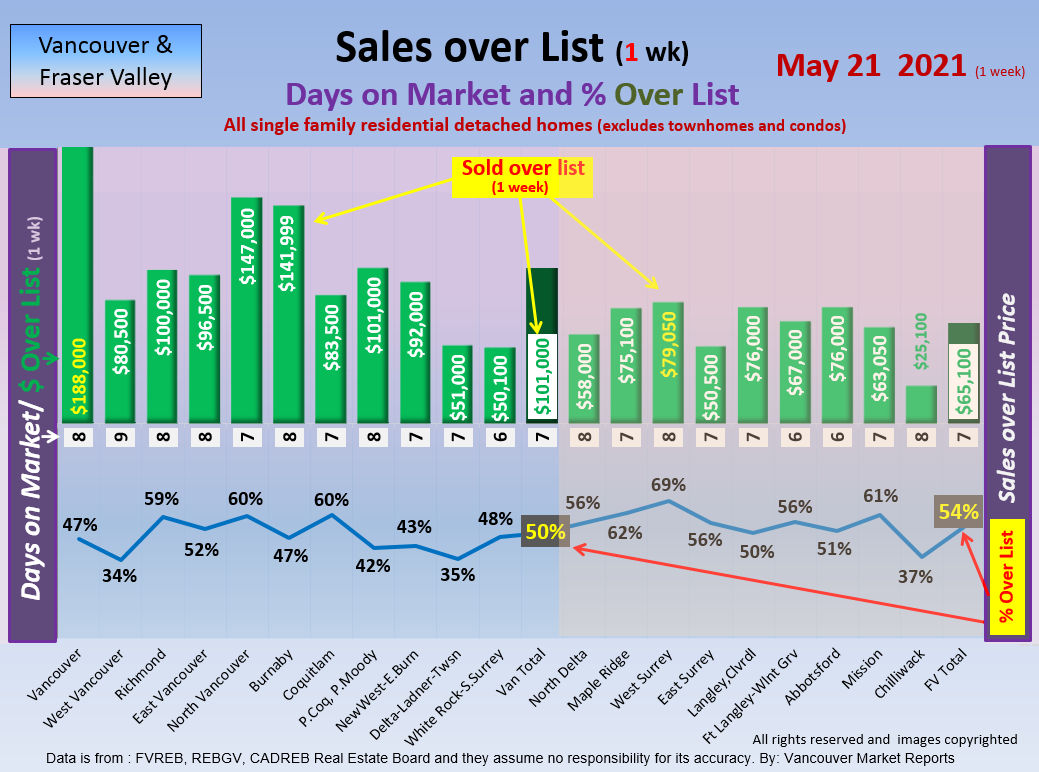
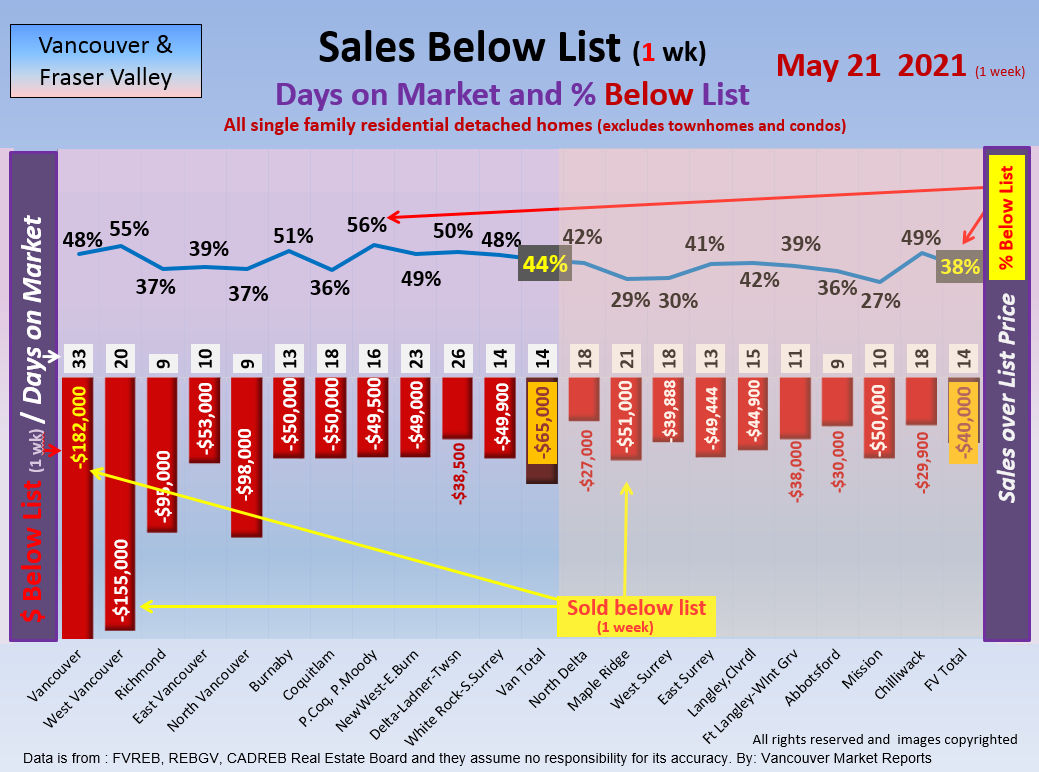
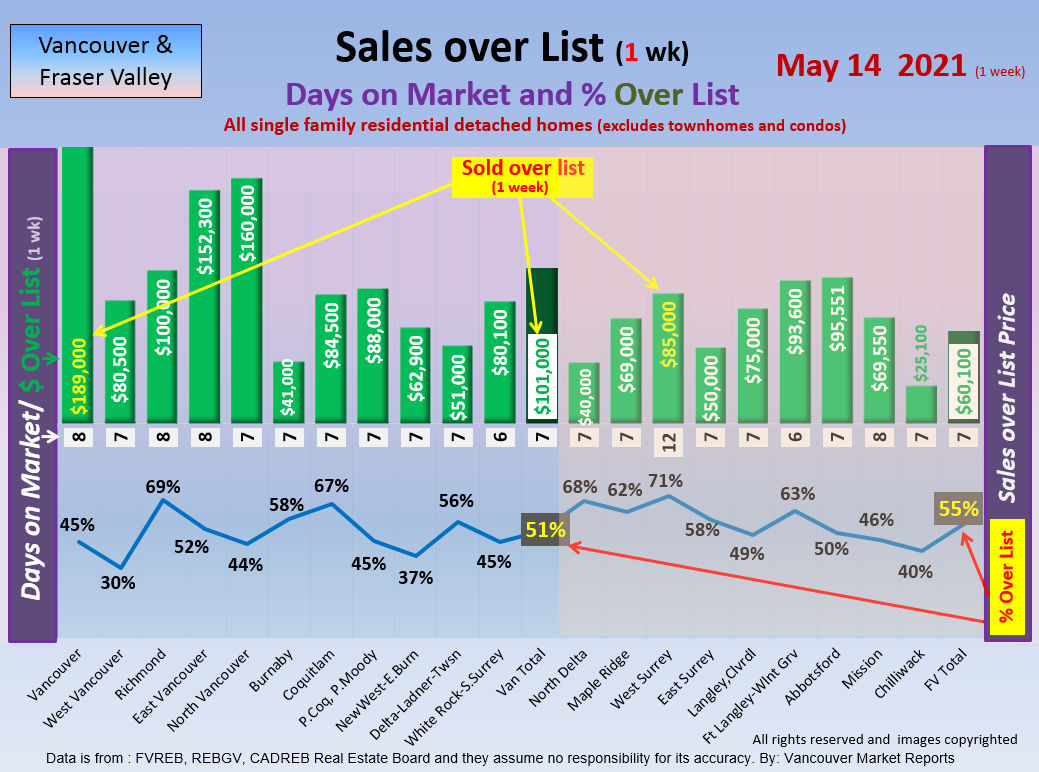
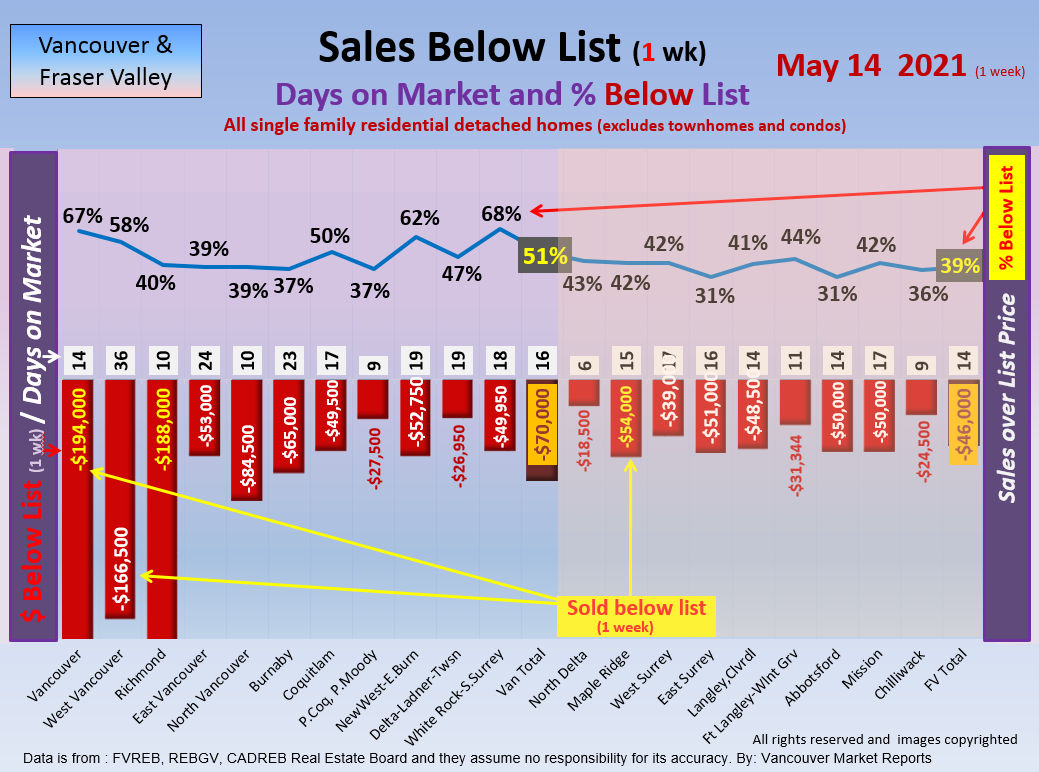
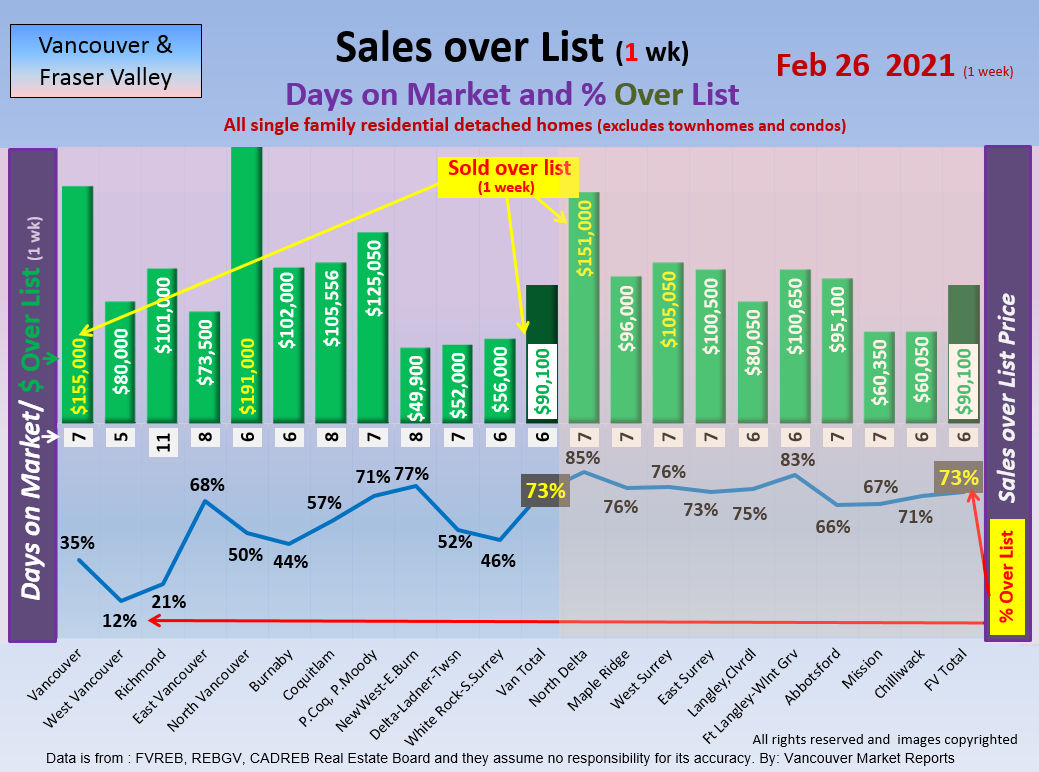
Now do compare the Weekly Discounts to last year below!

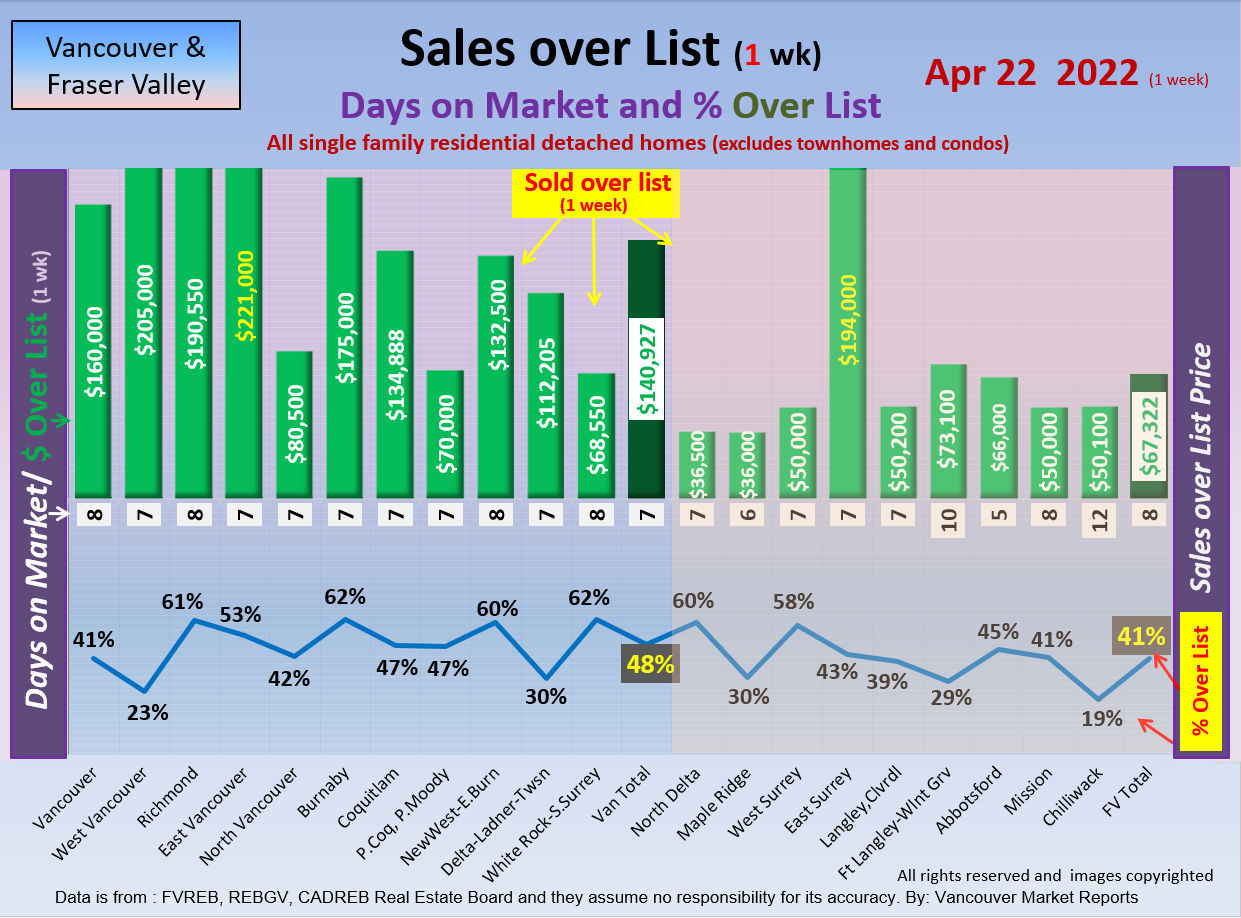
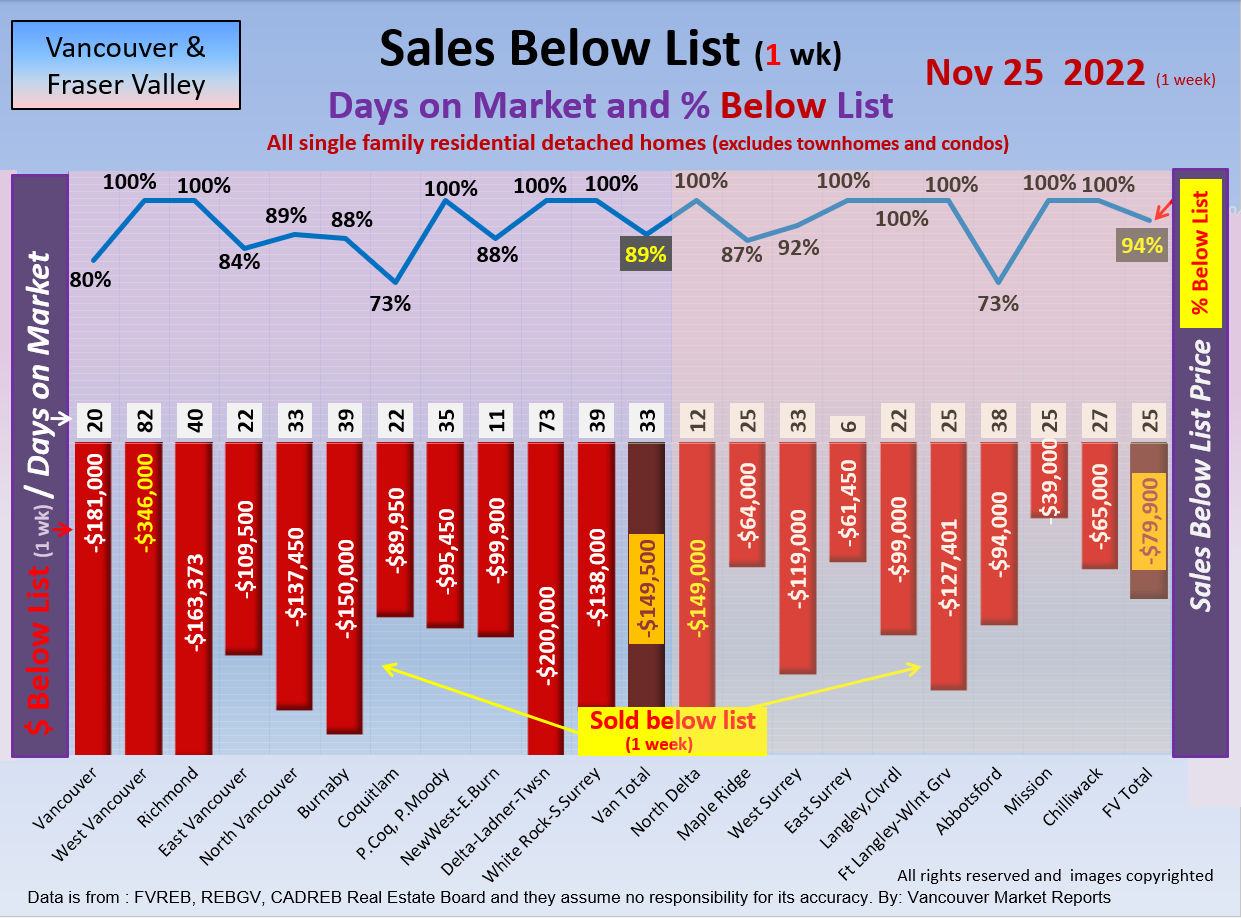
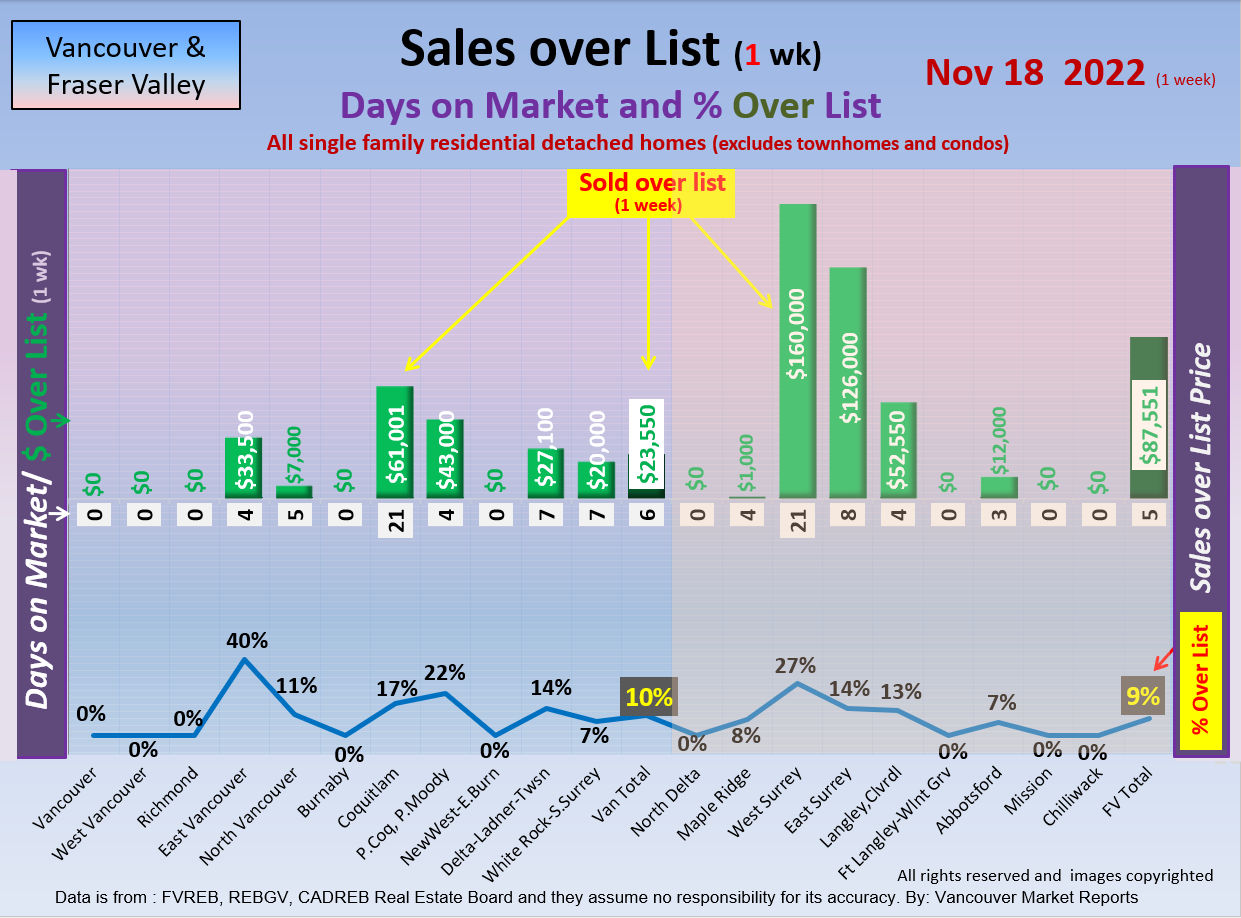
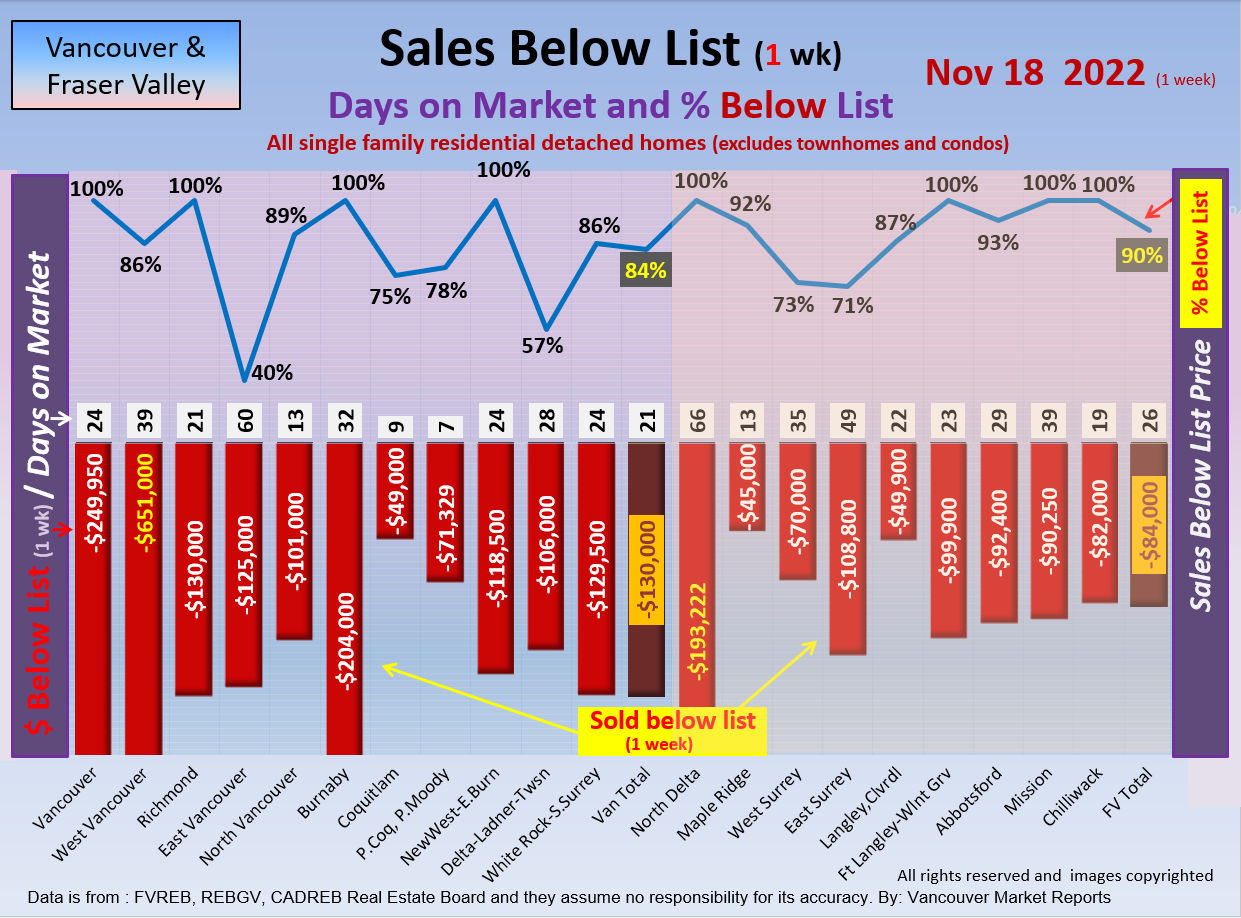
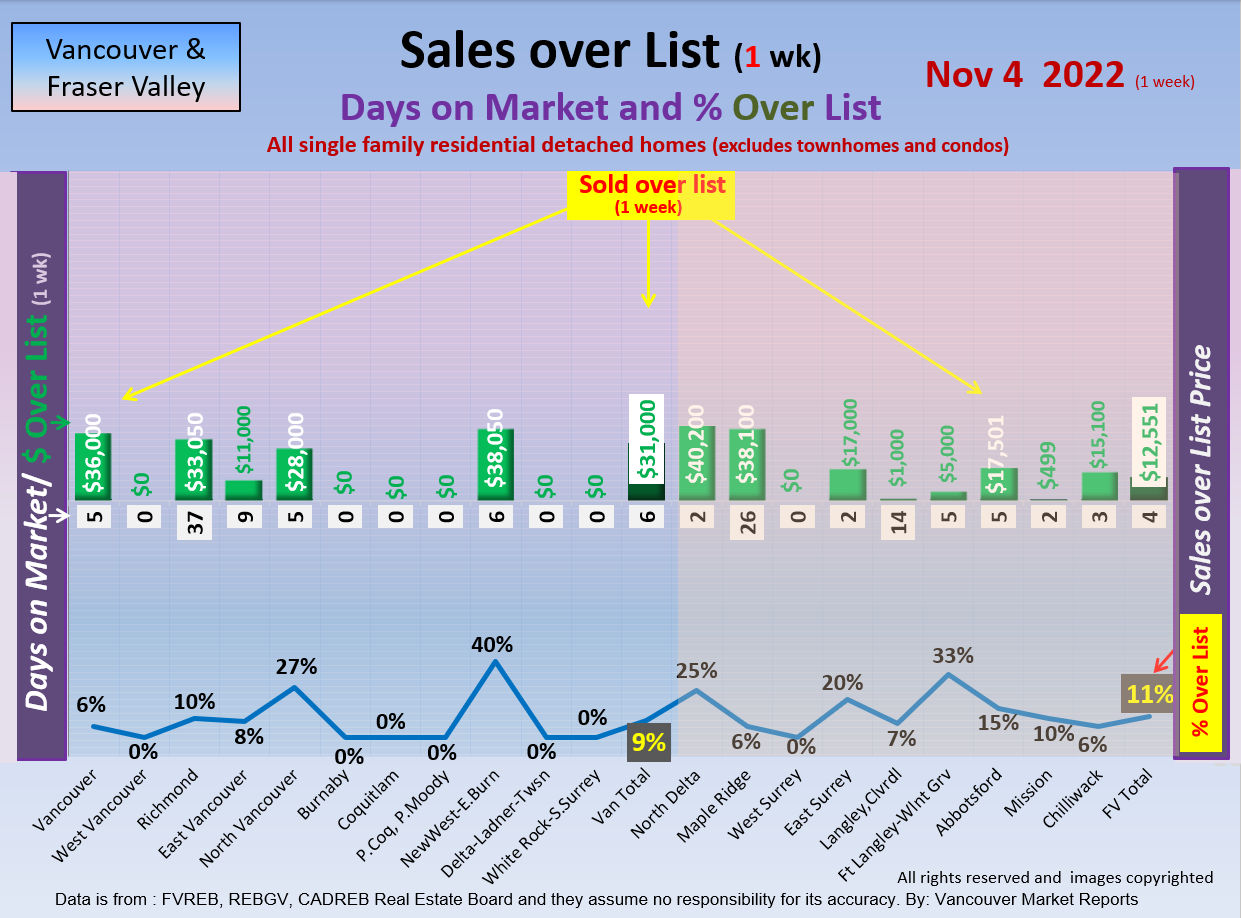
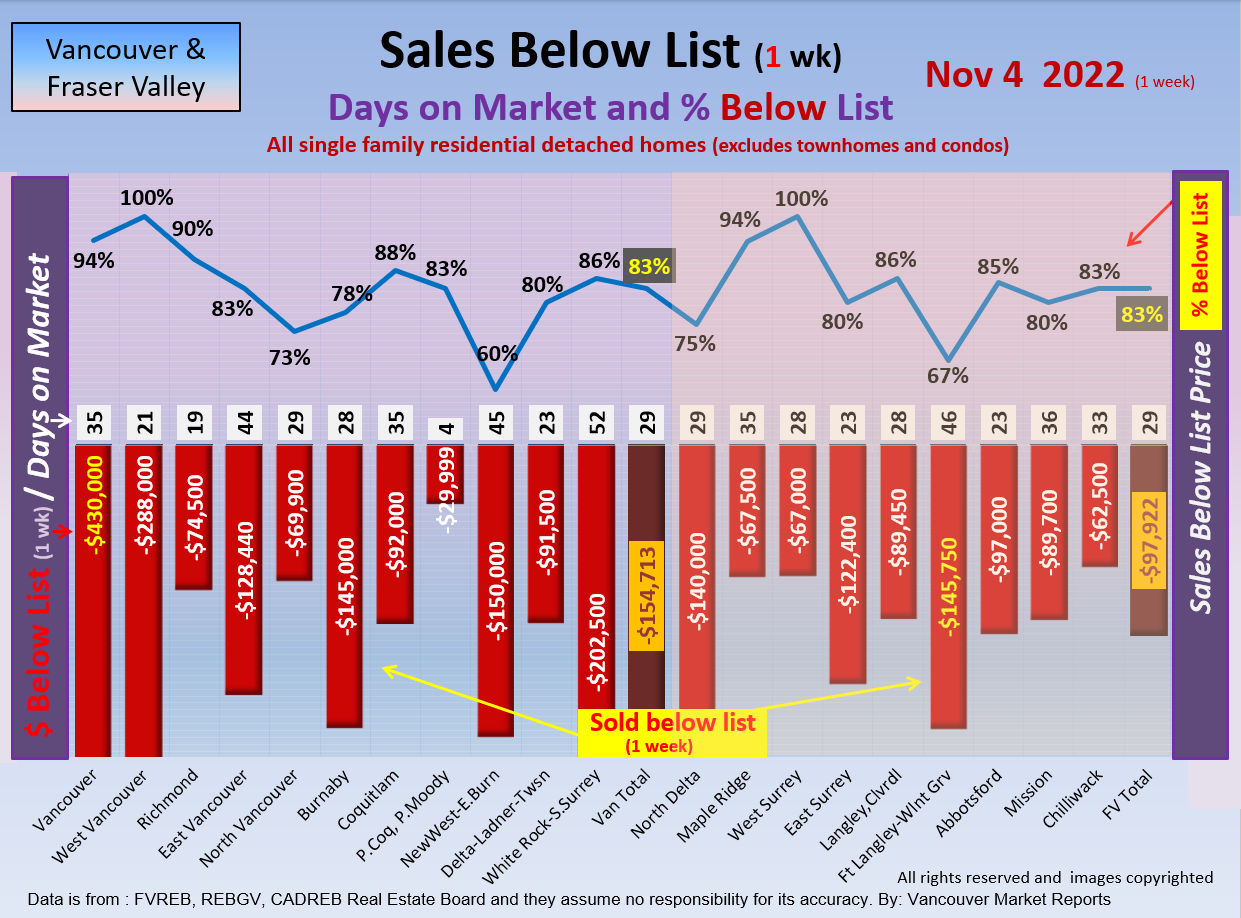
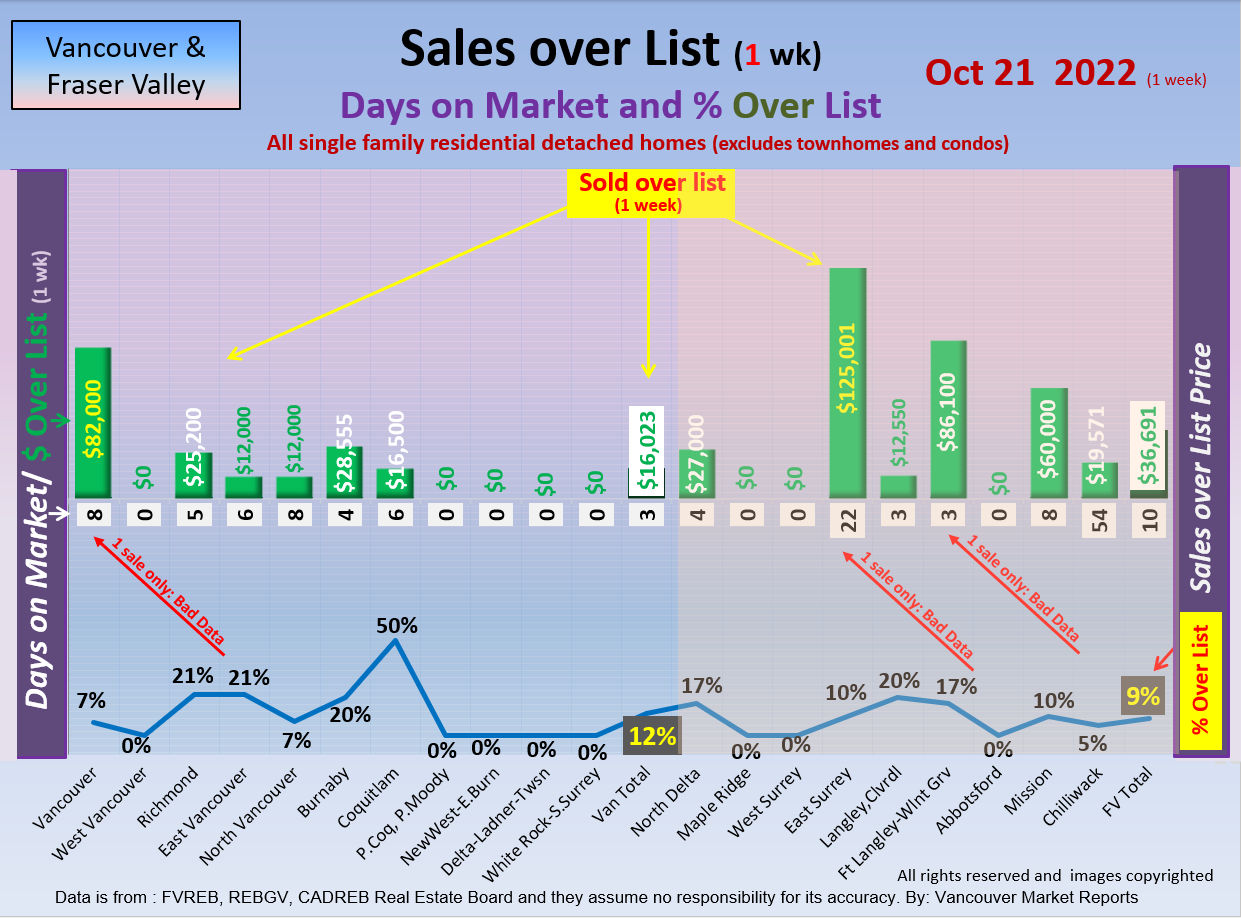
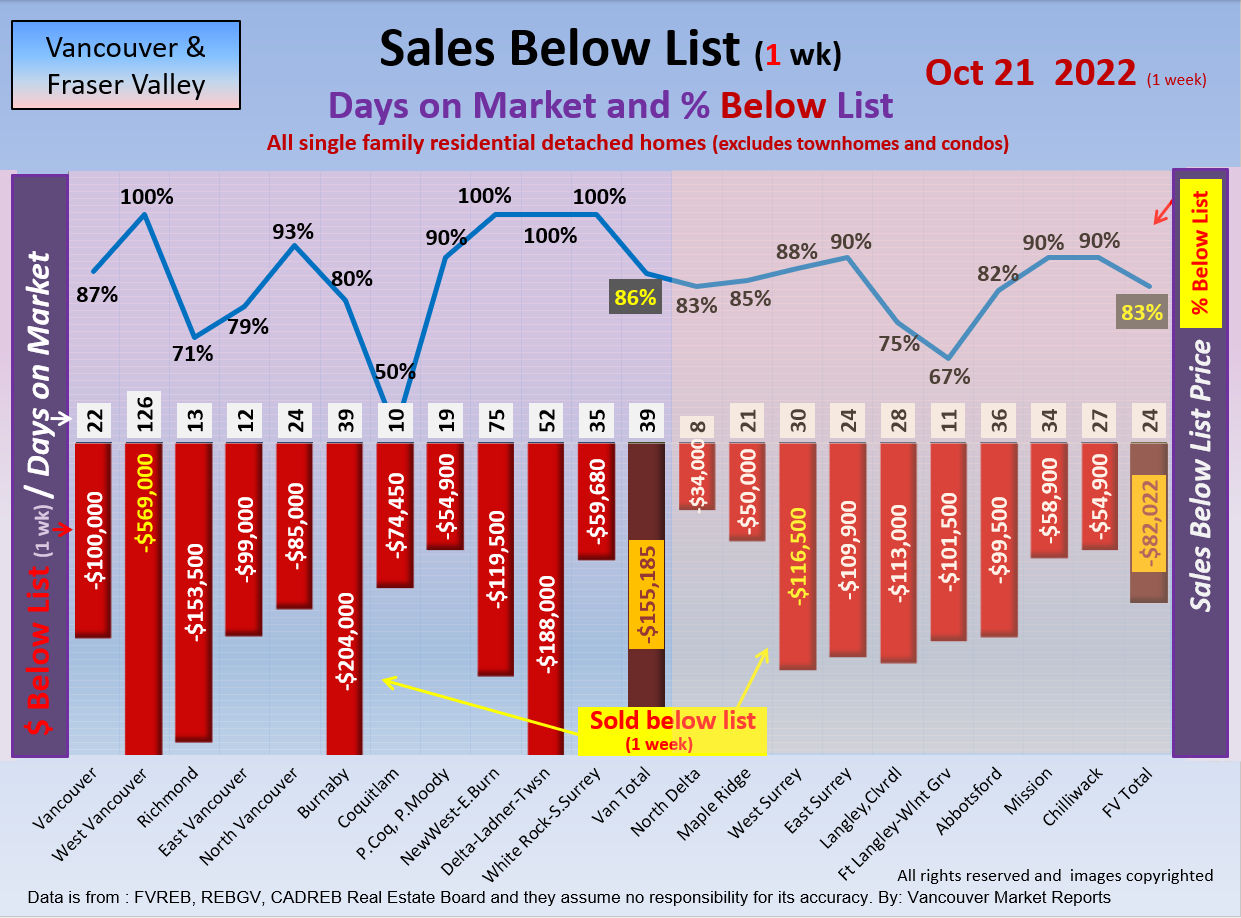
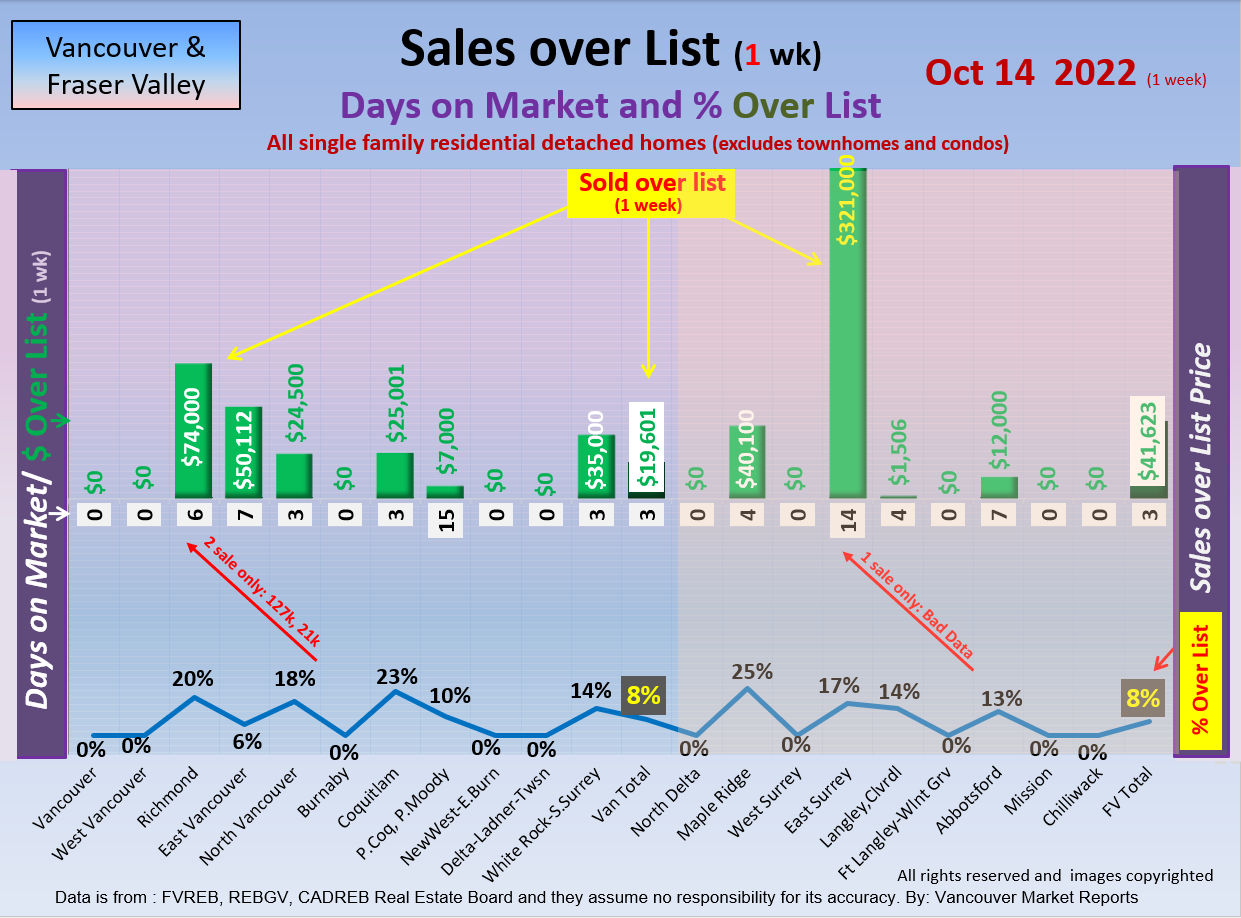
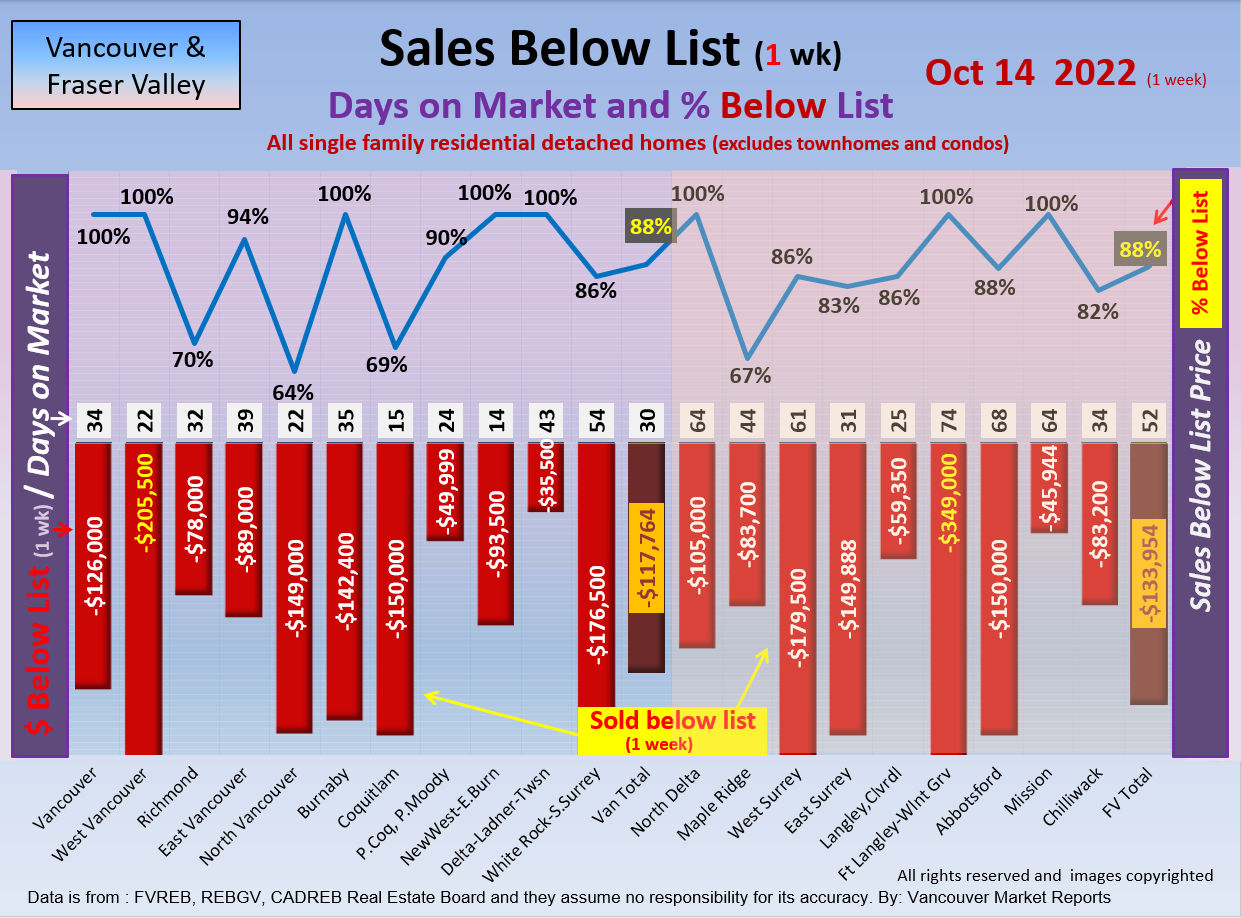
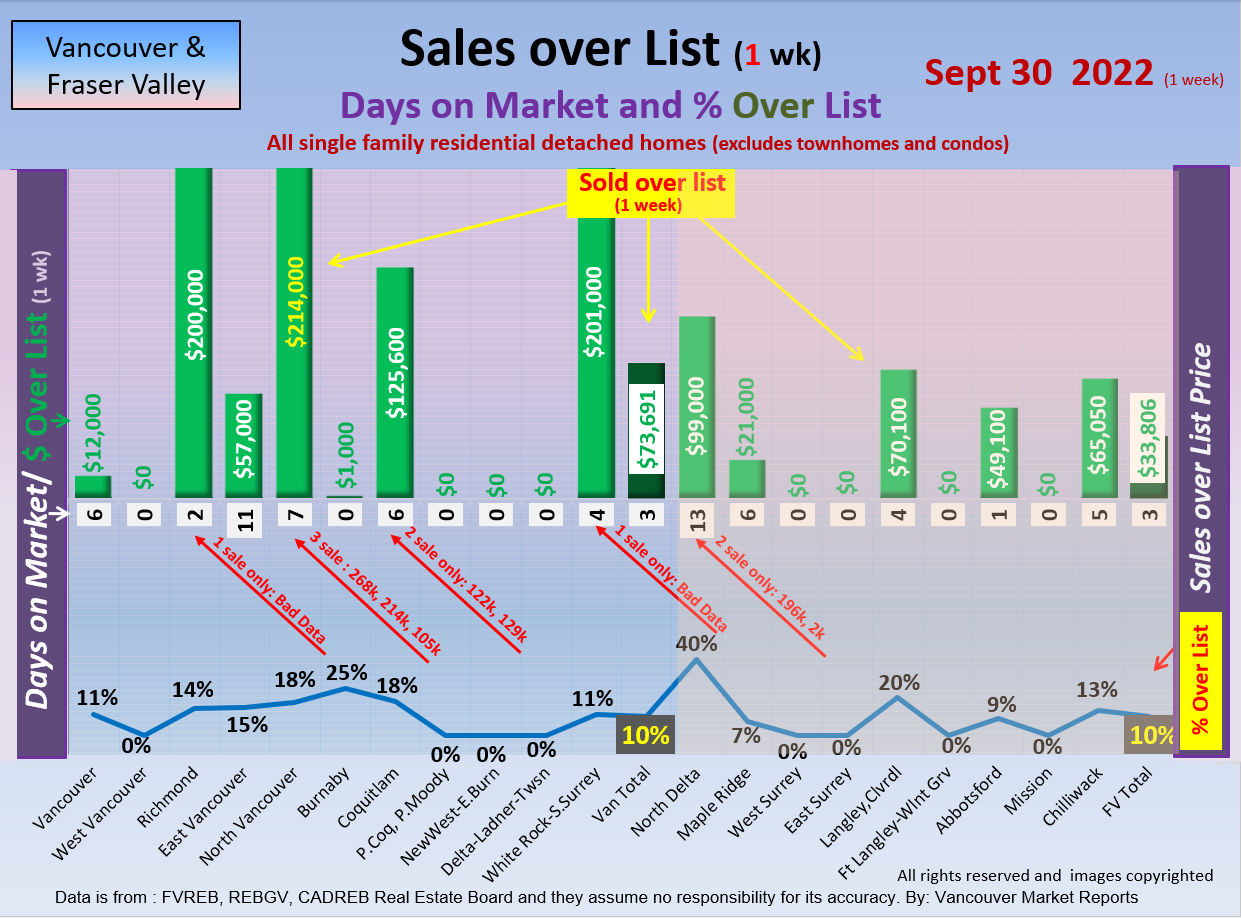
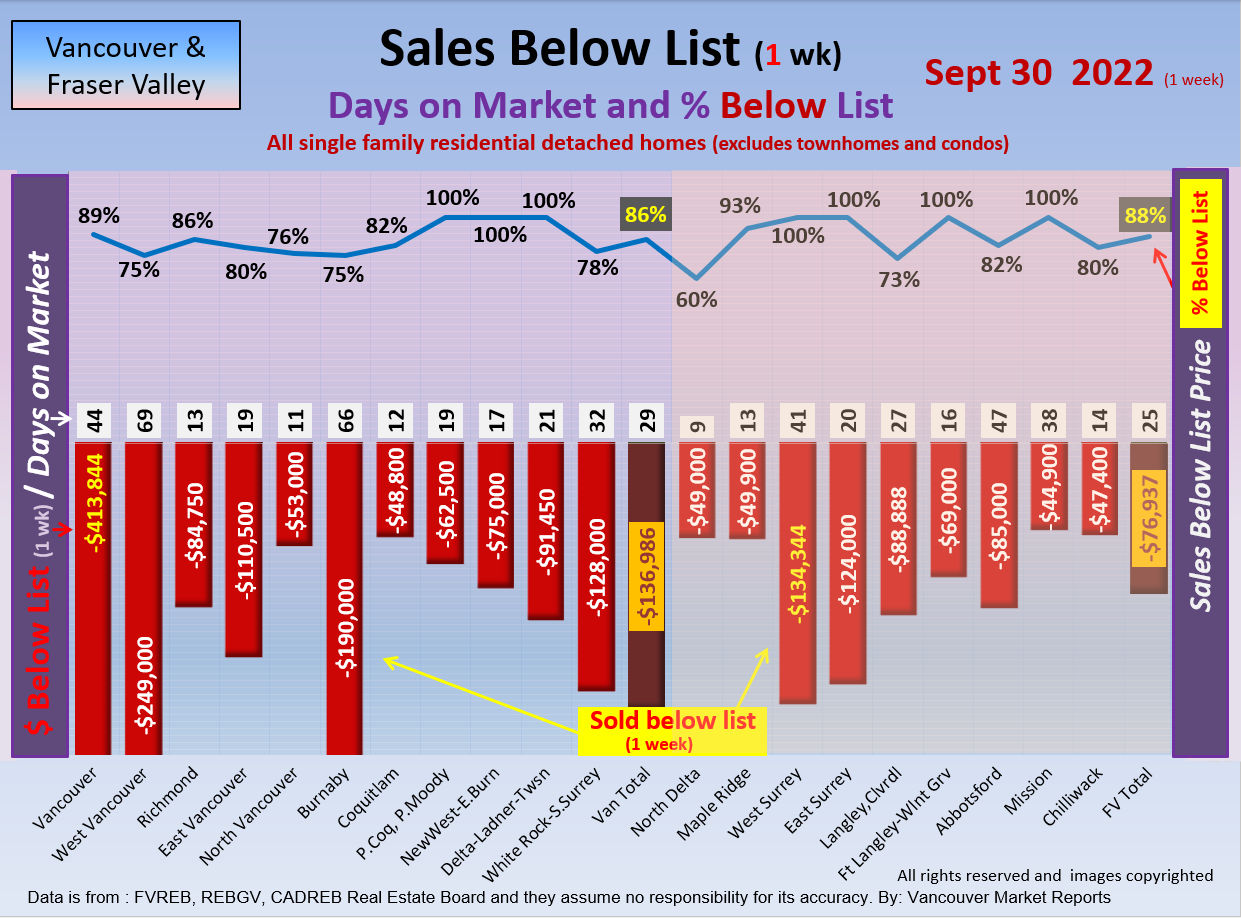
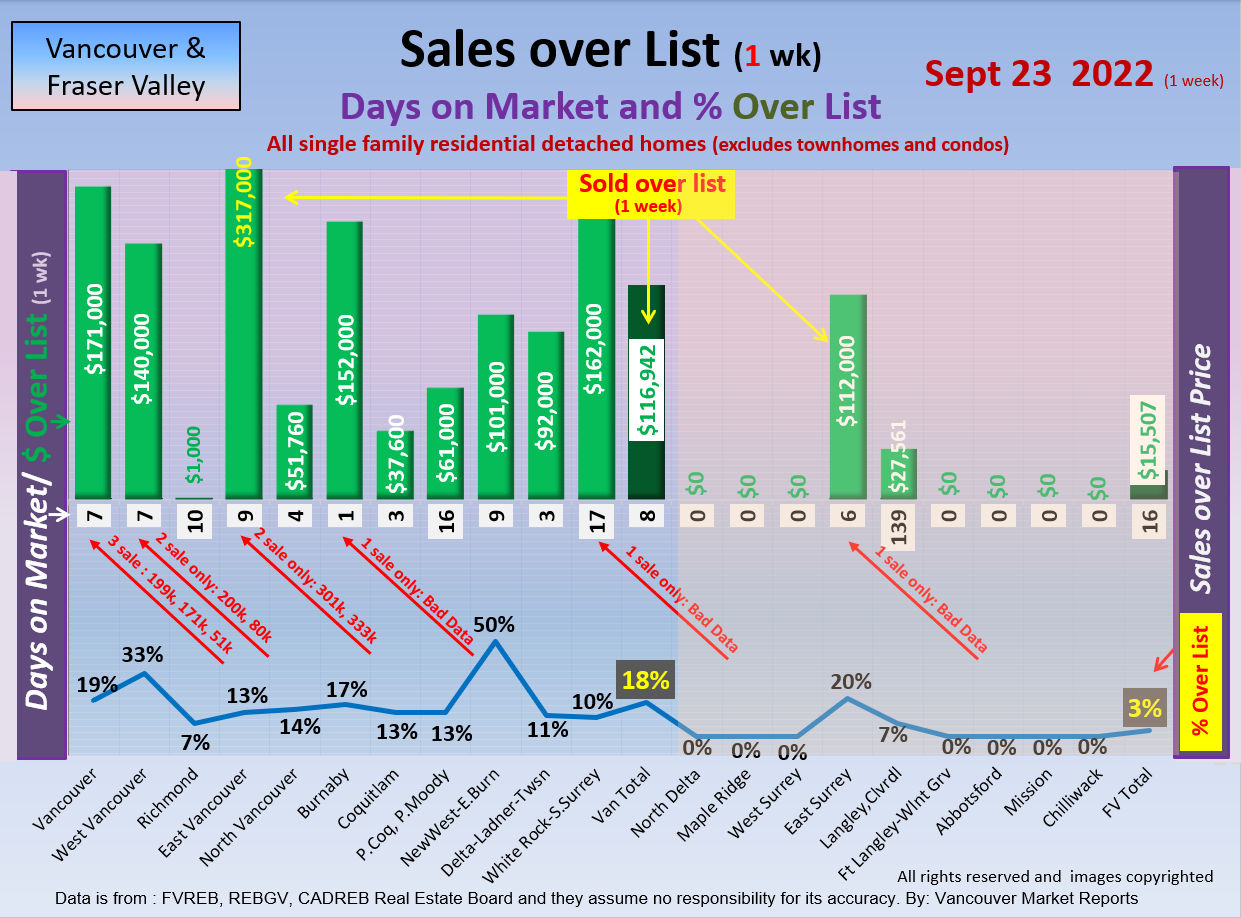
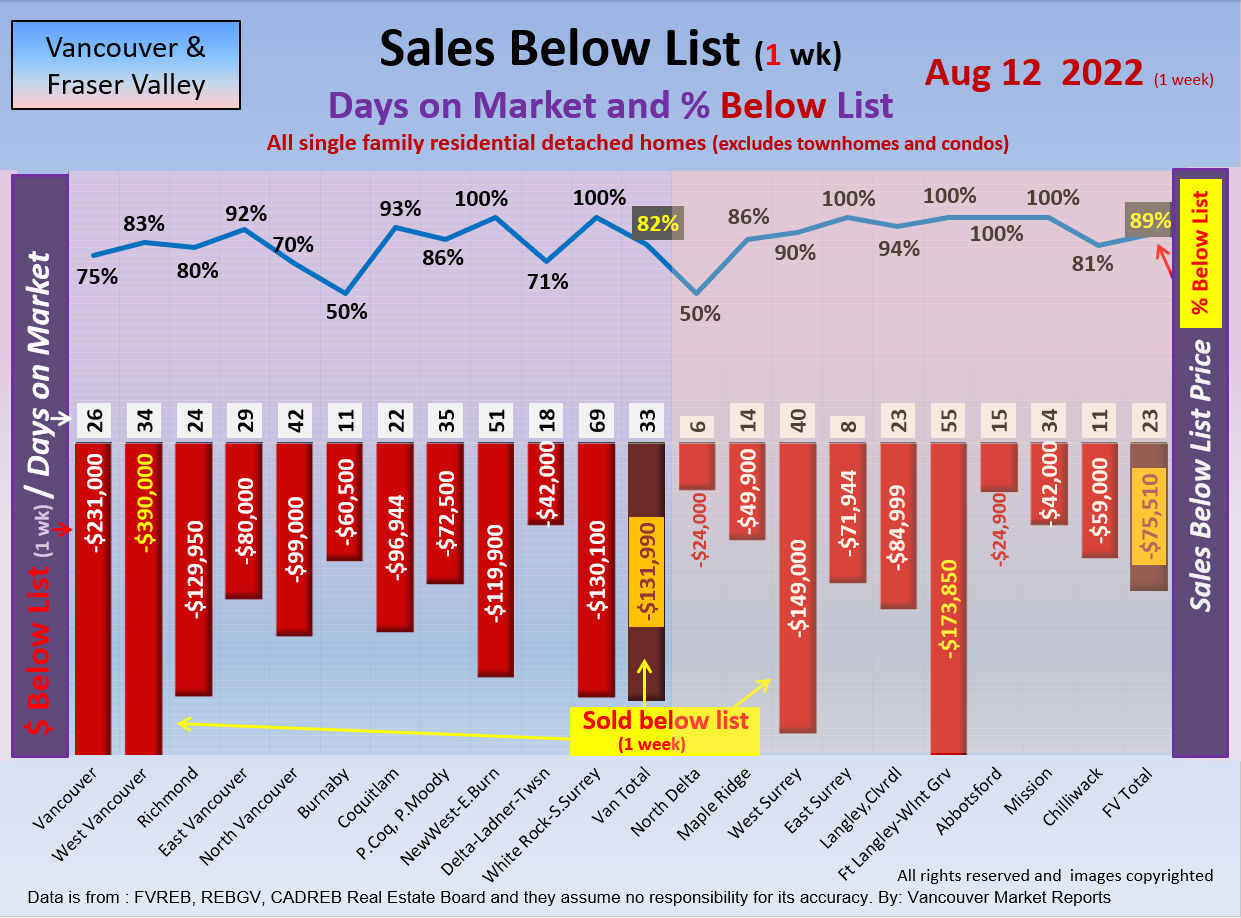
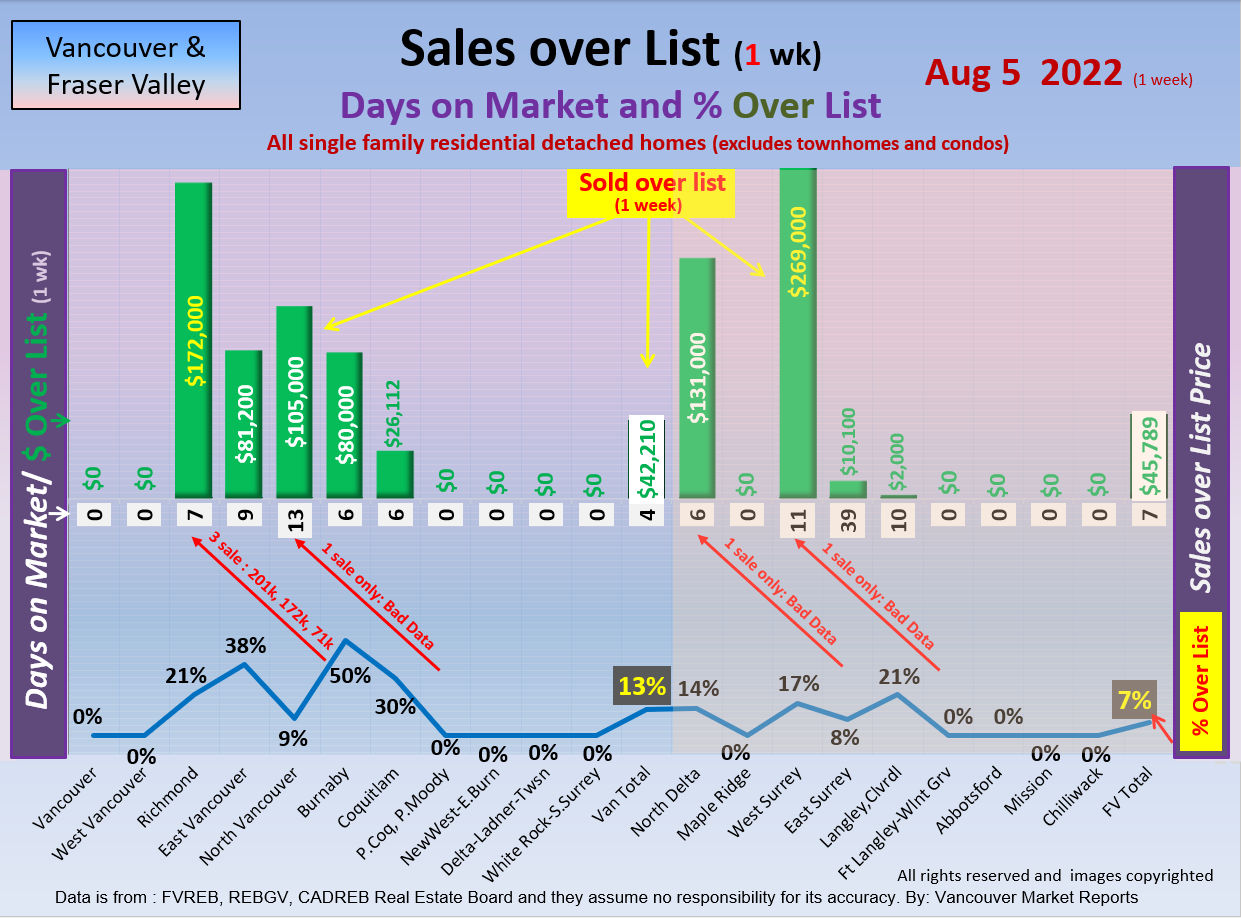
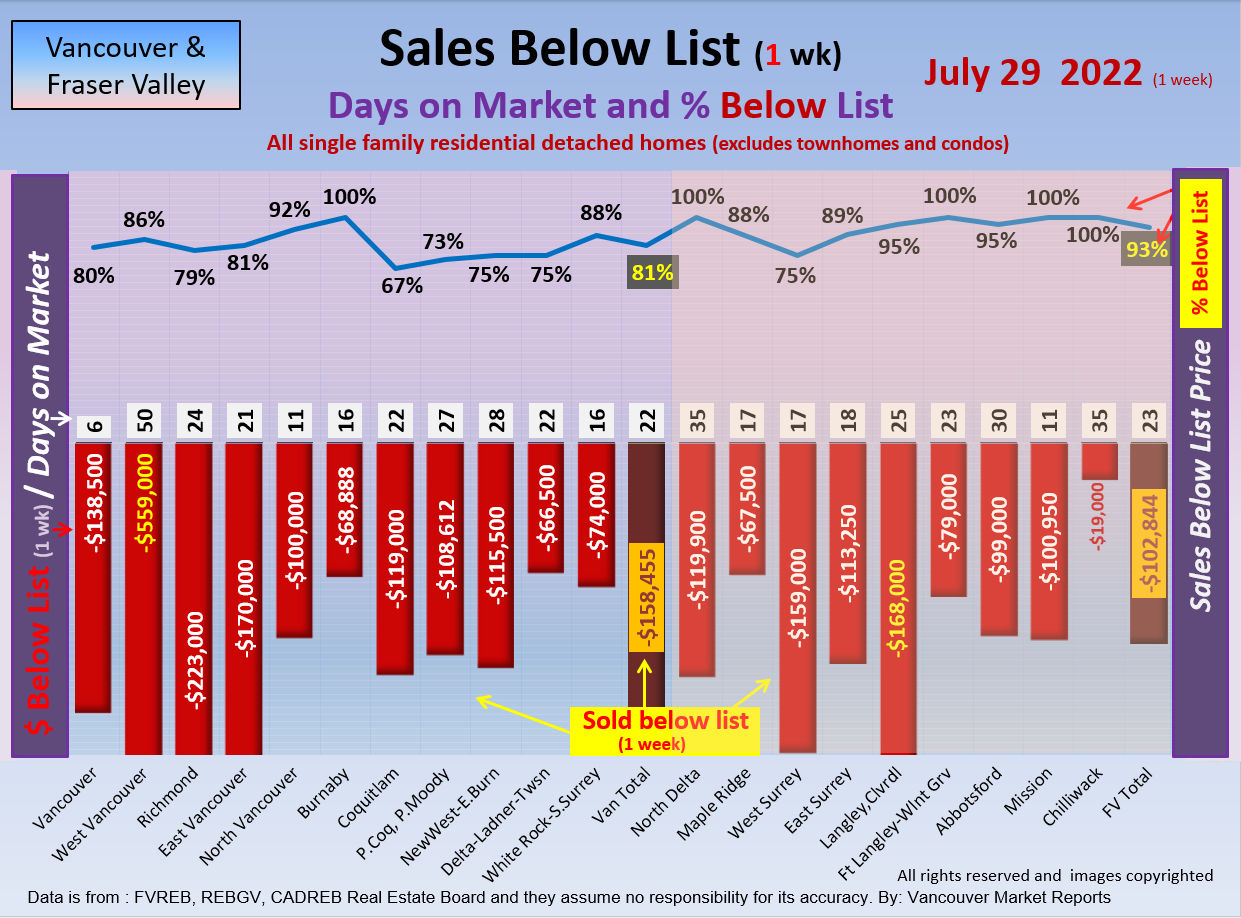
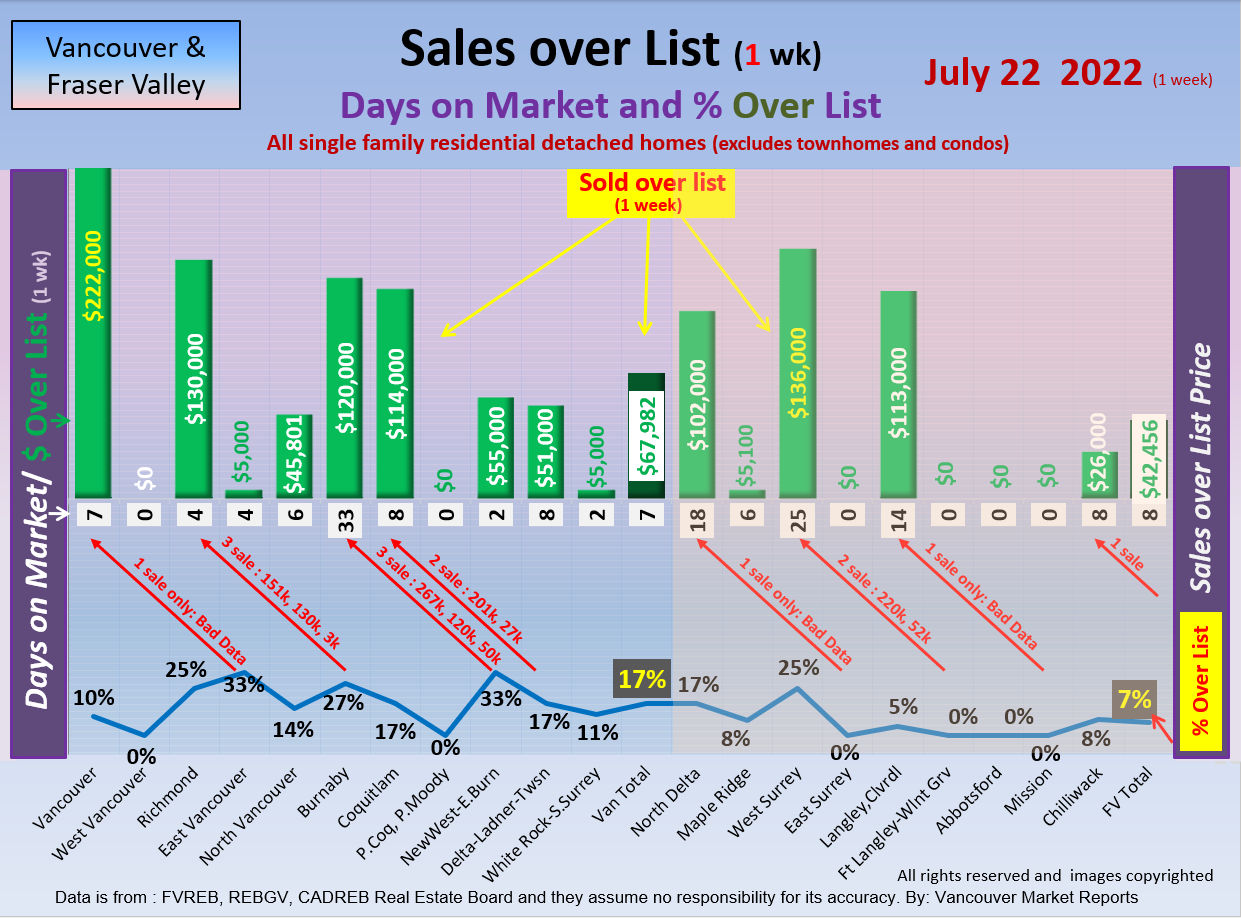
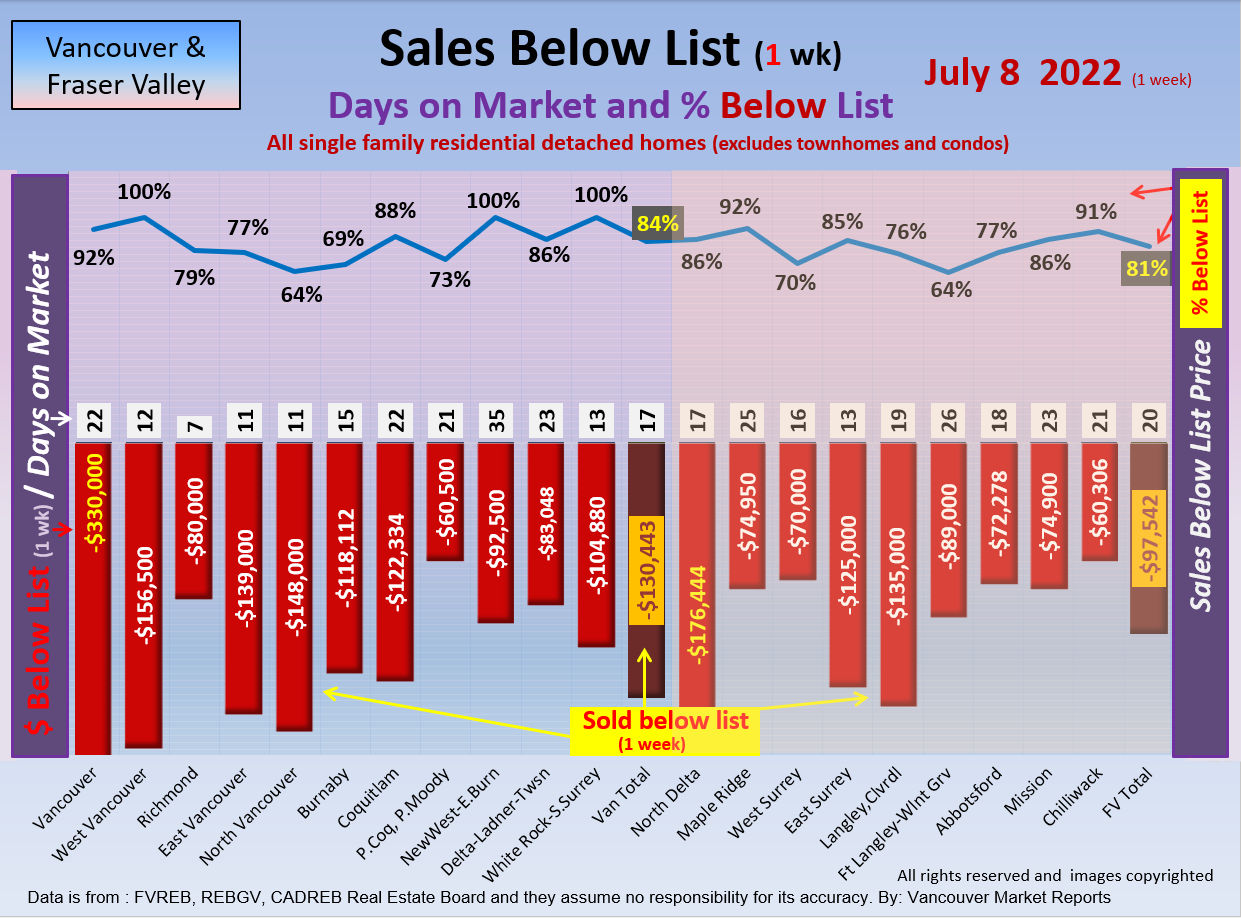
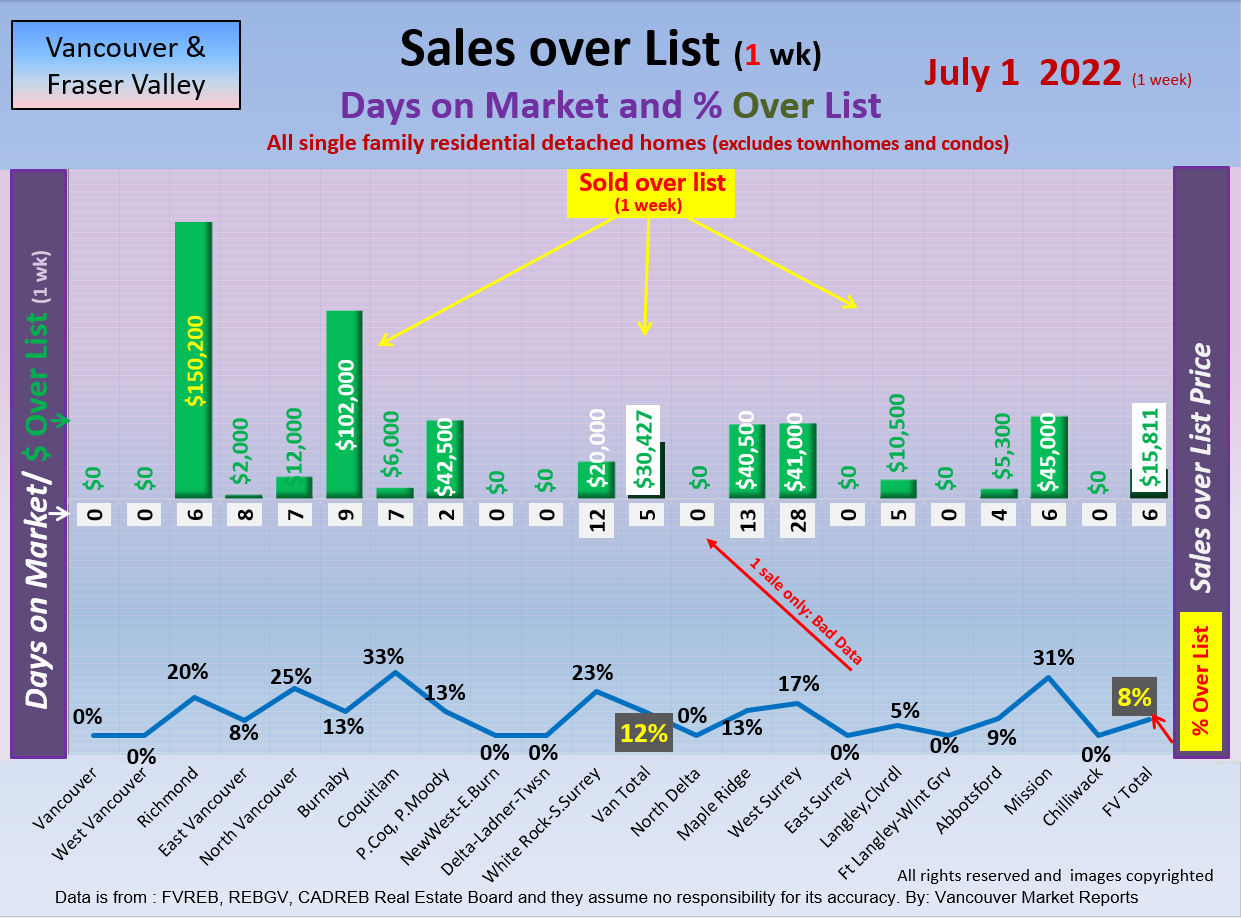
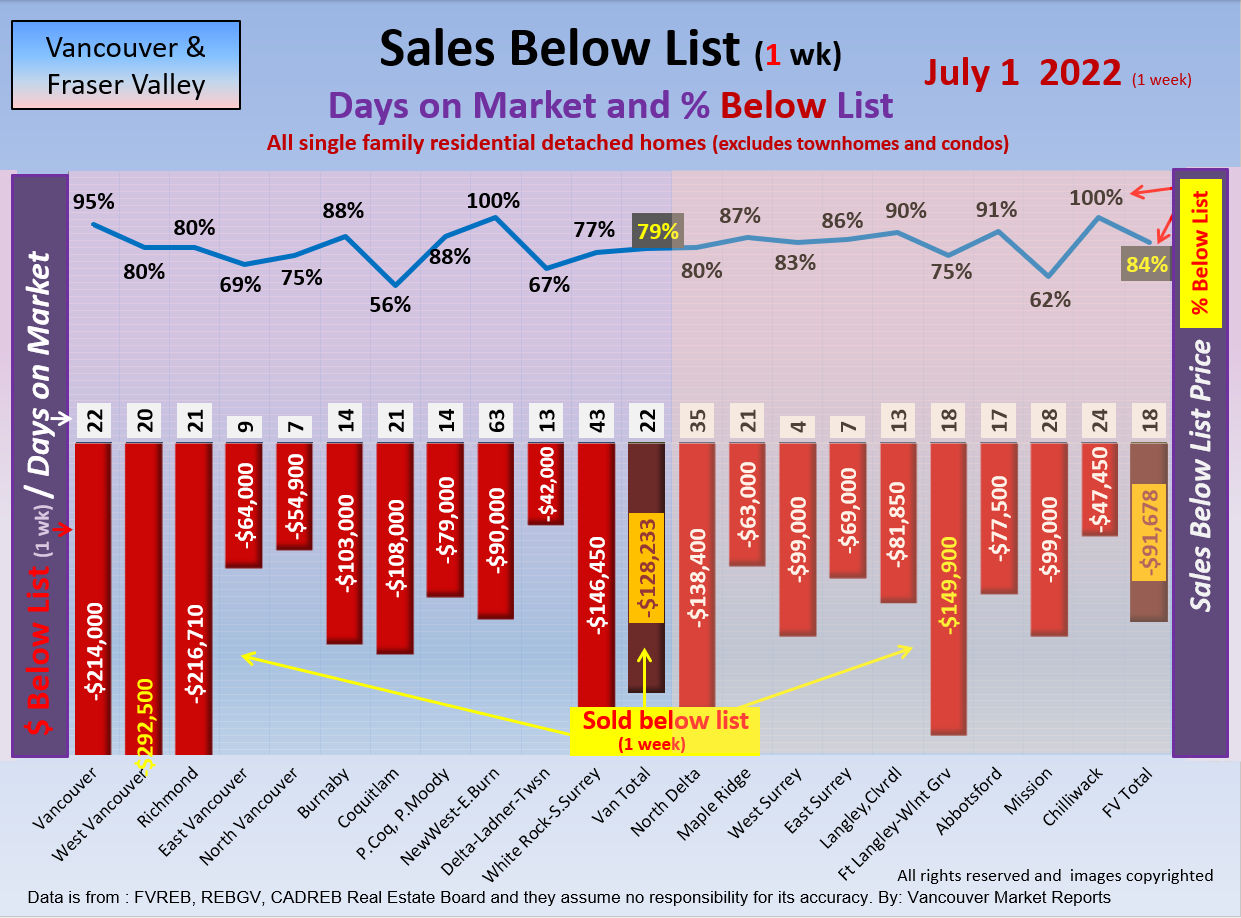
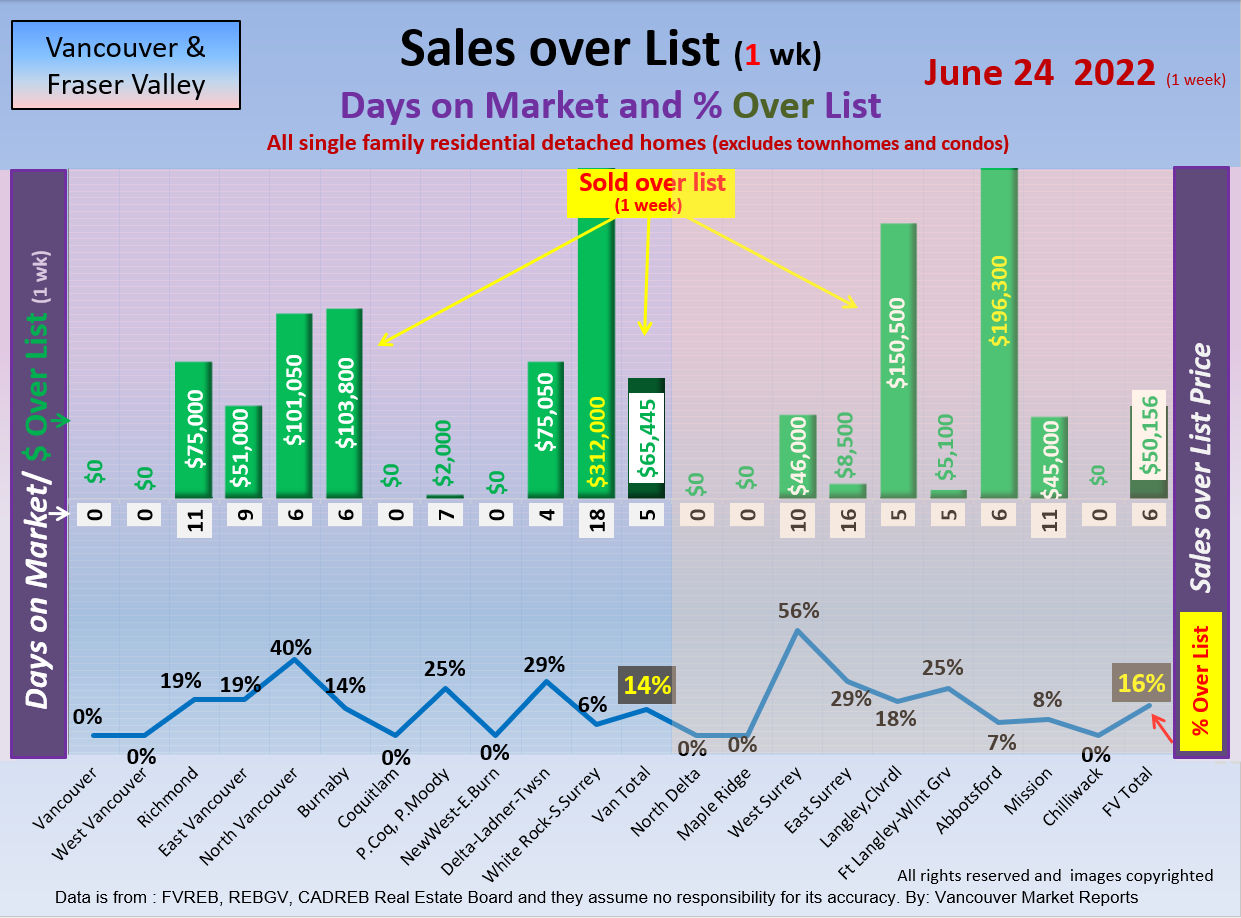
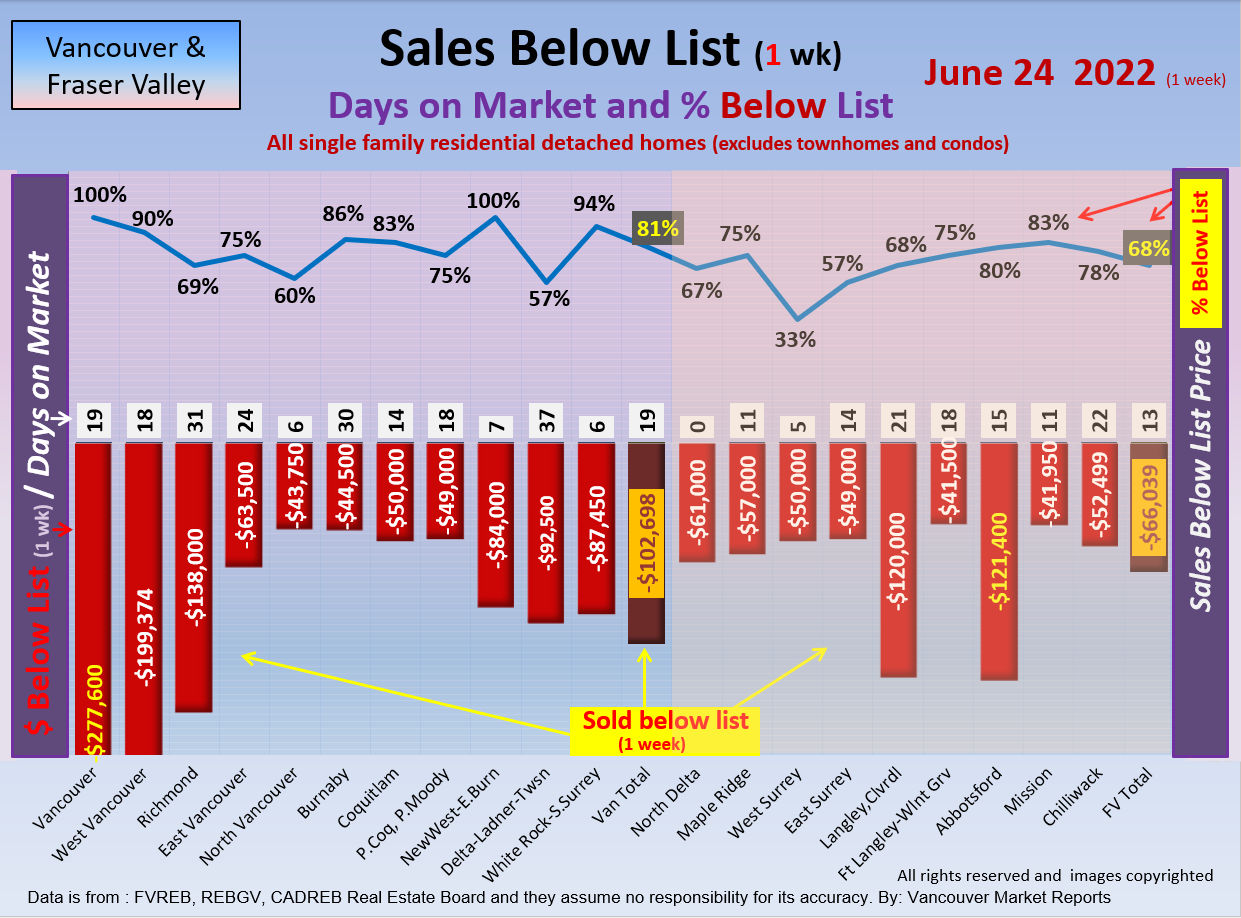
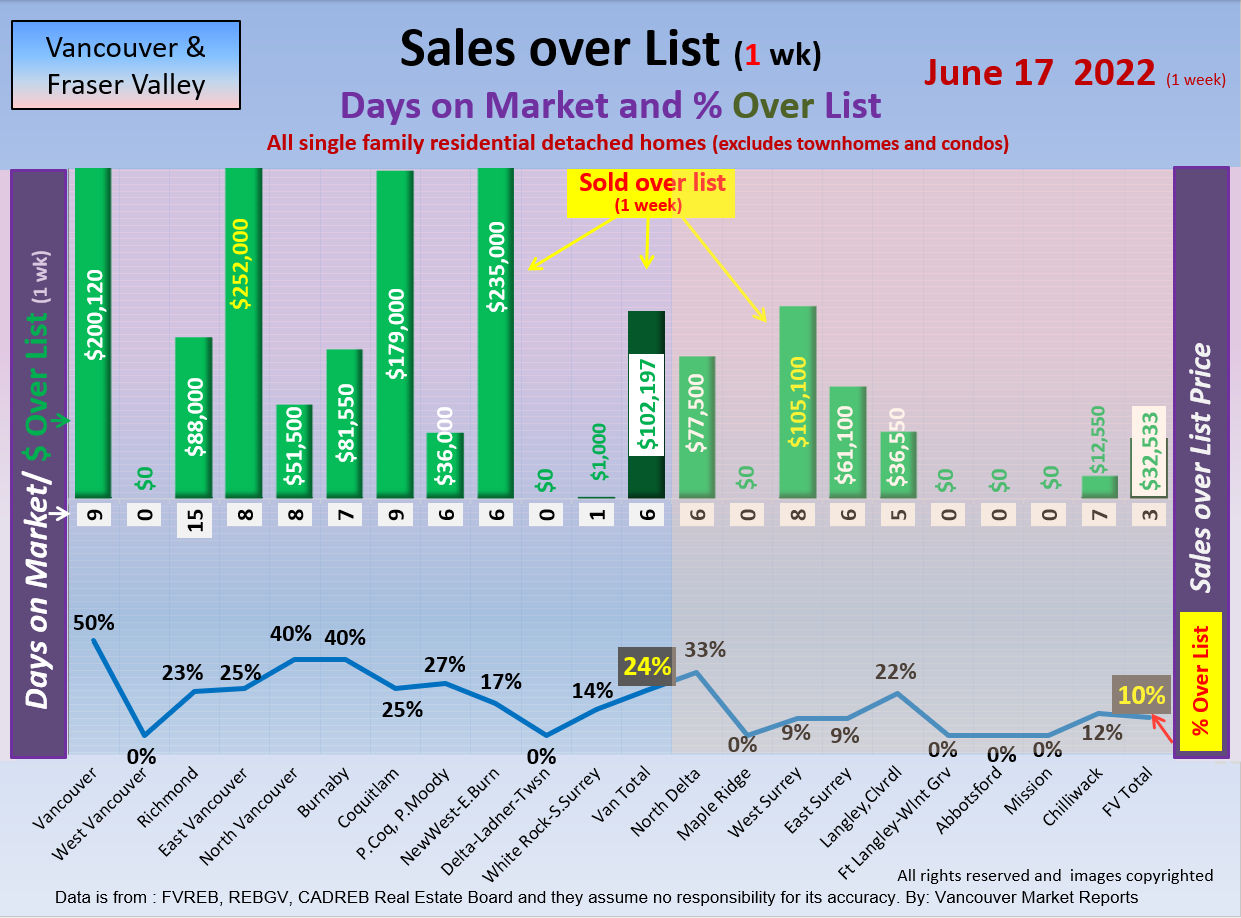
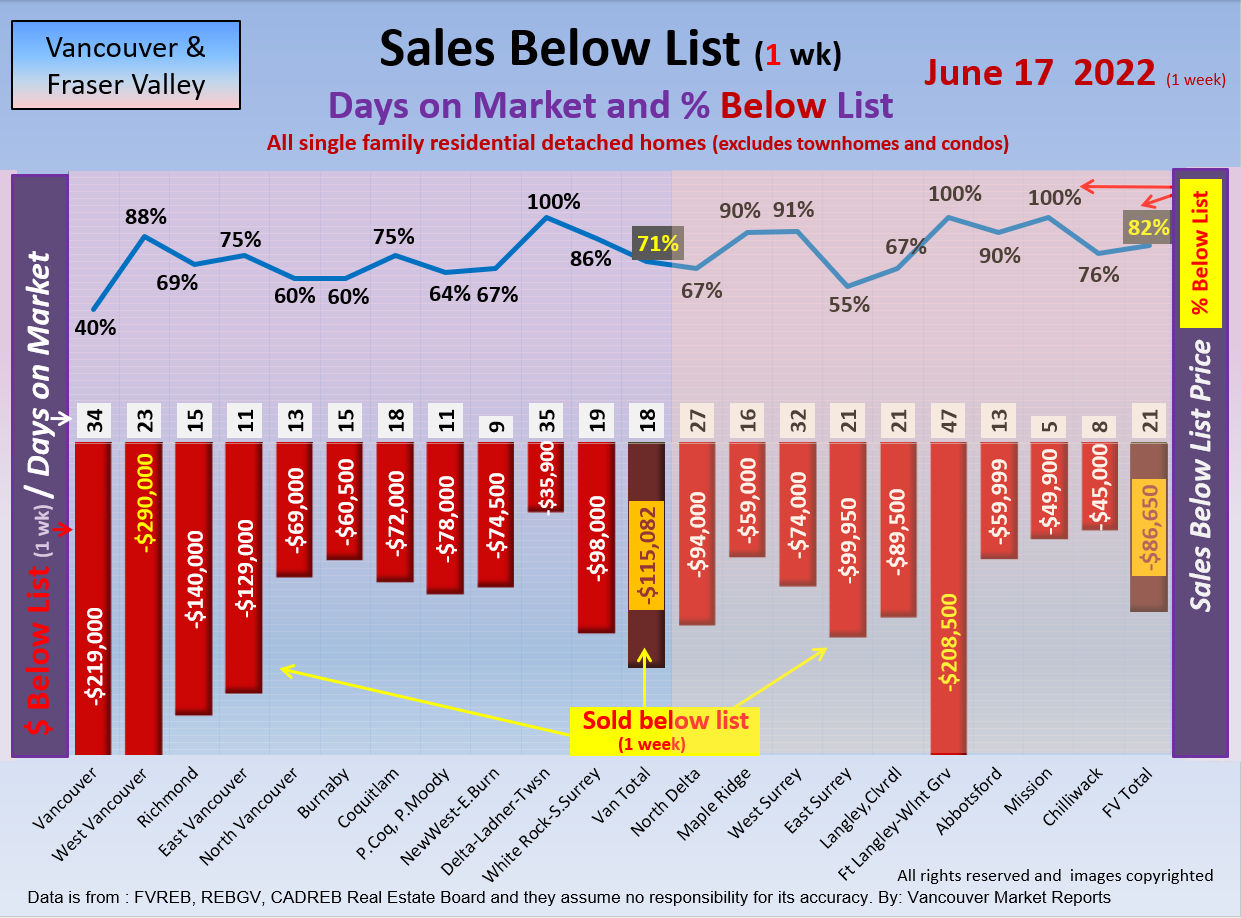
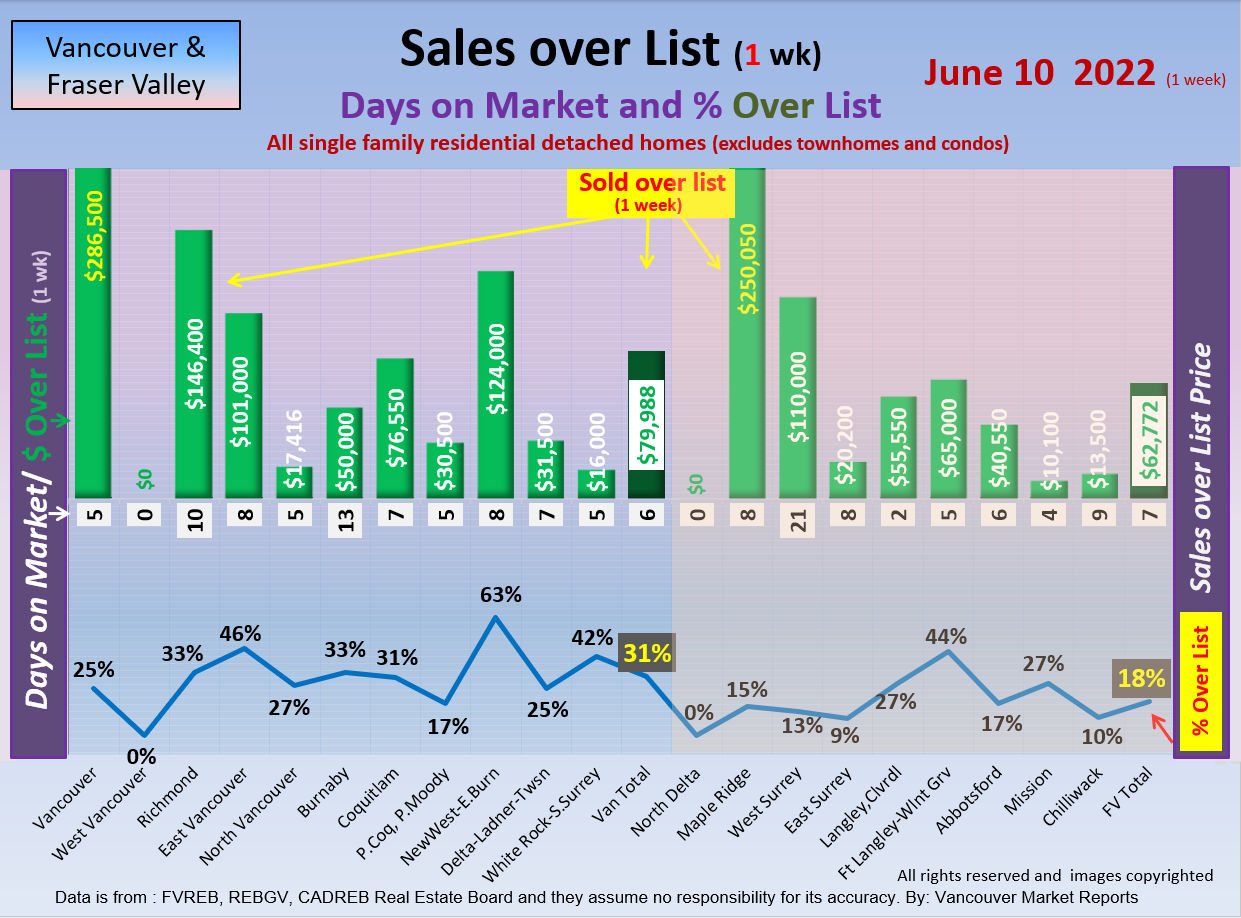
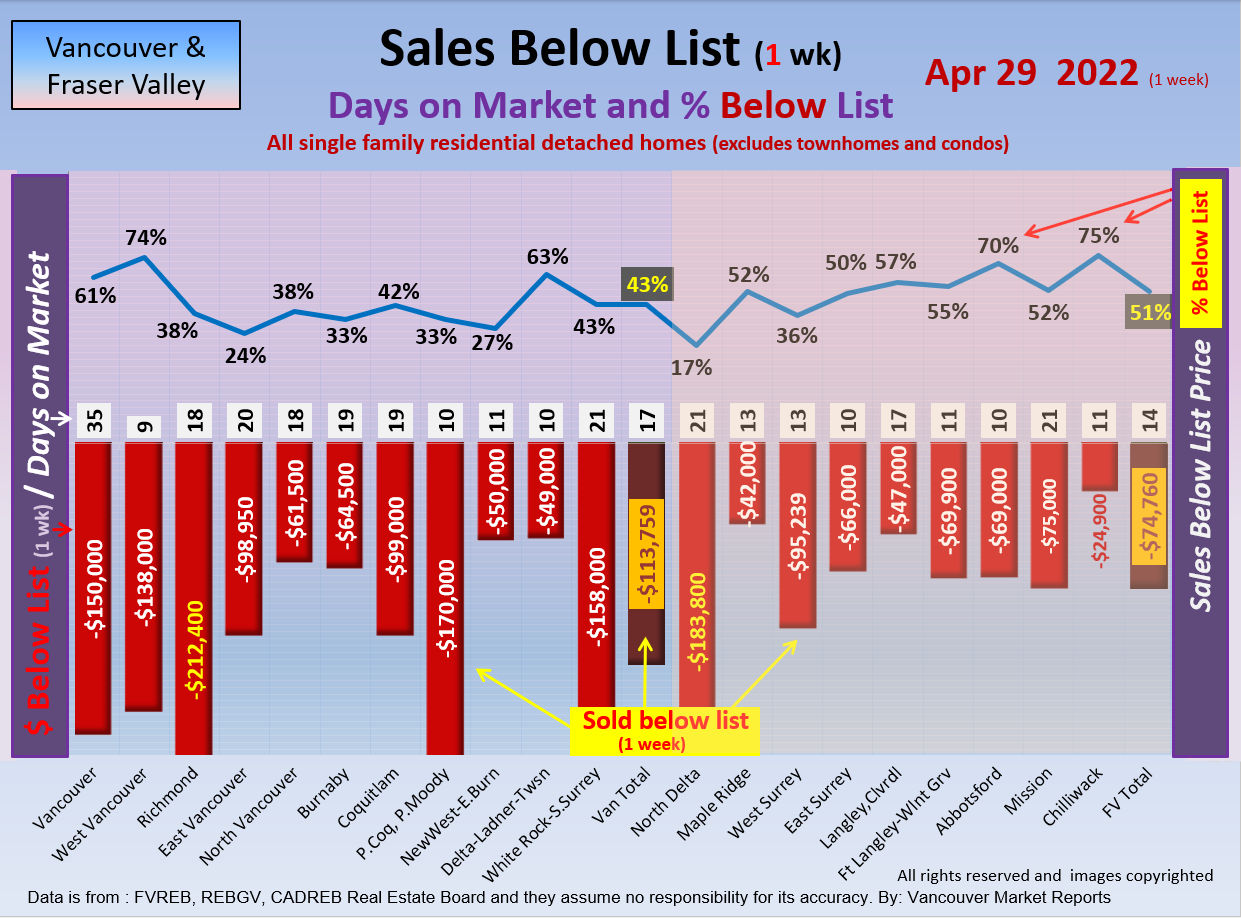
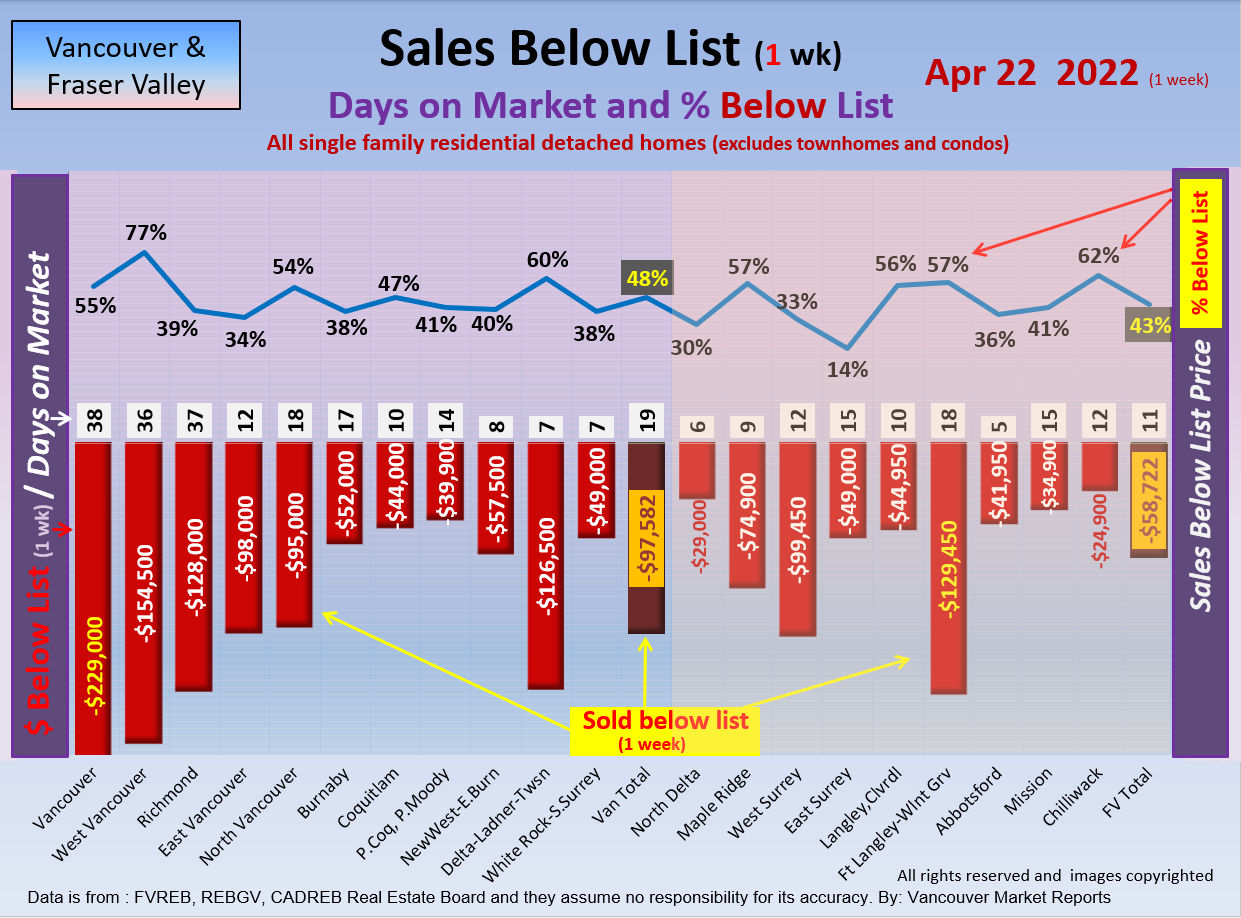
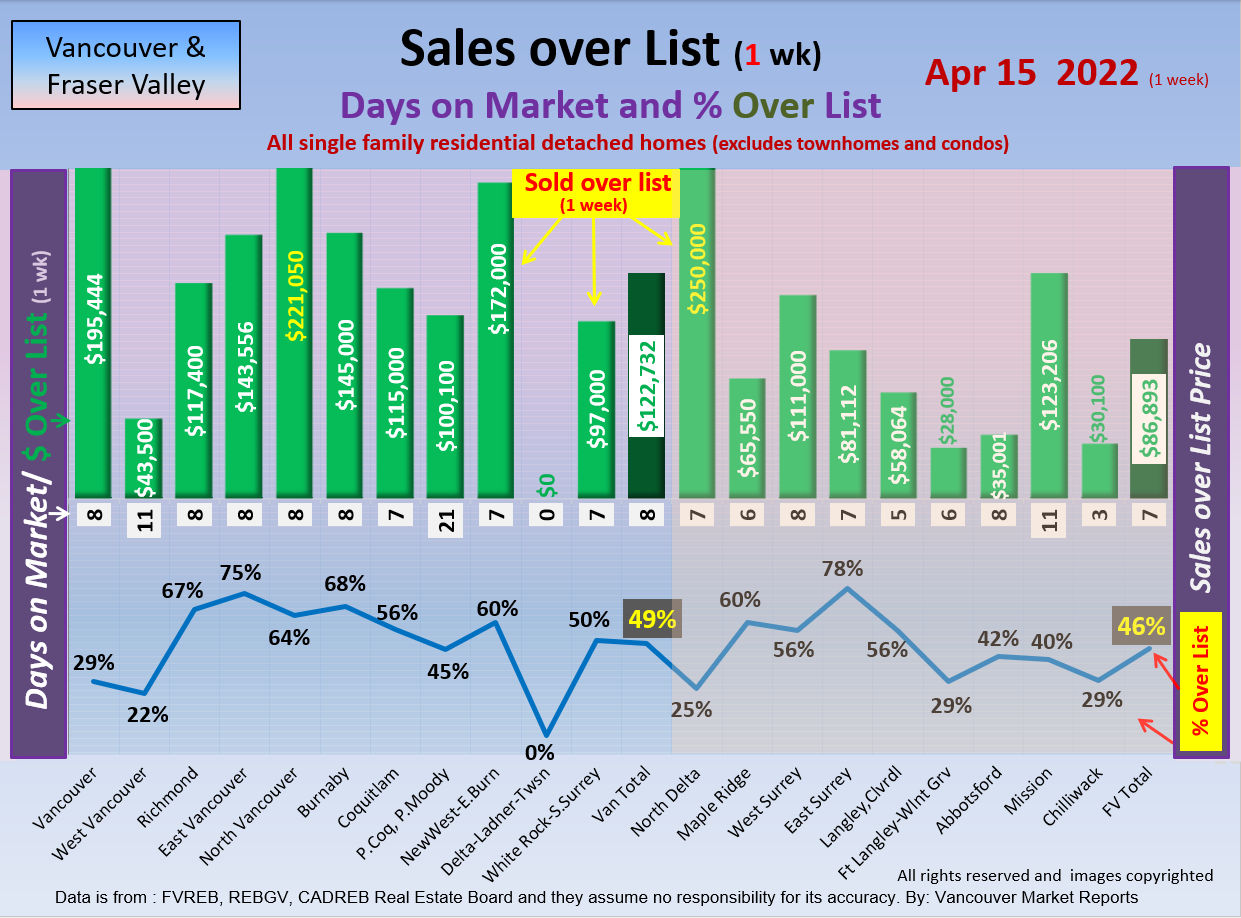
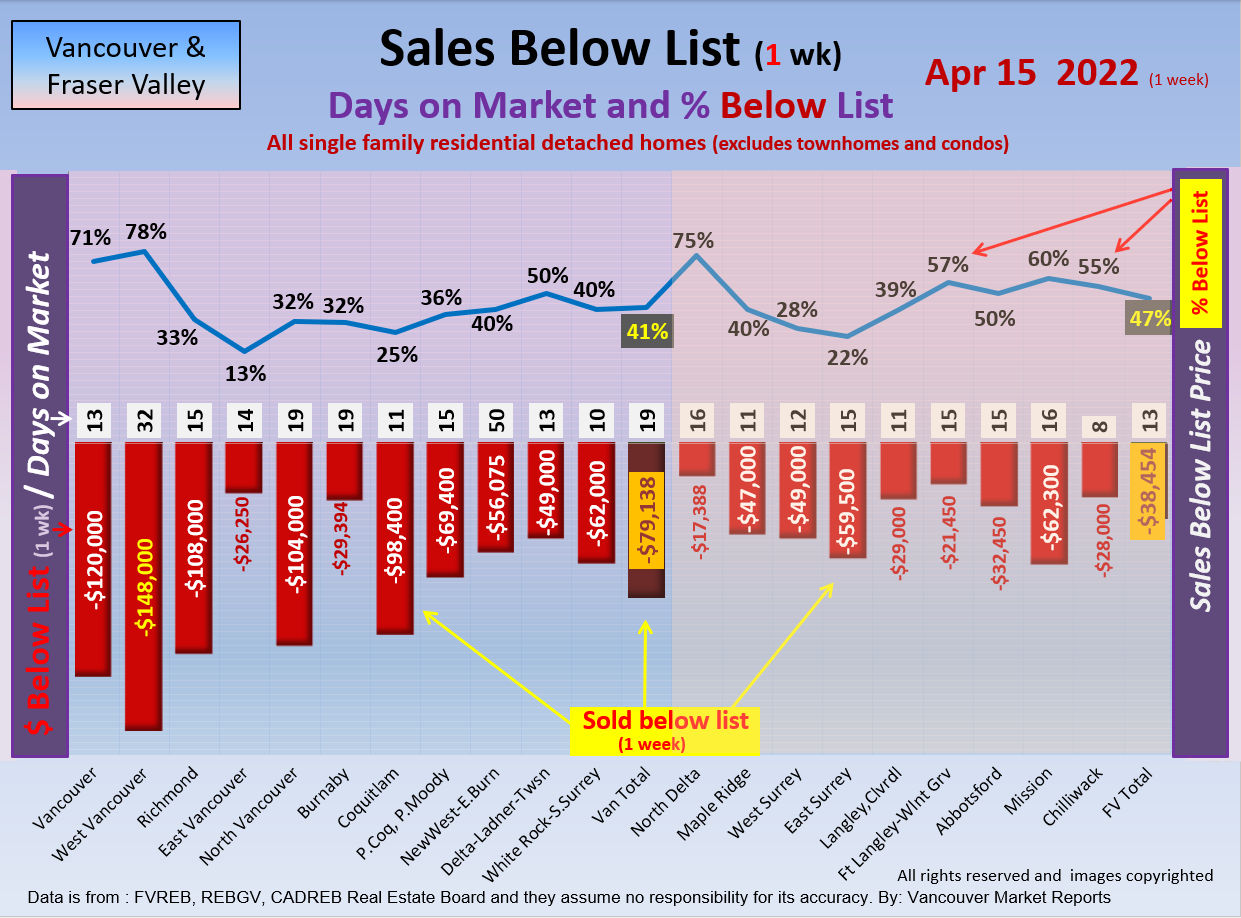
Now do compare the Weekly Discounts to the year 2022

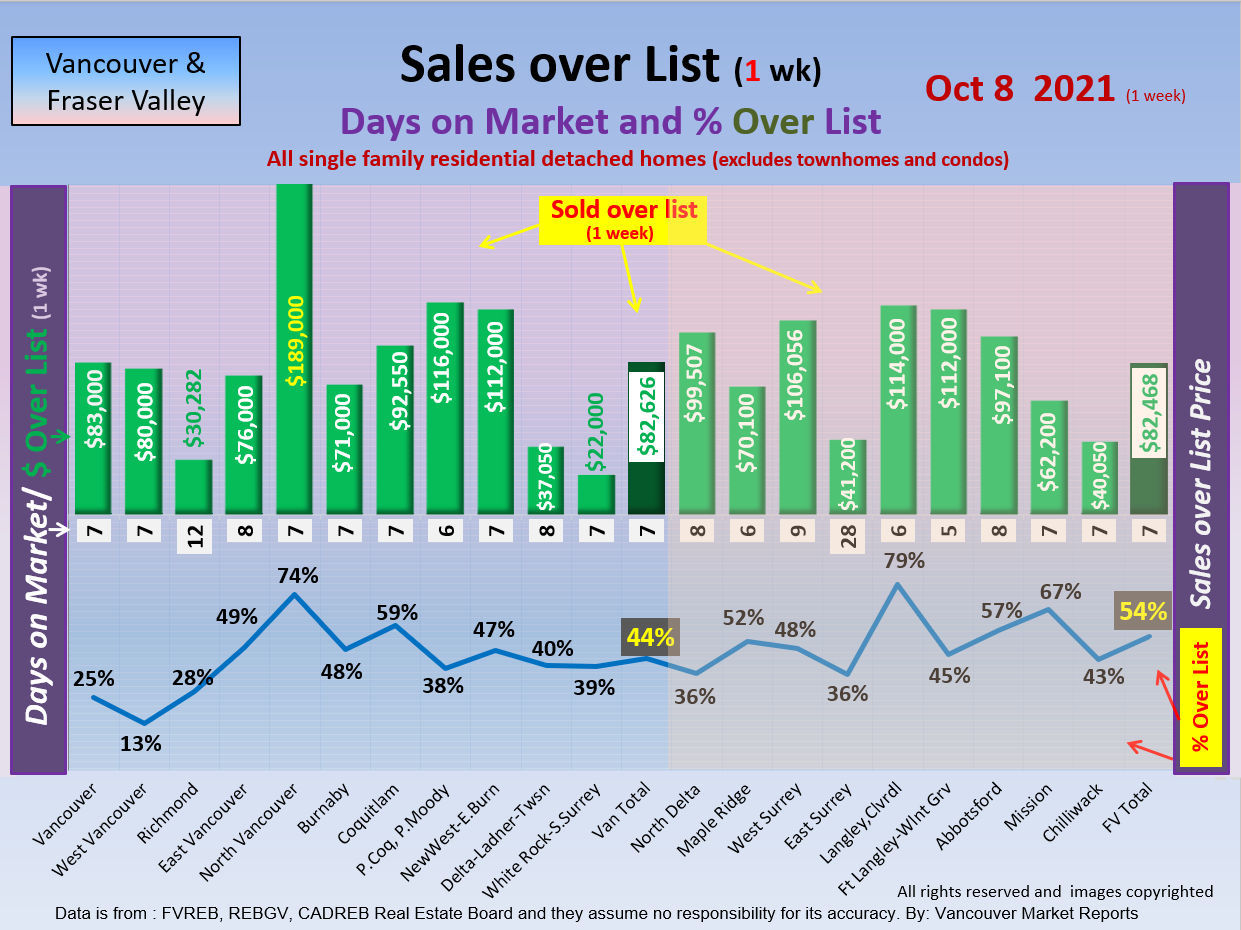
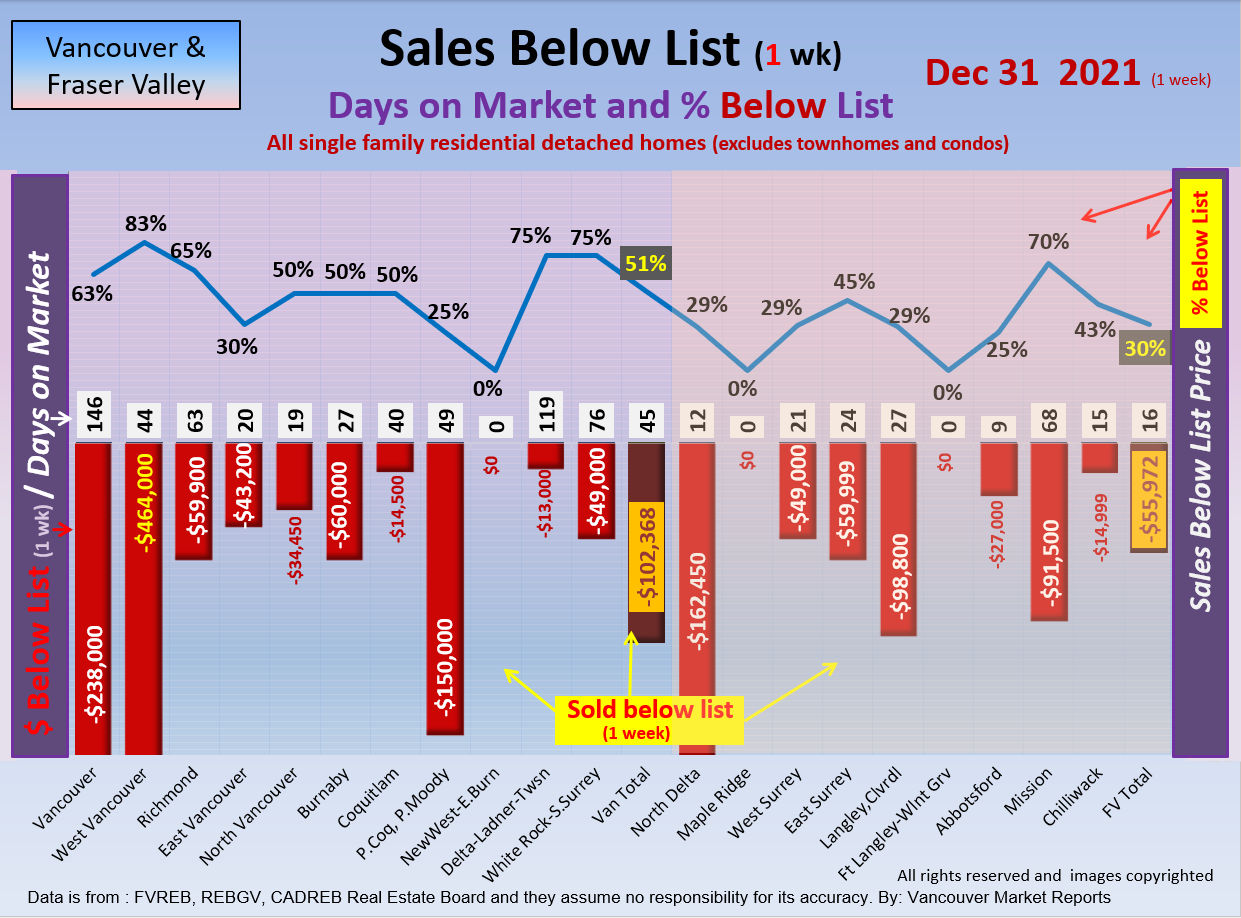
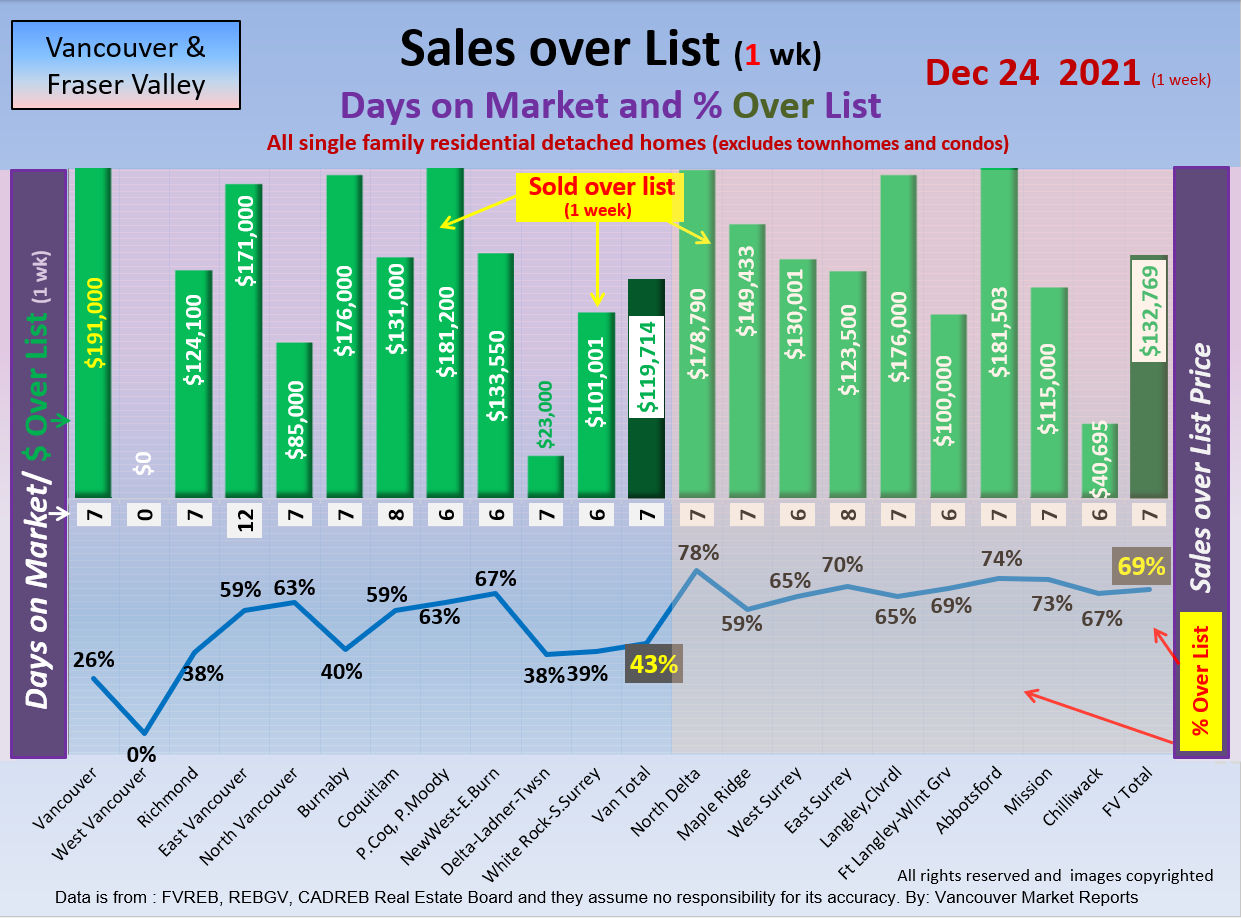
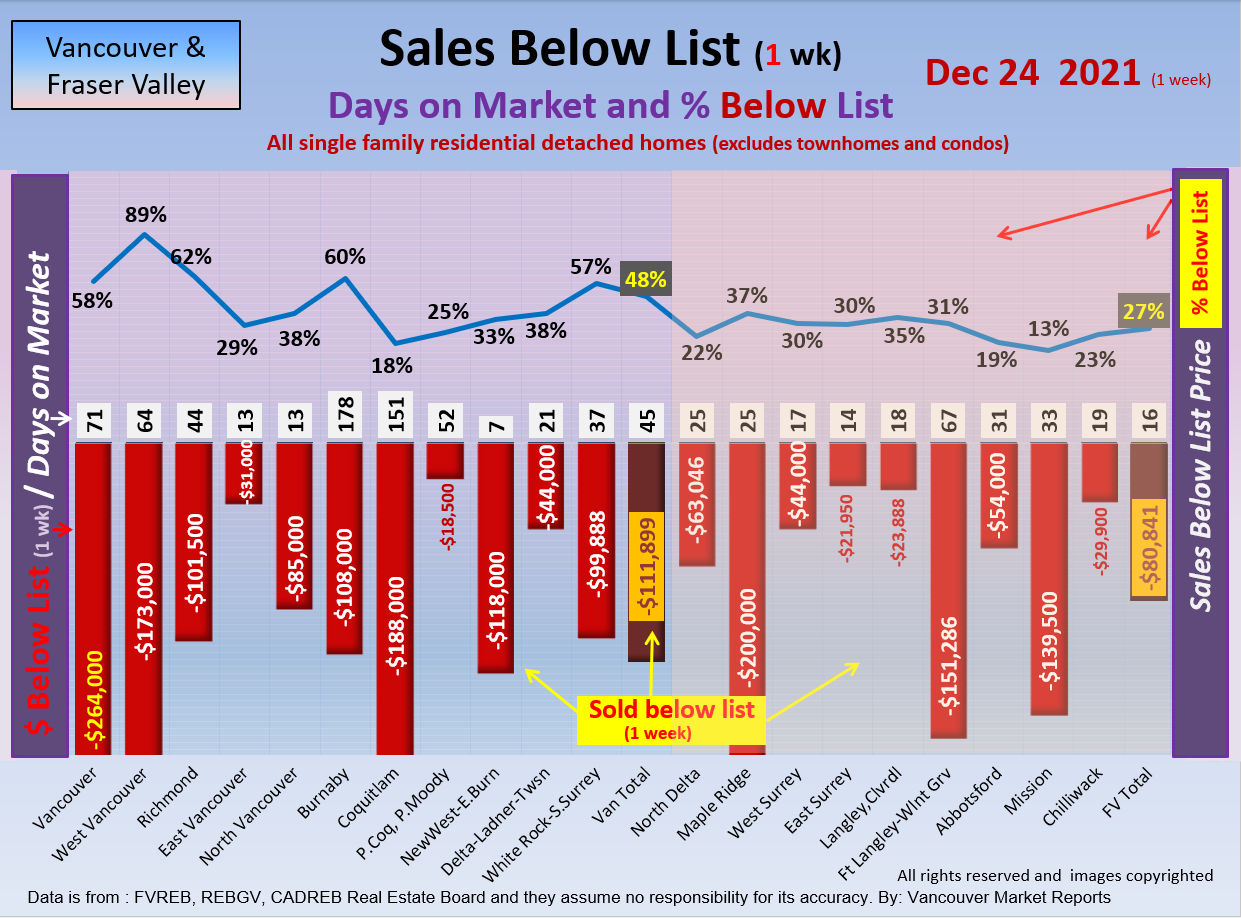
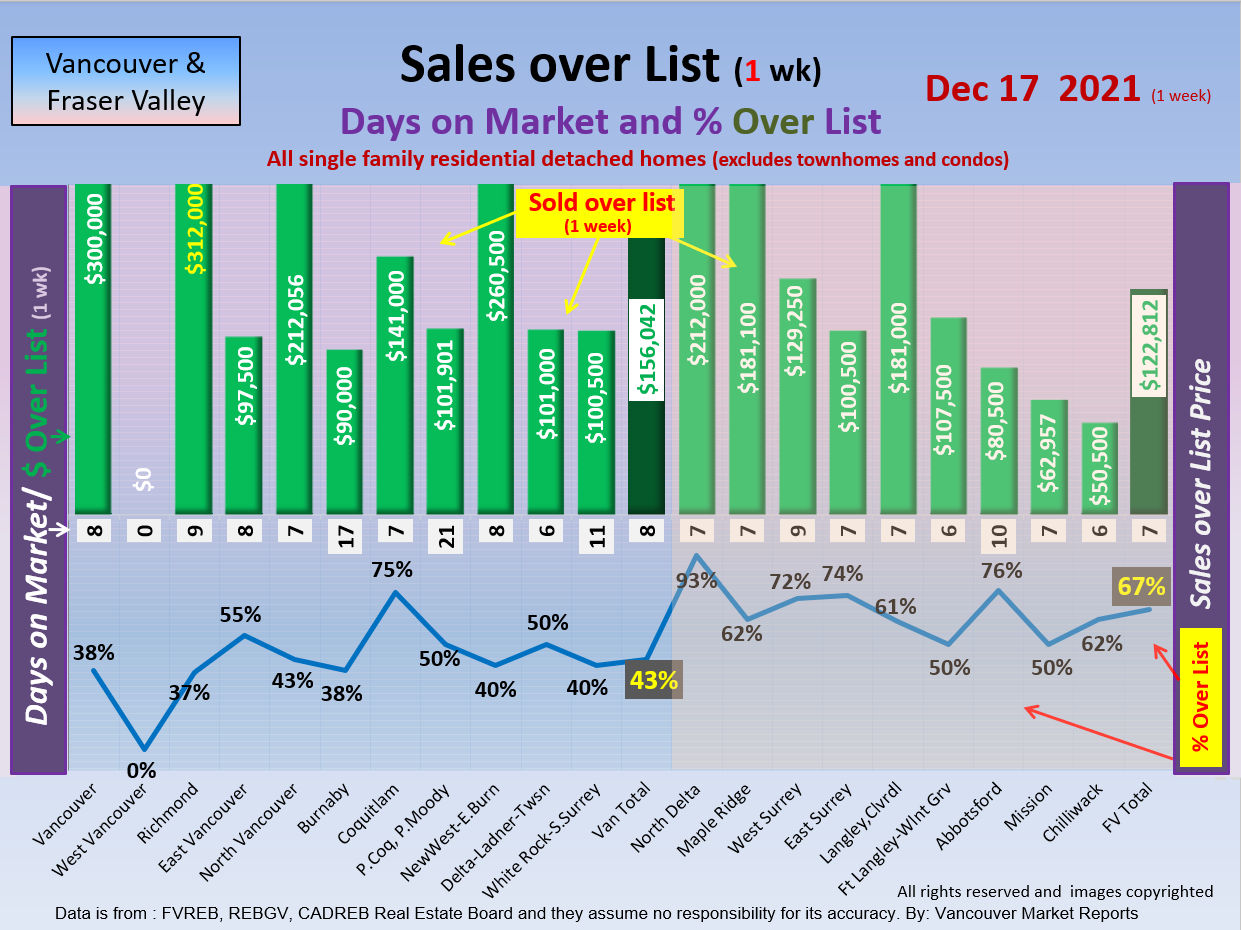
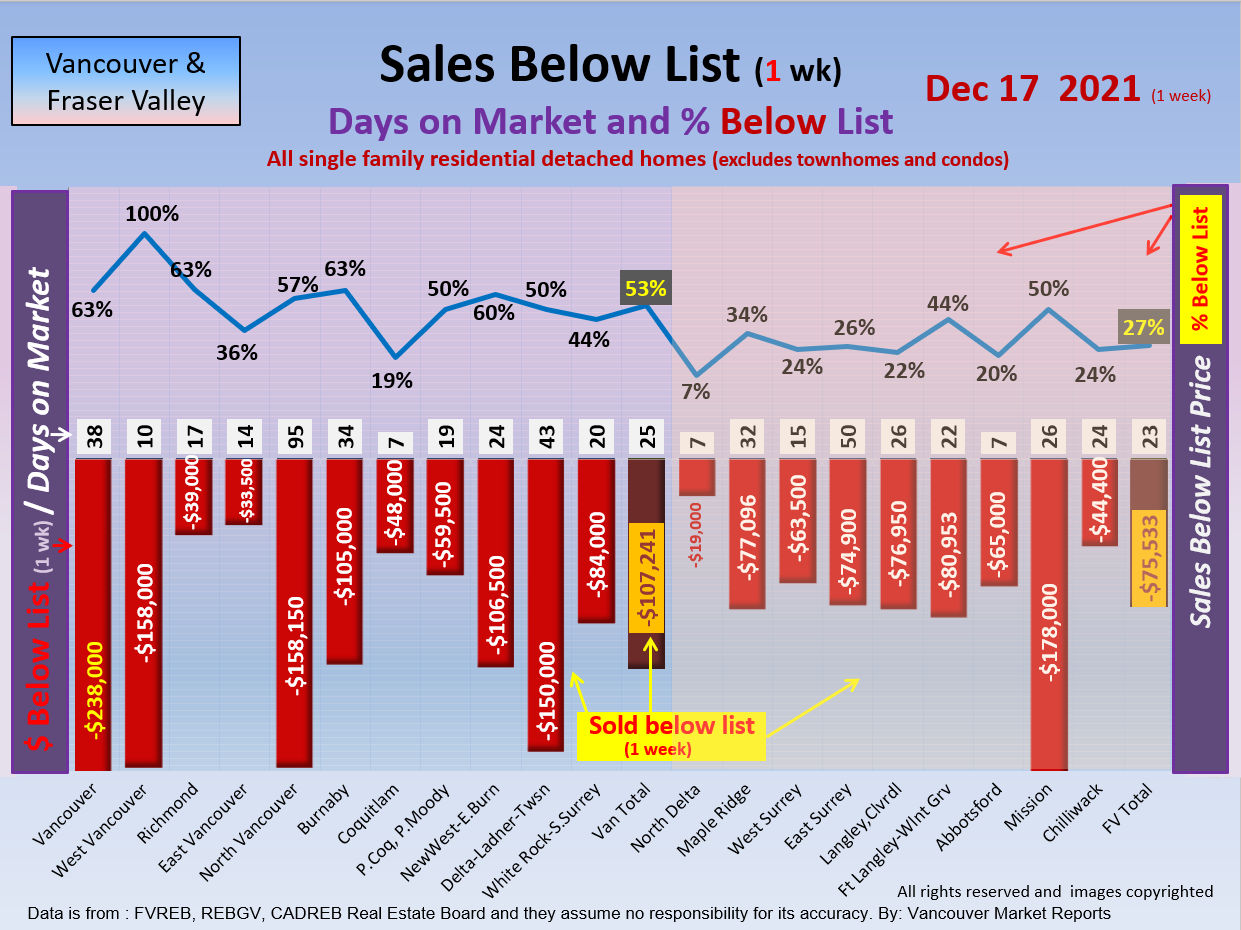
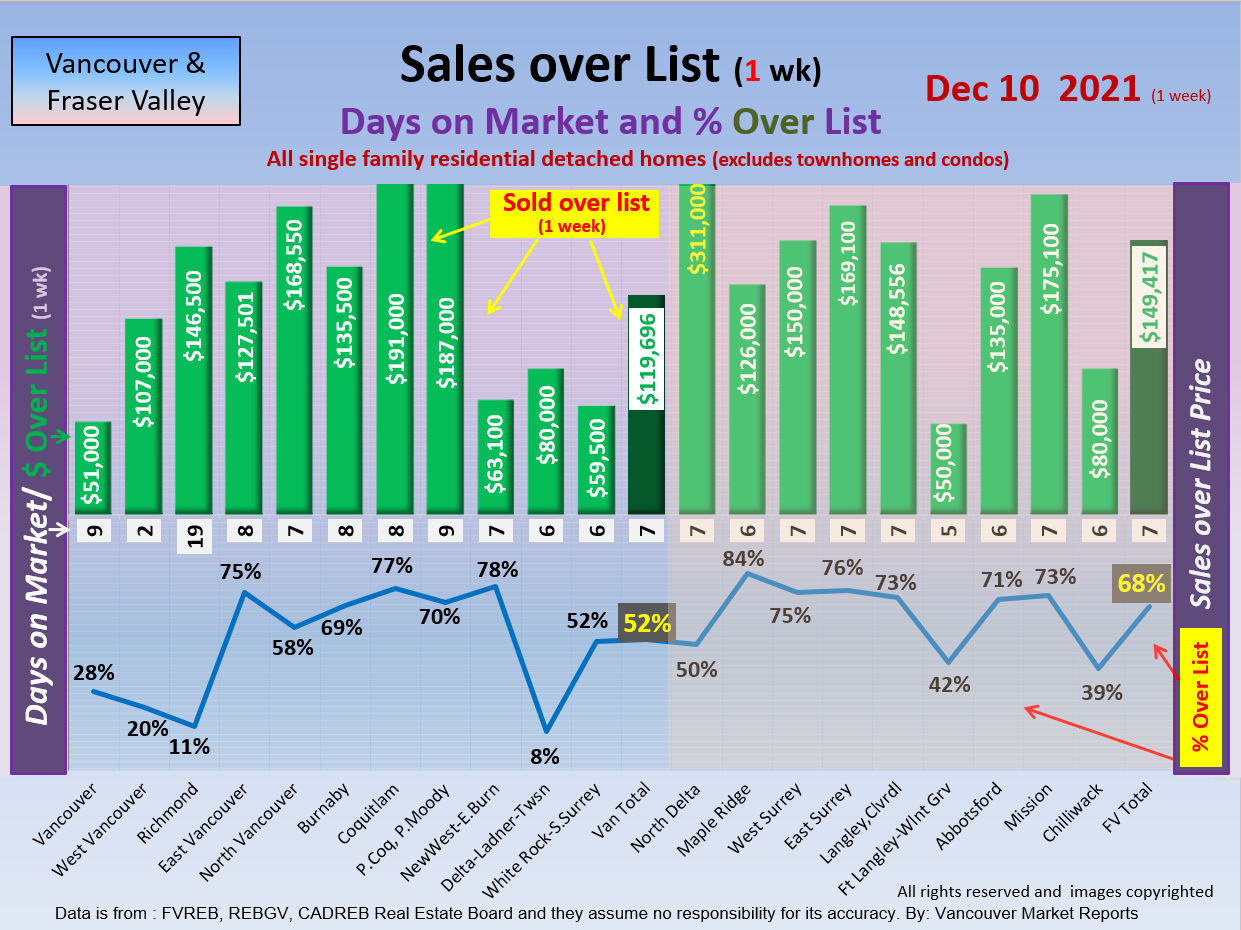
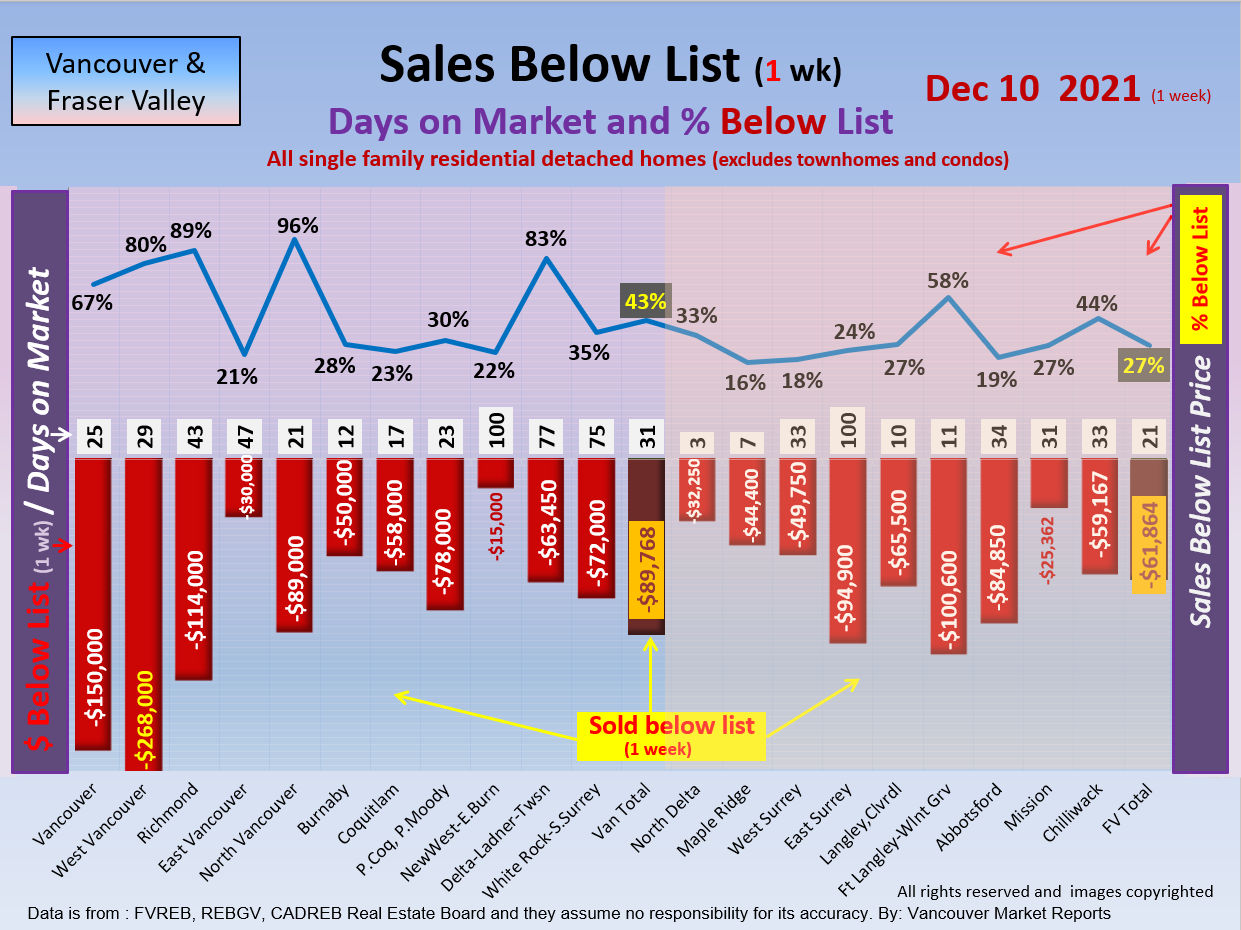
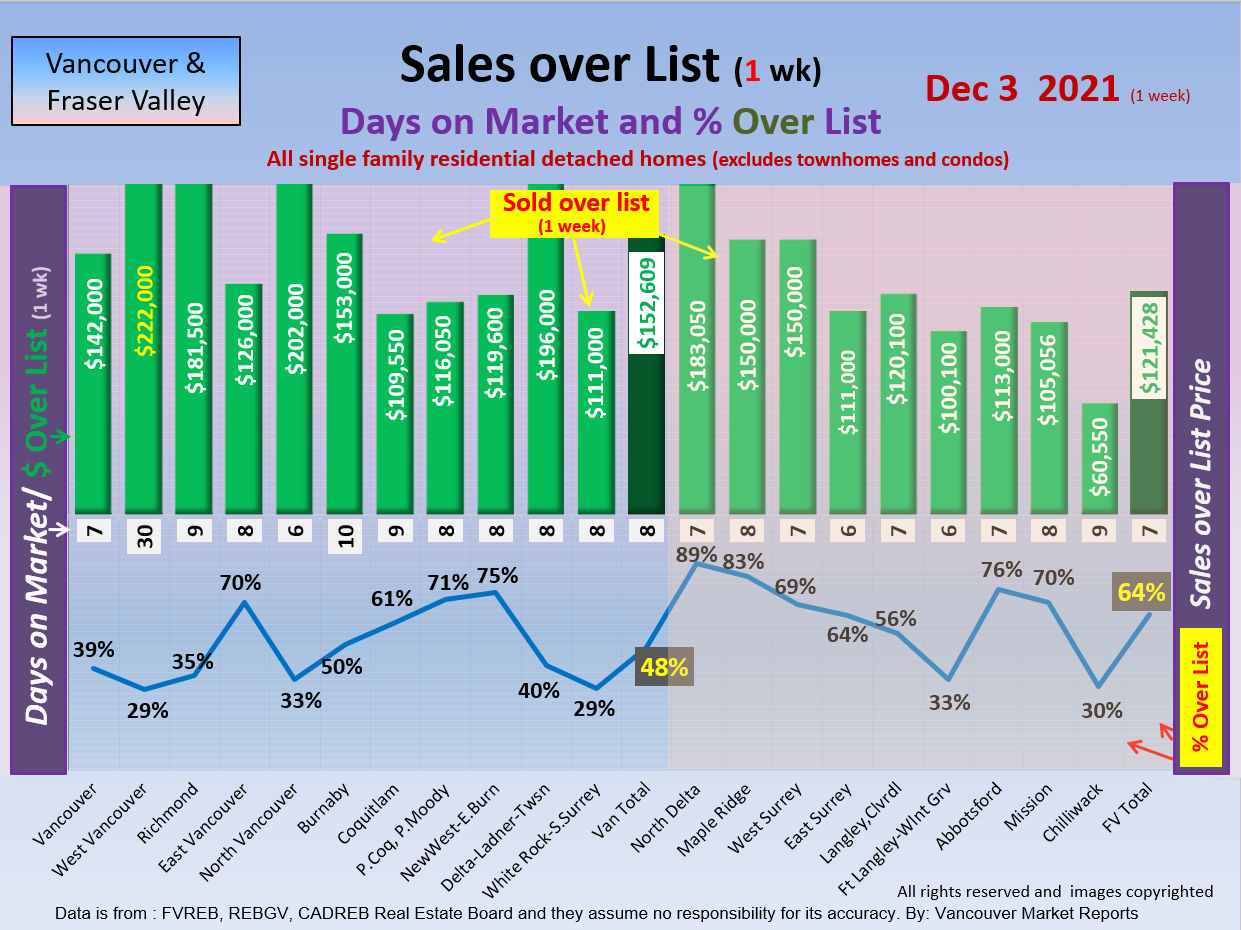
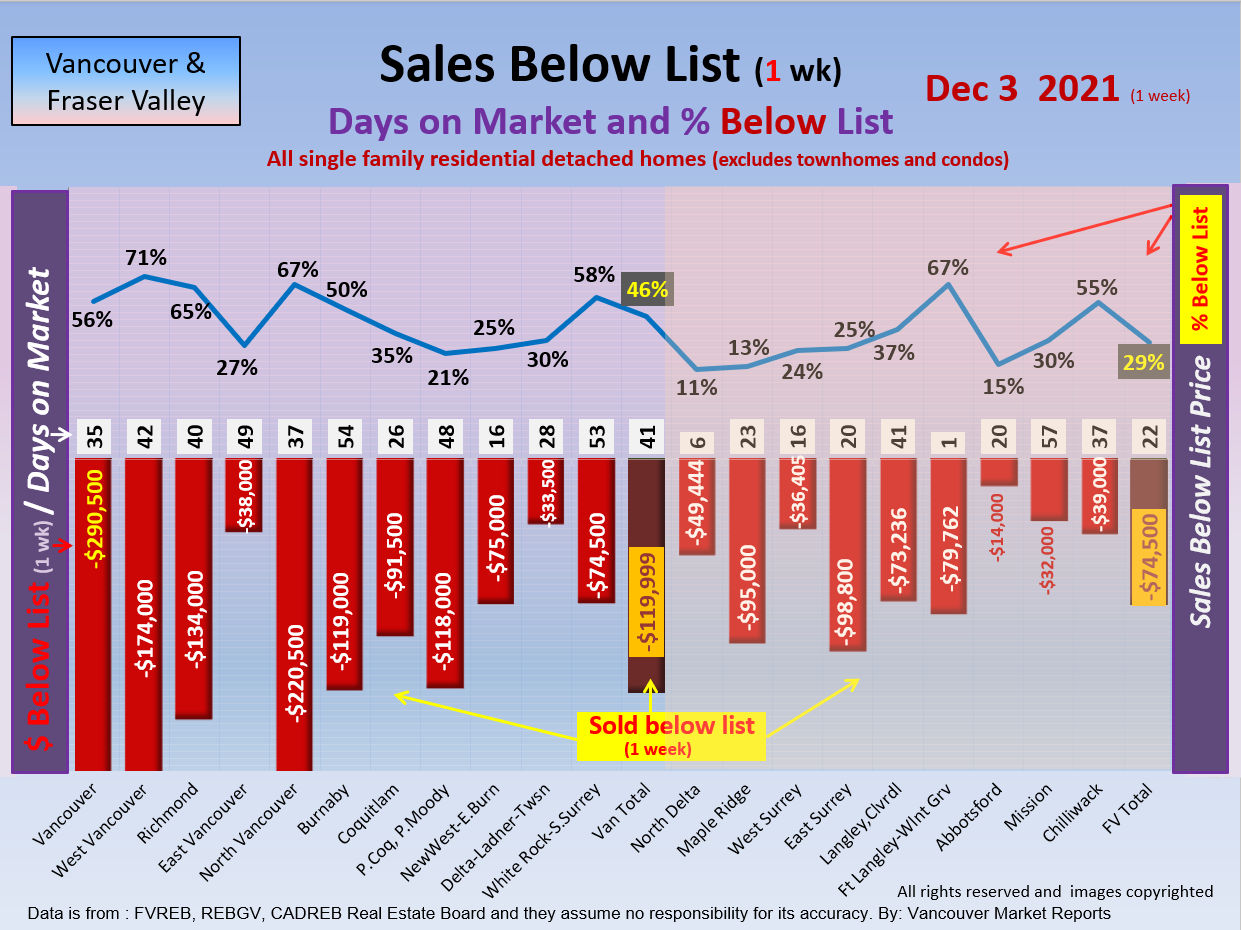
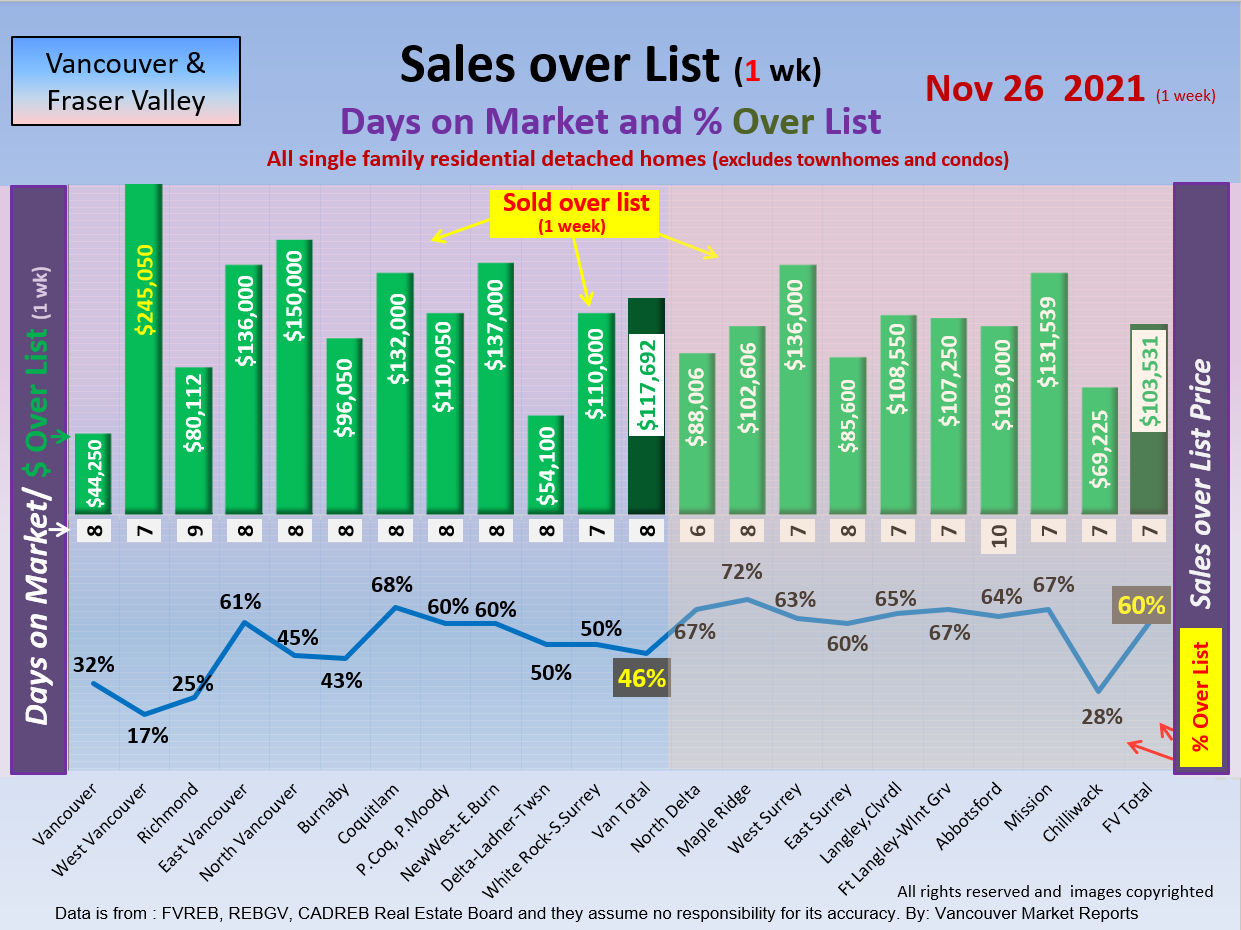
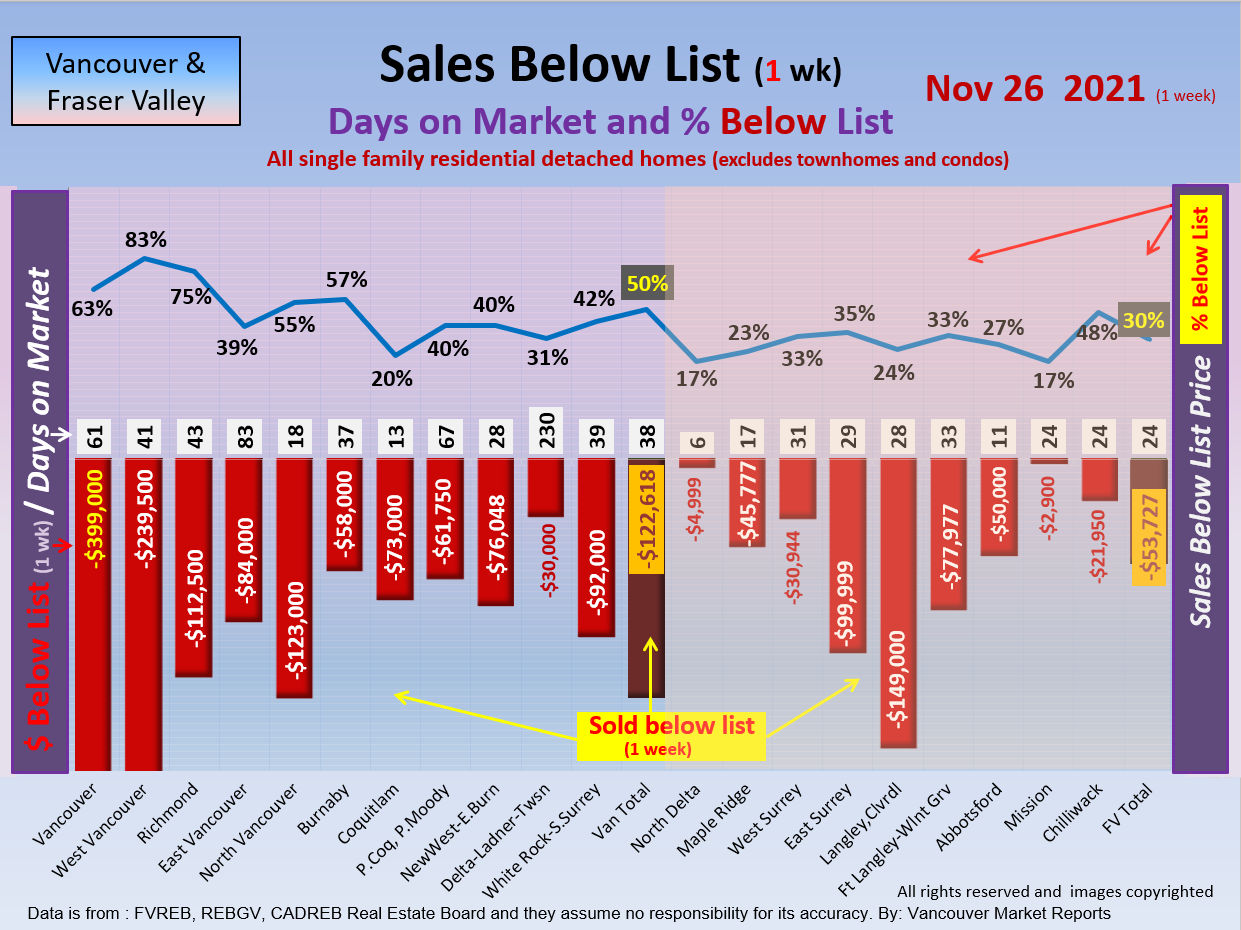
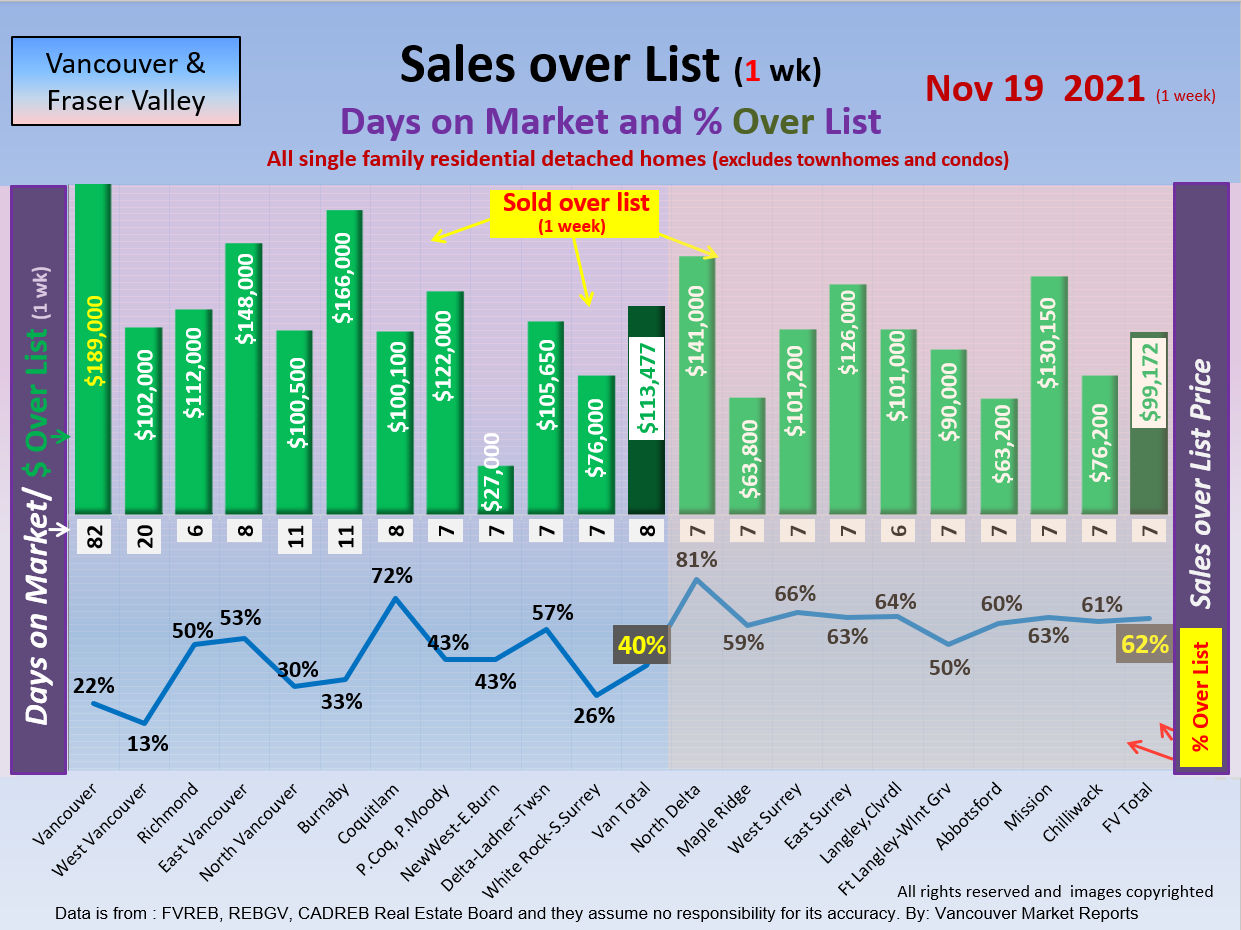
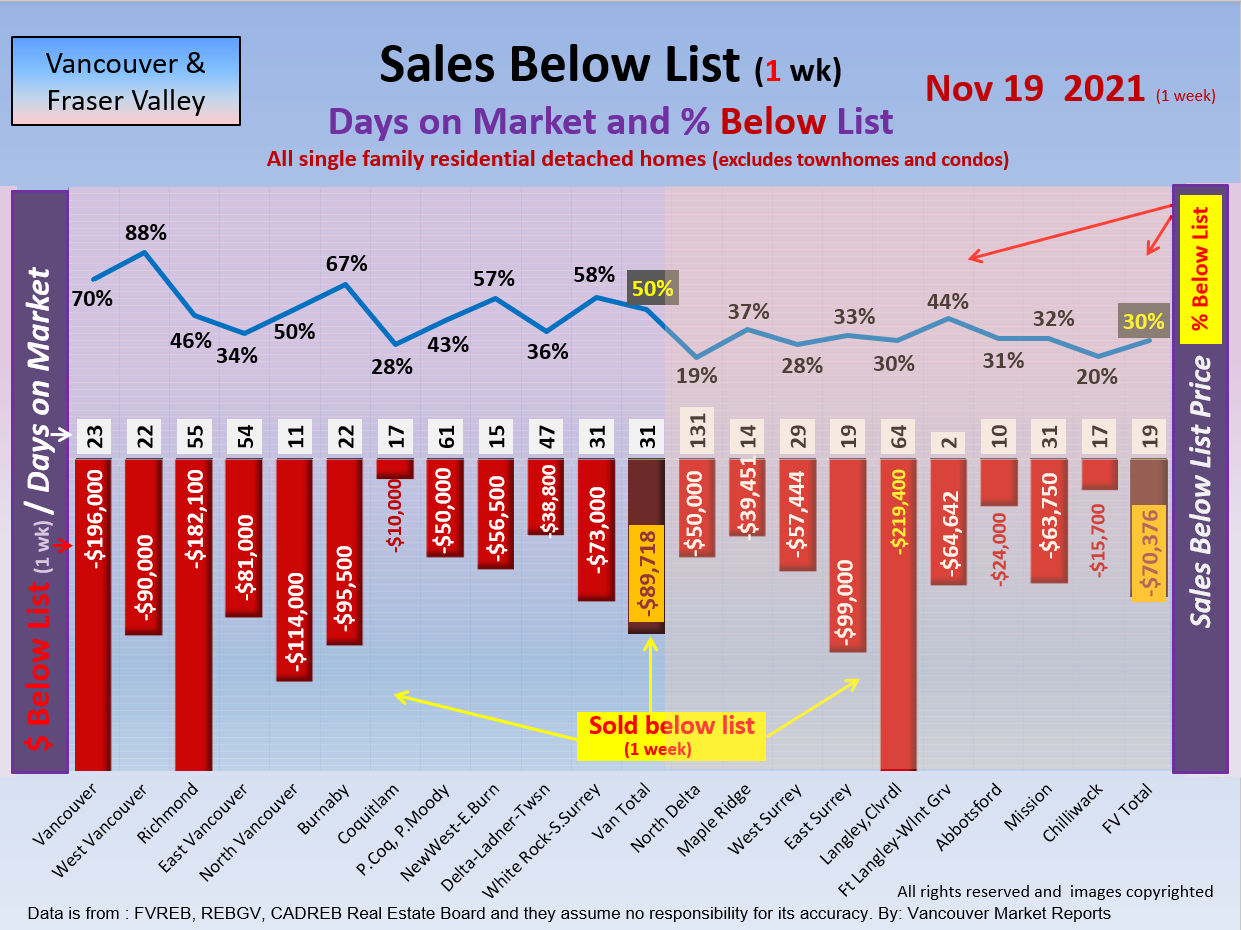
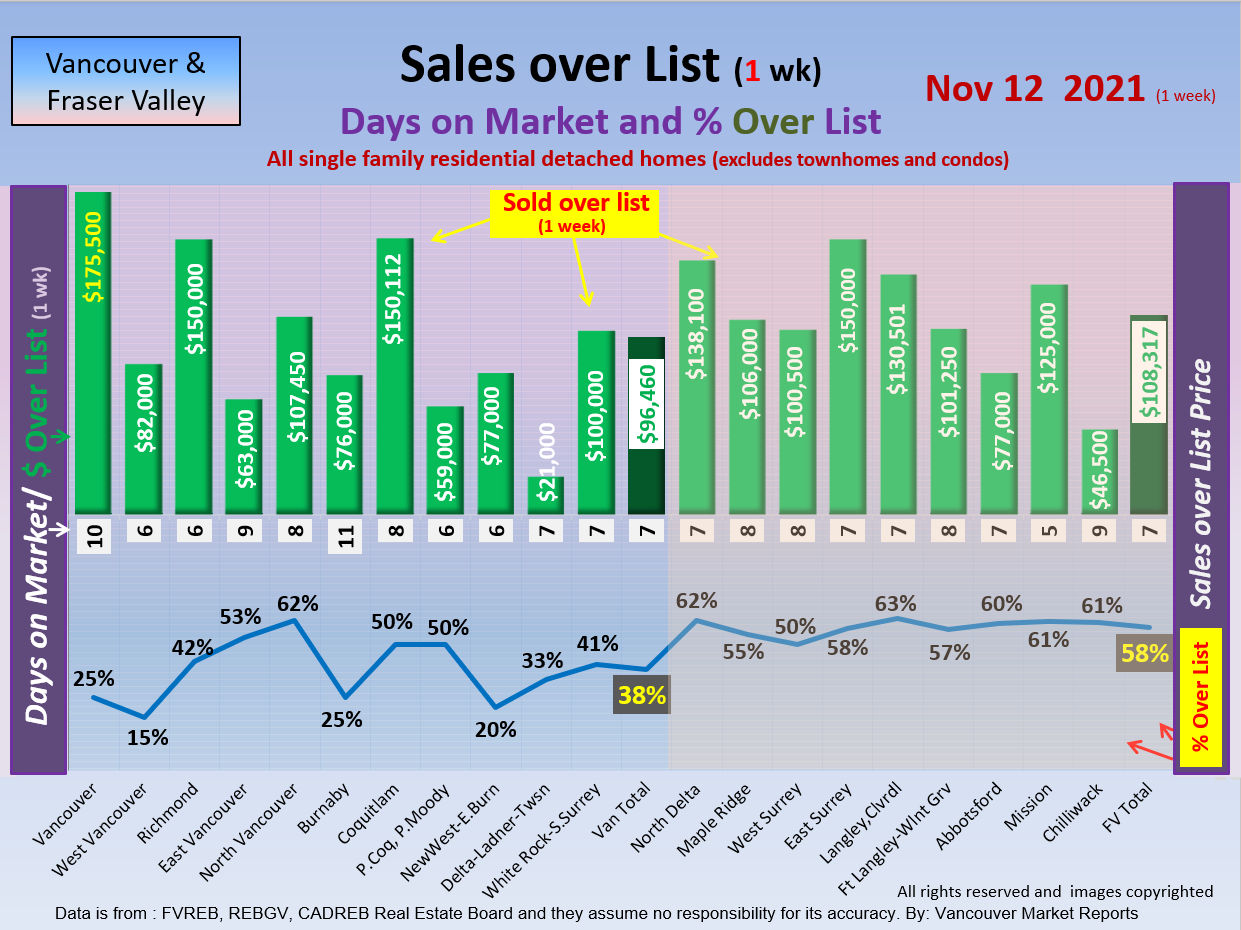
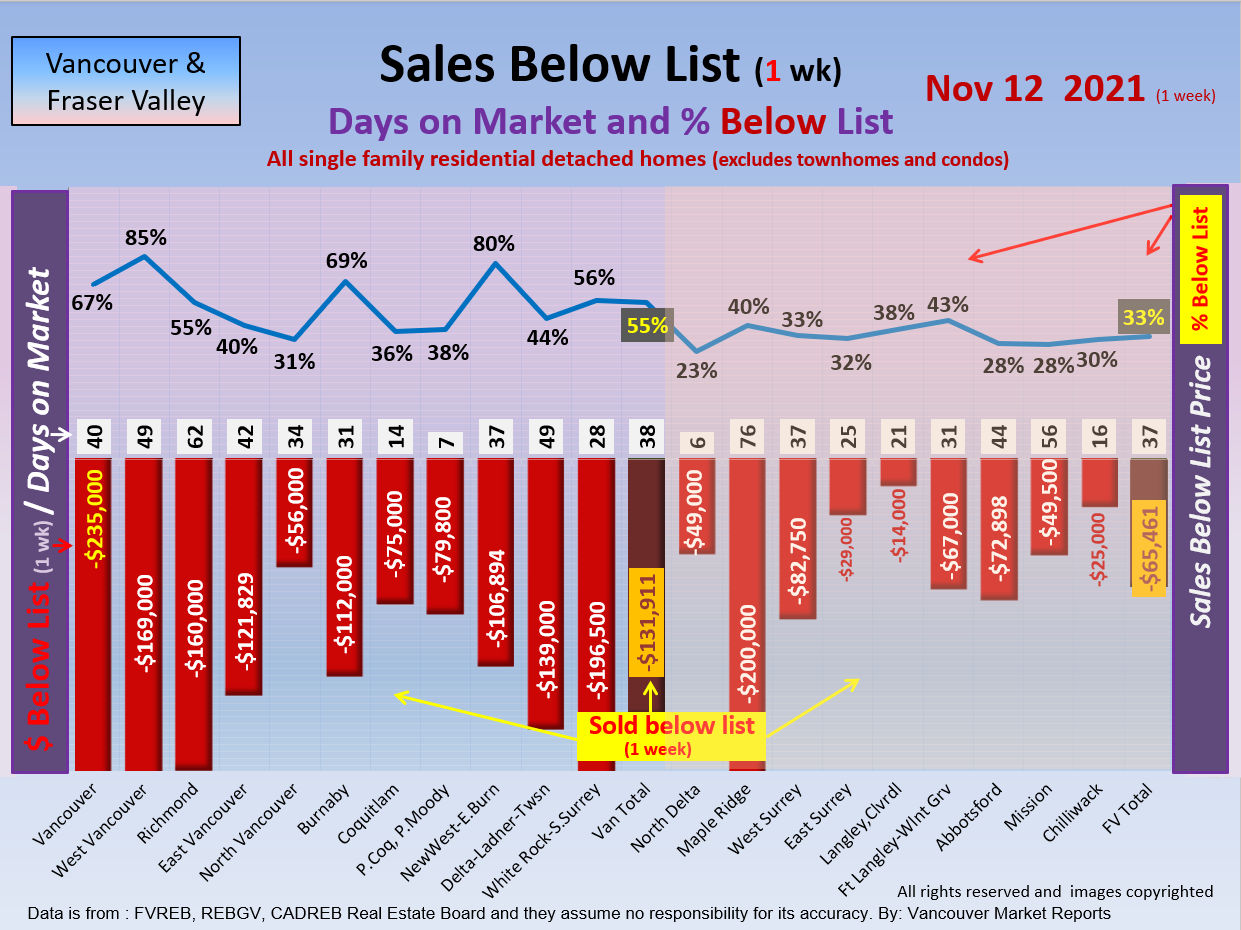
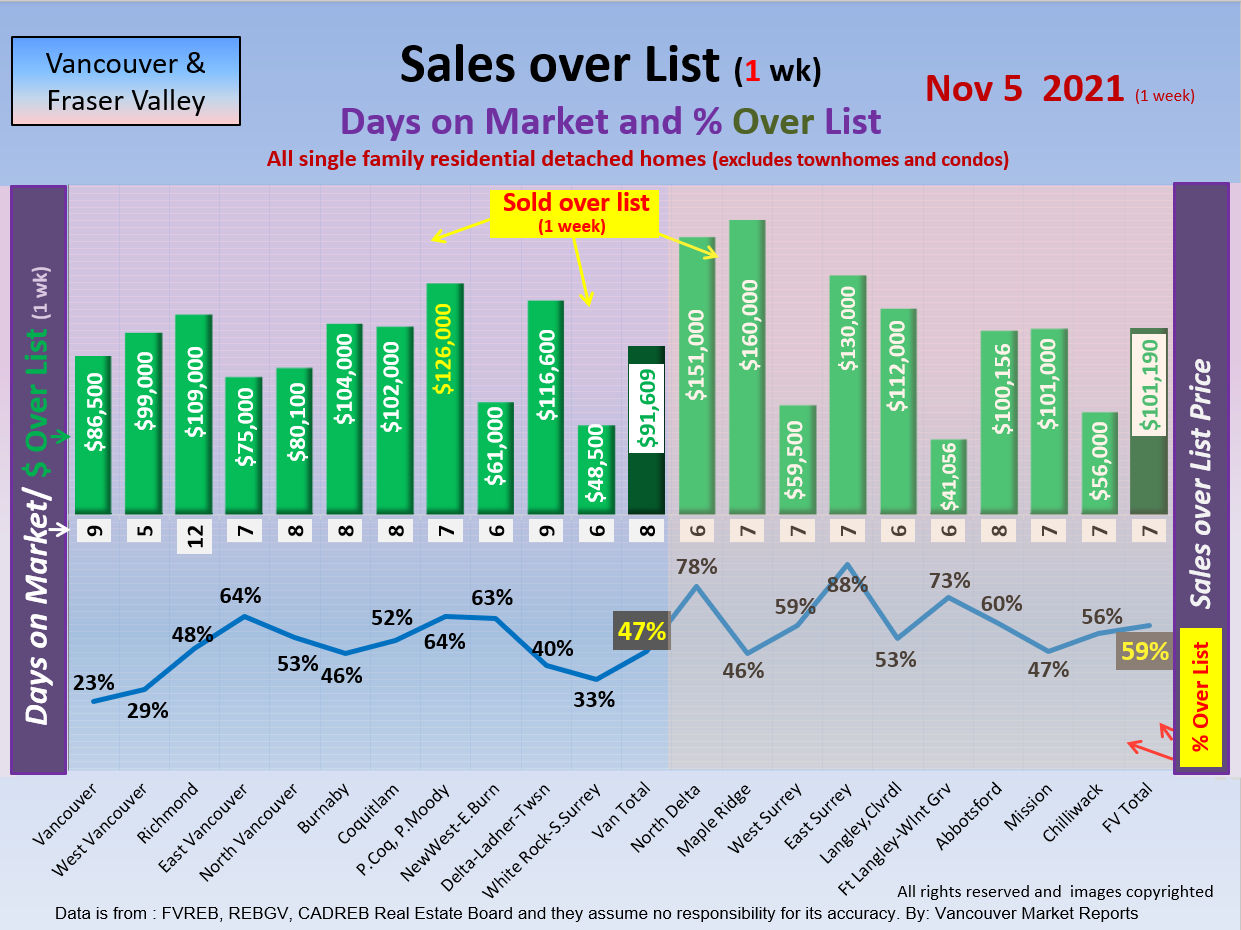
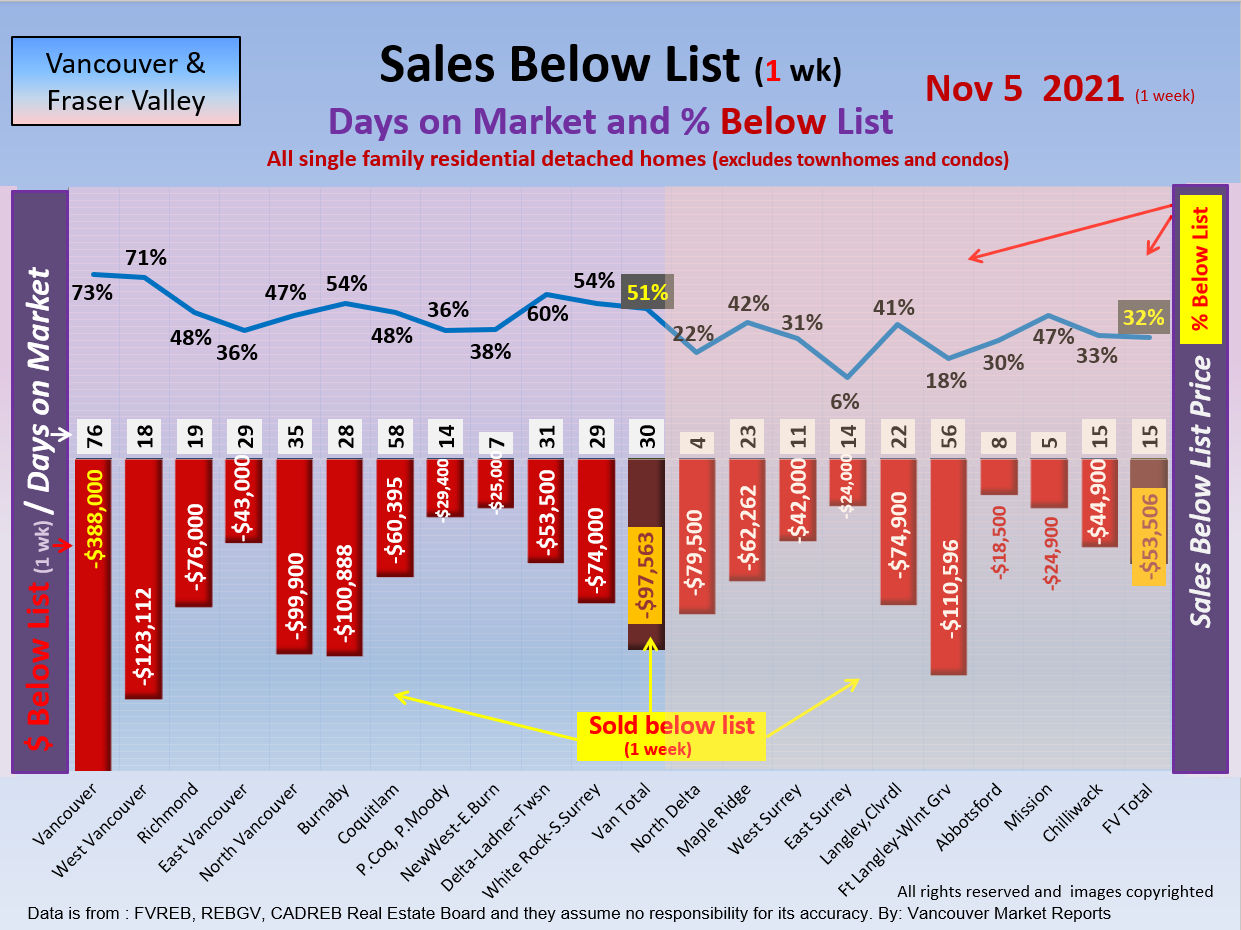
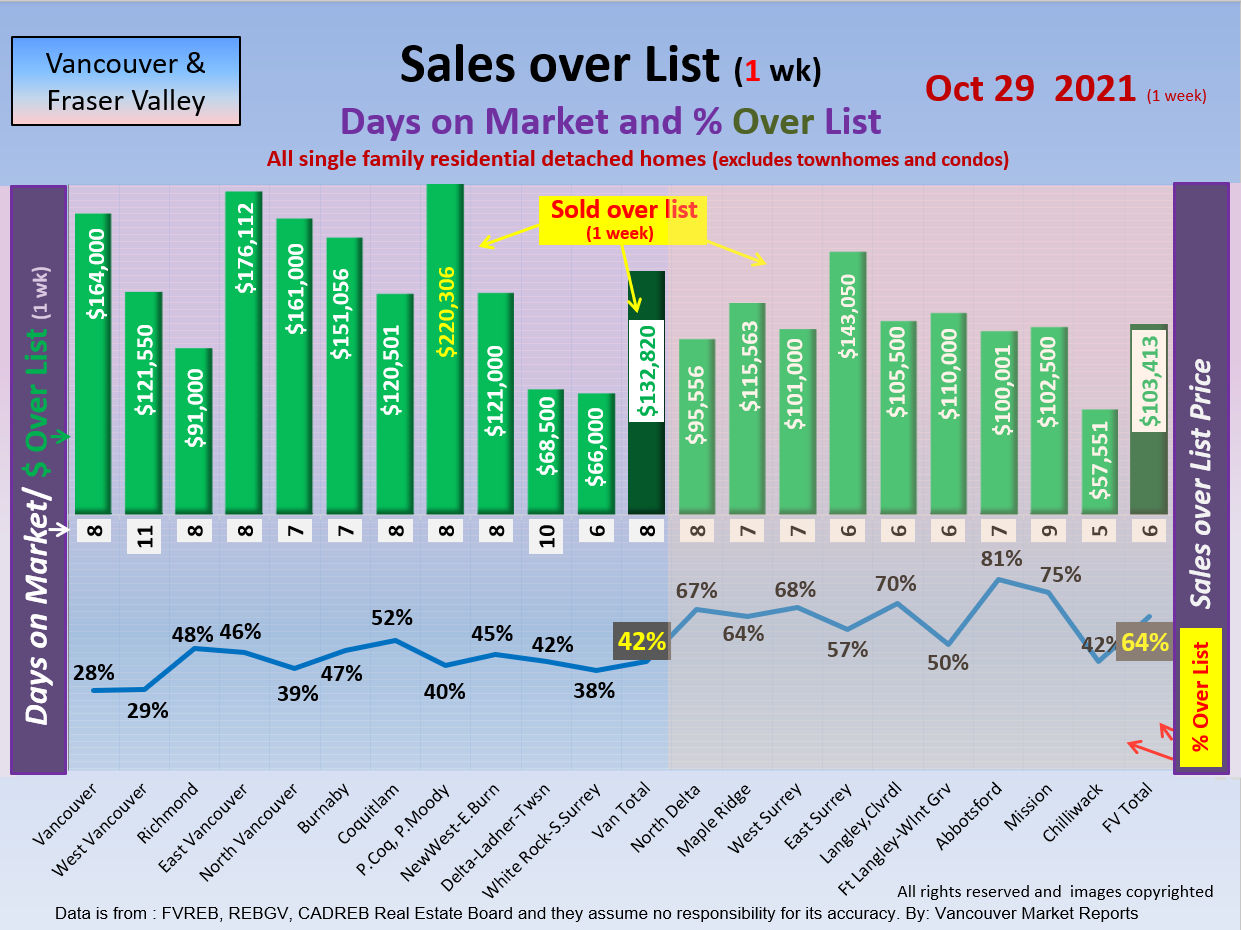
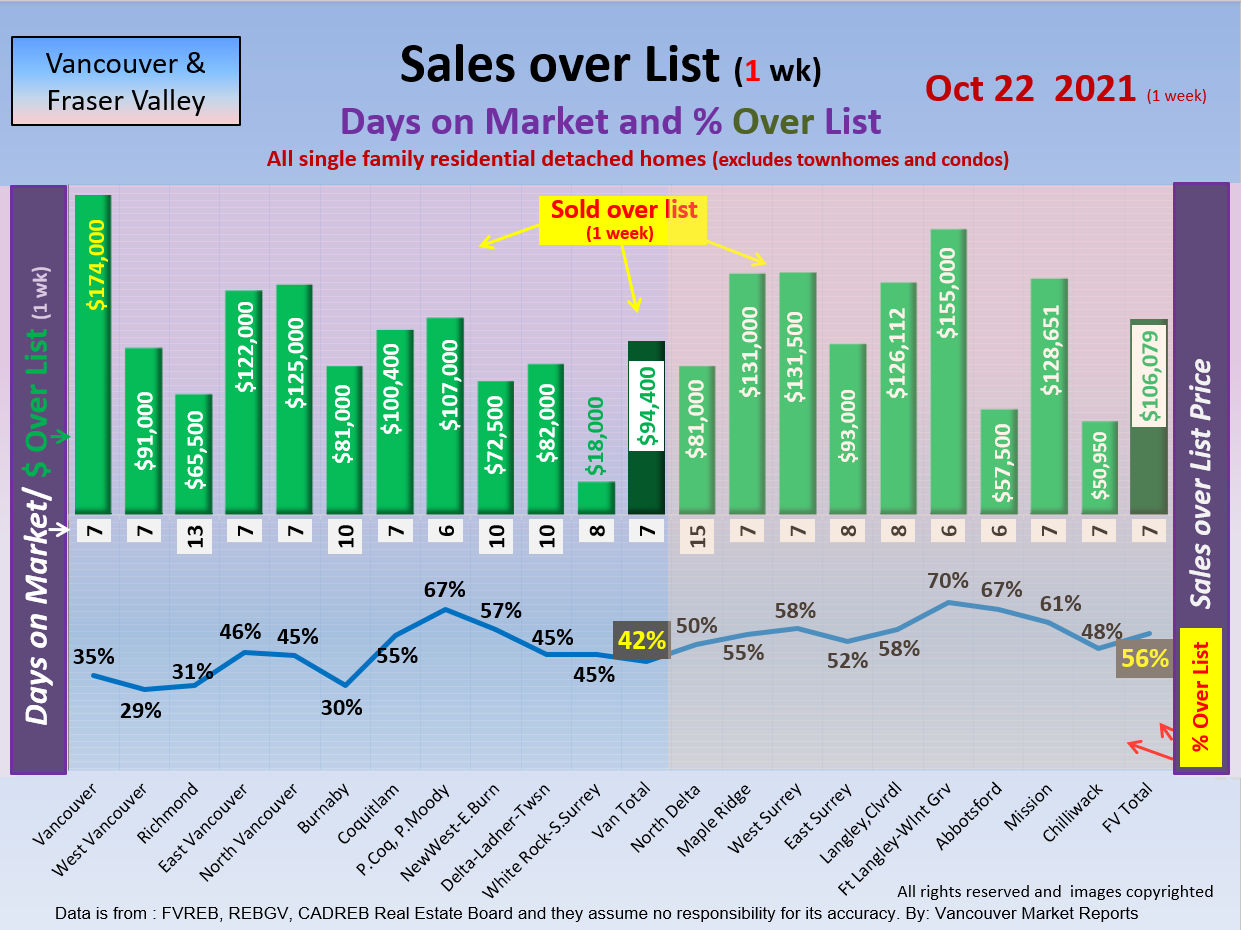
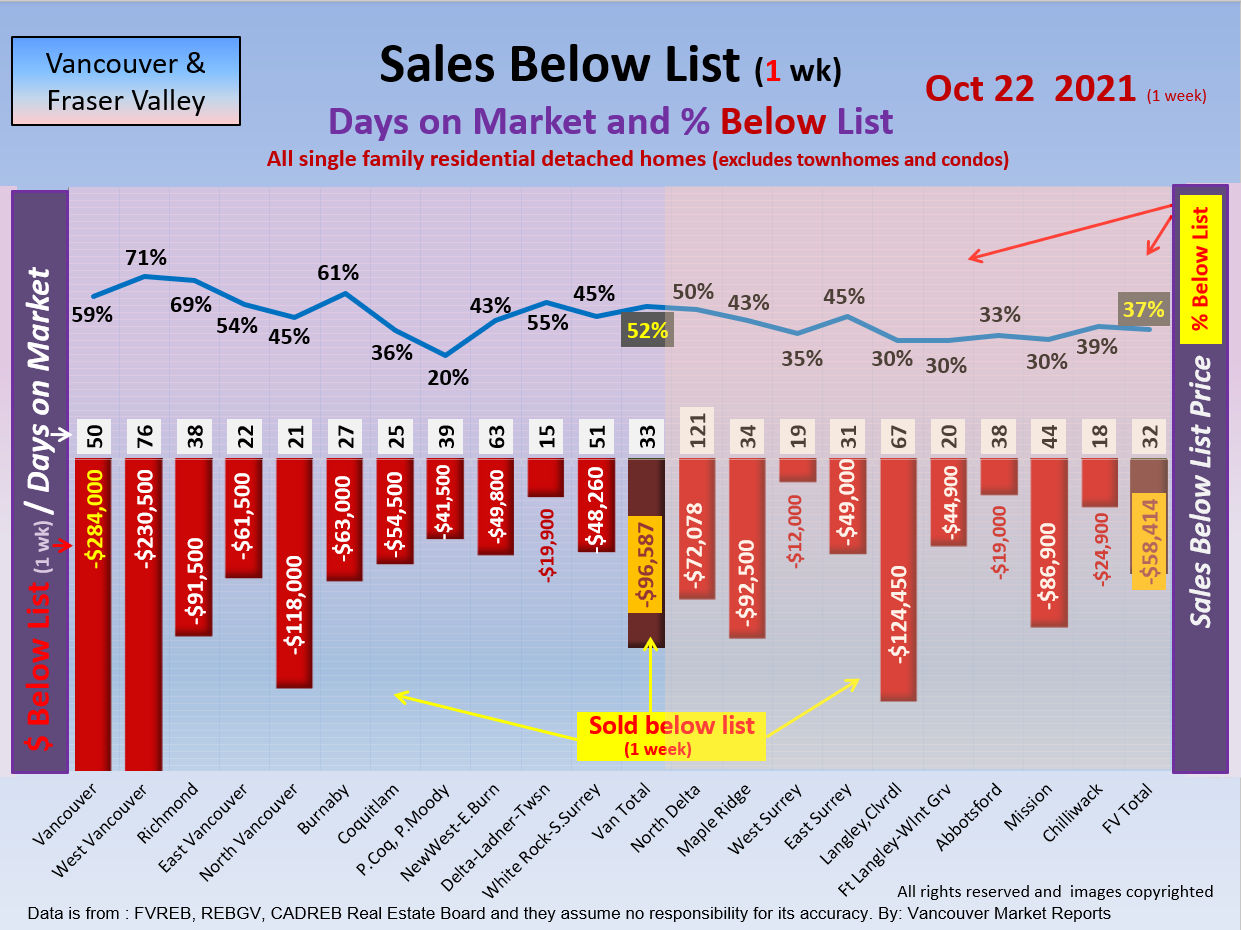
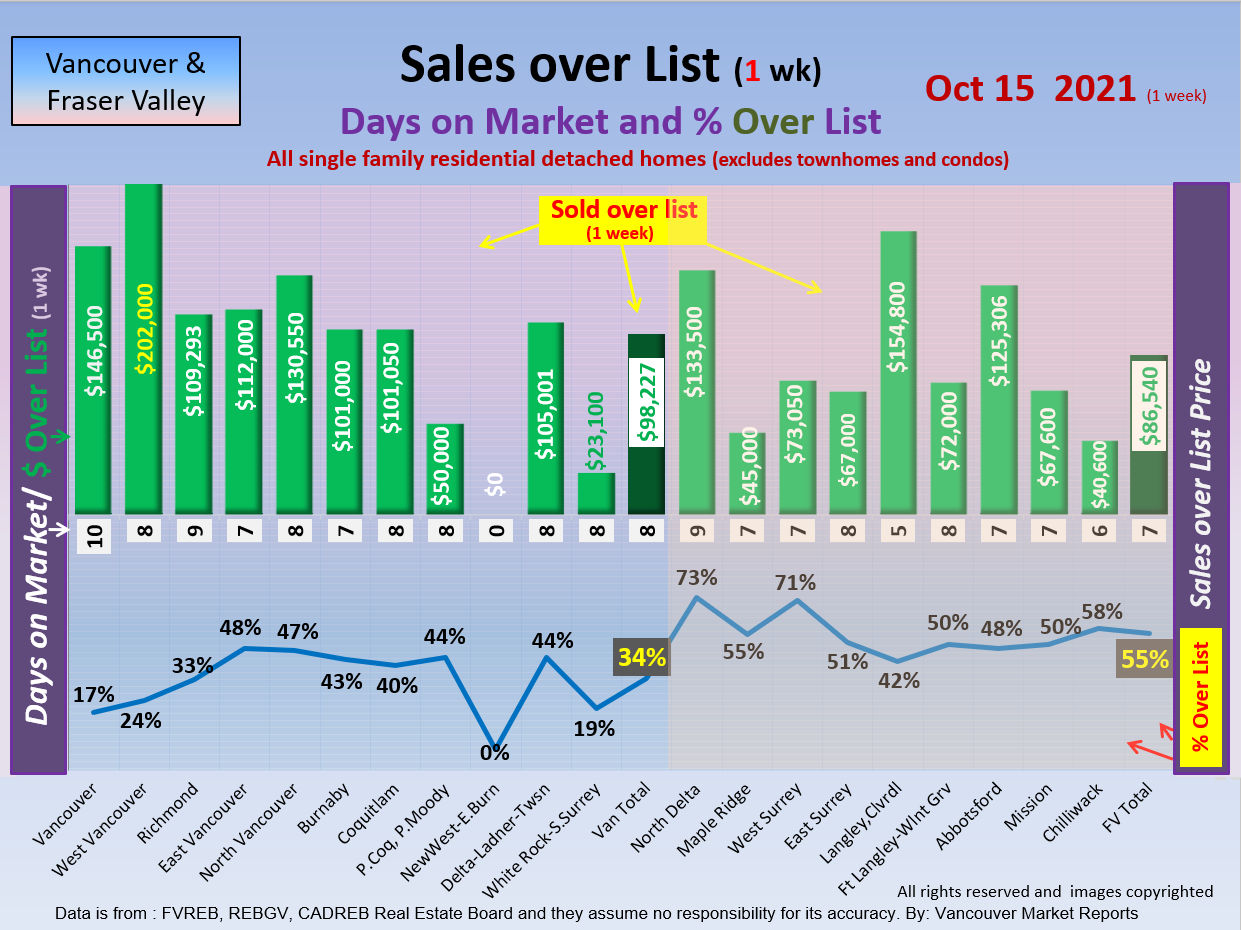
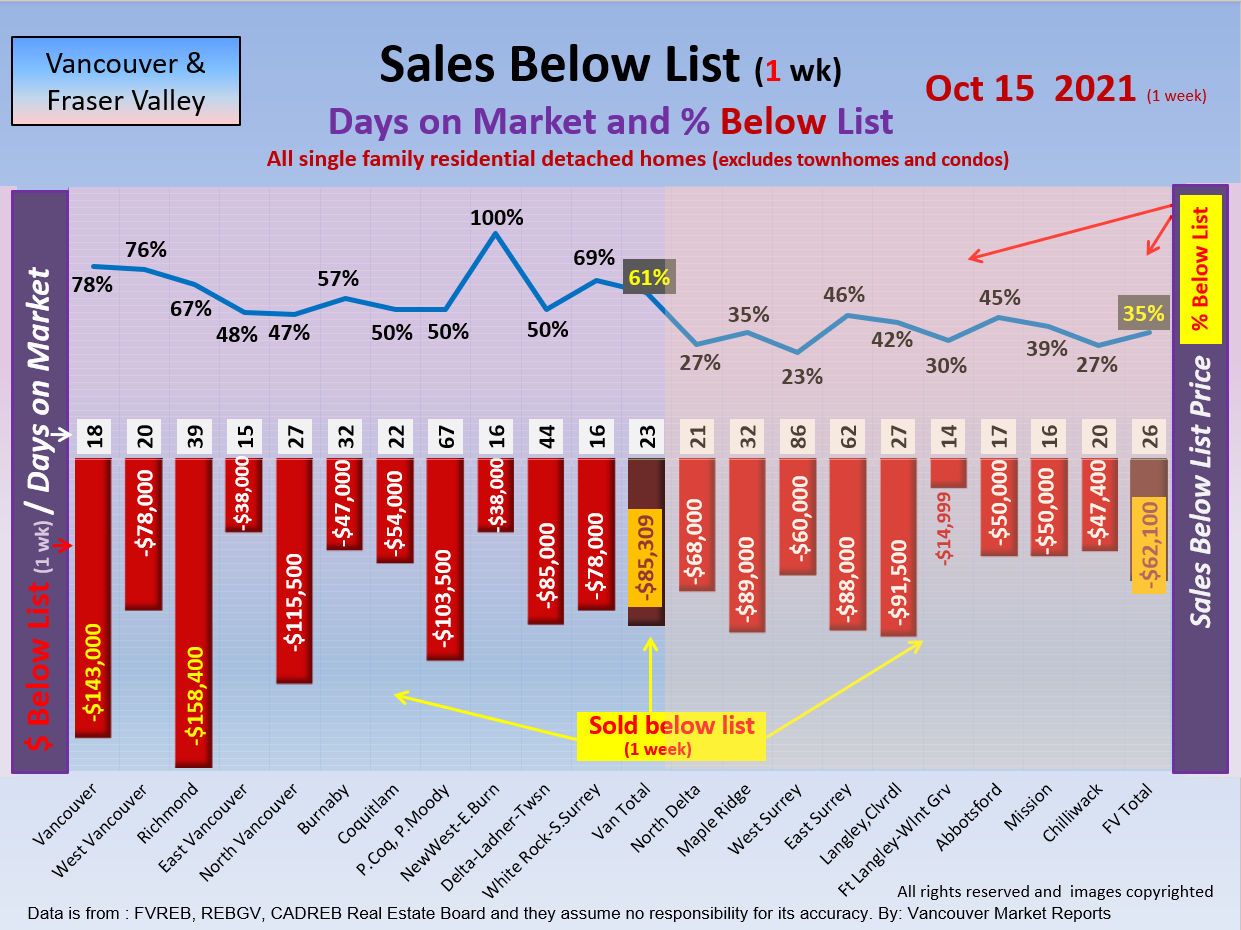
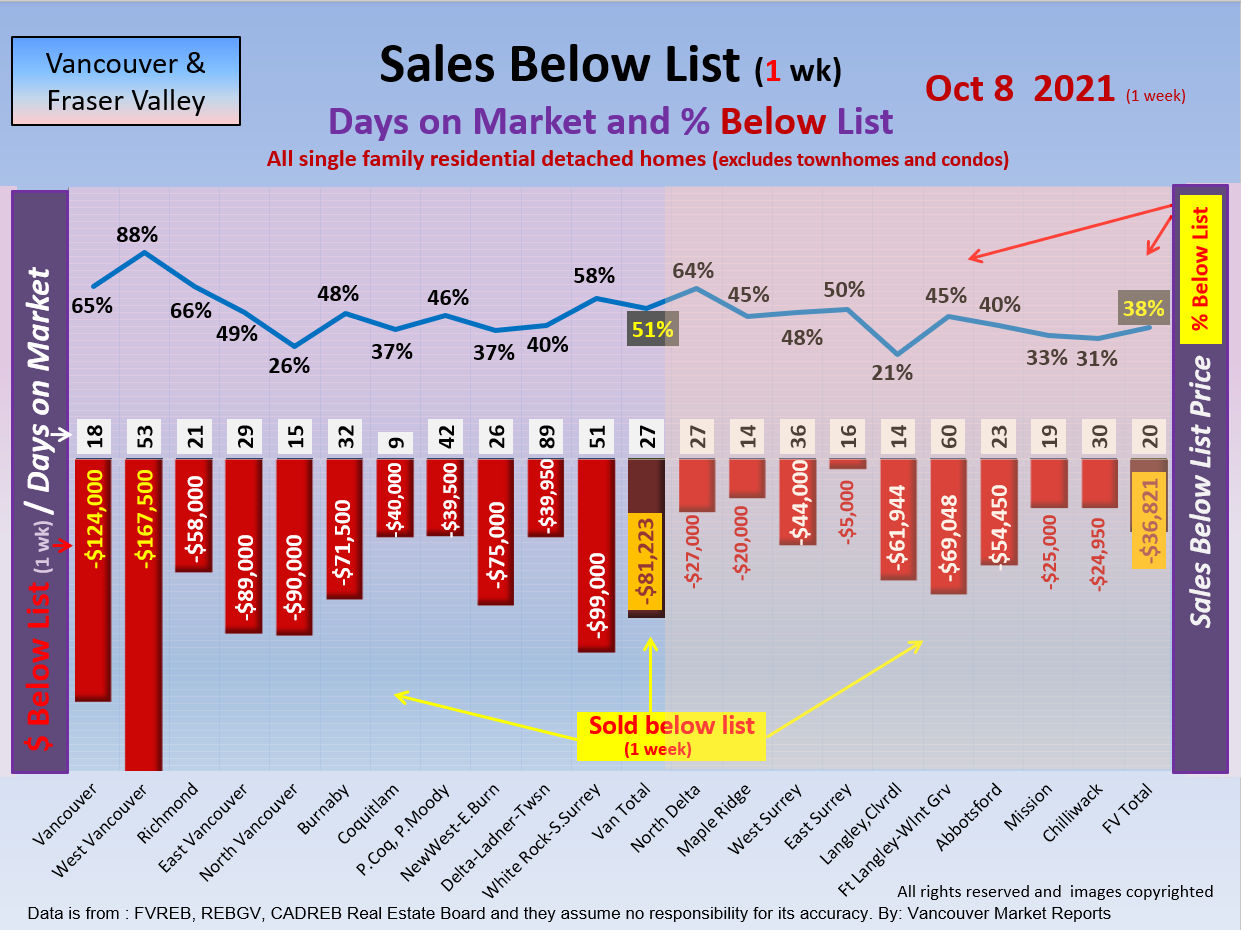
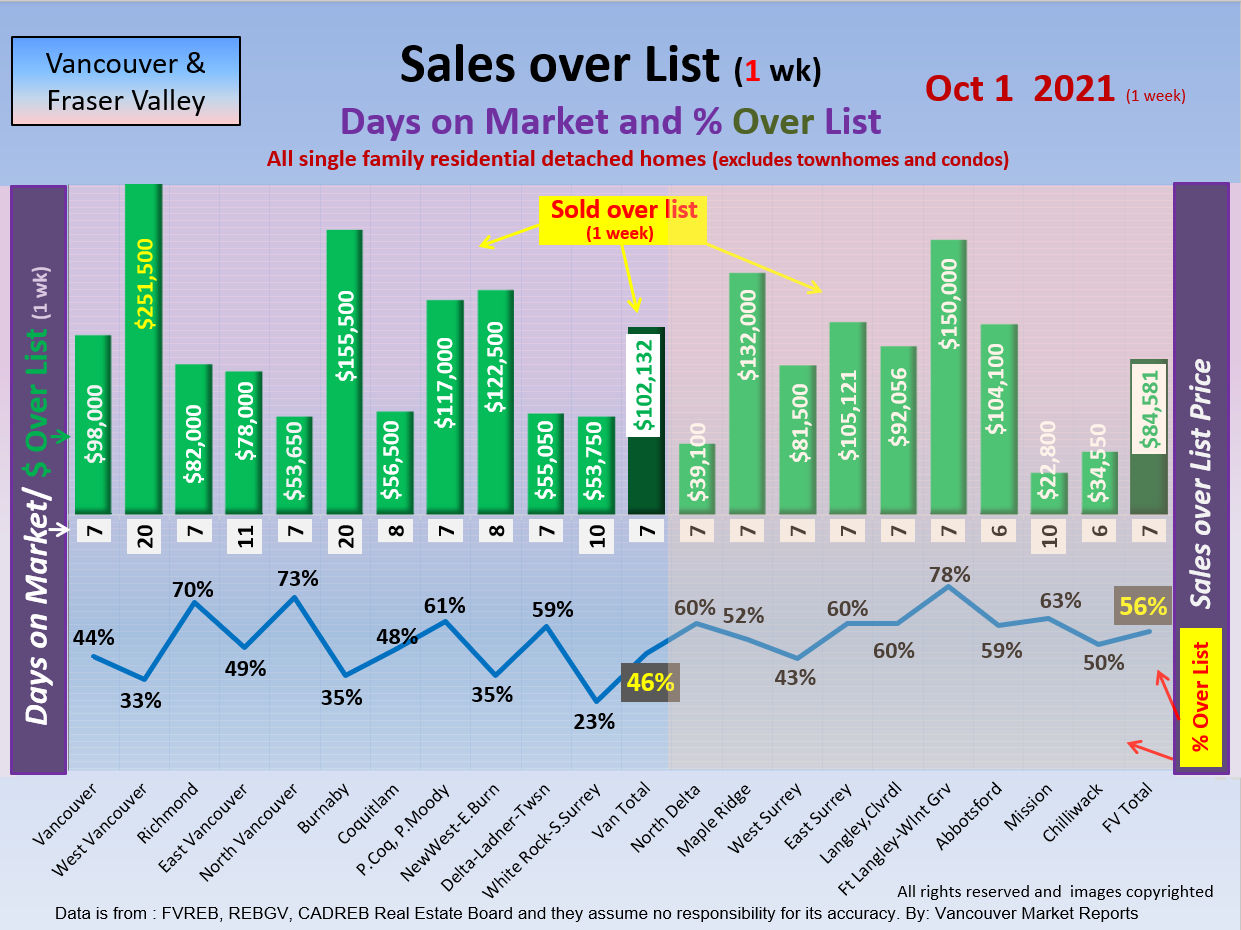
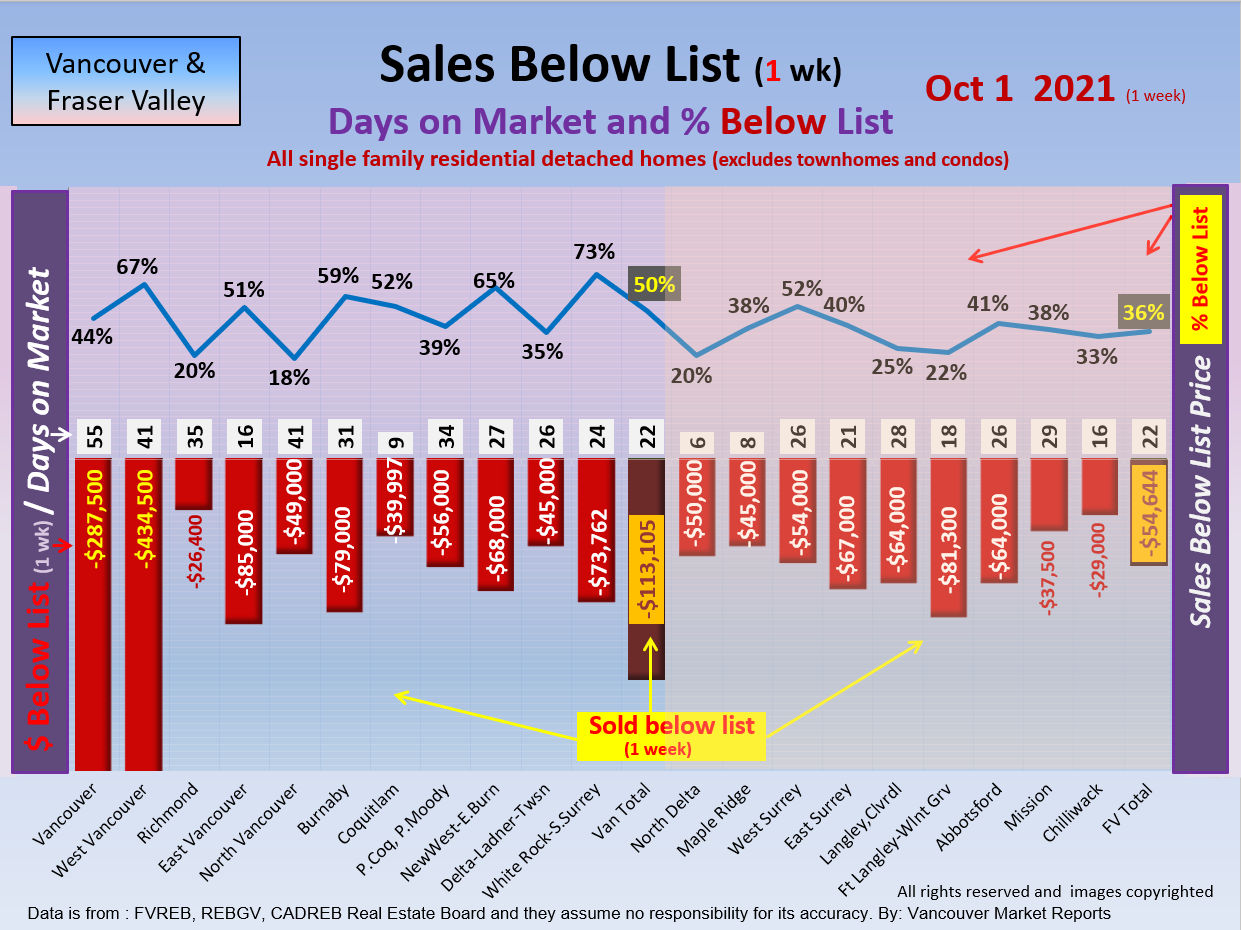
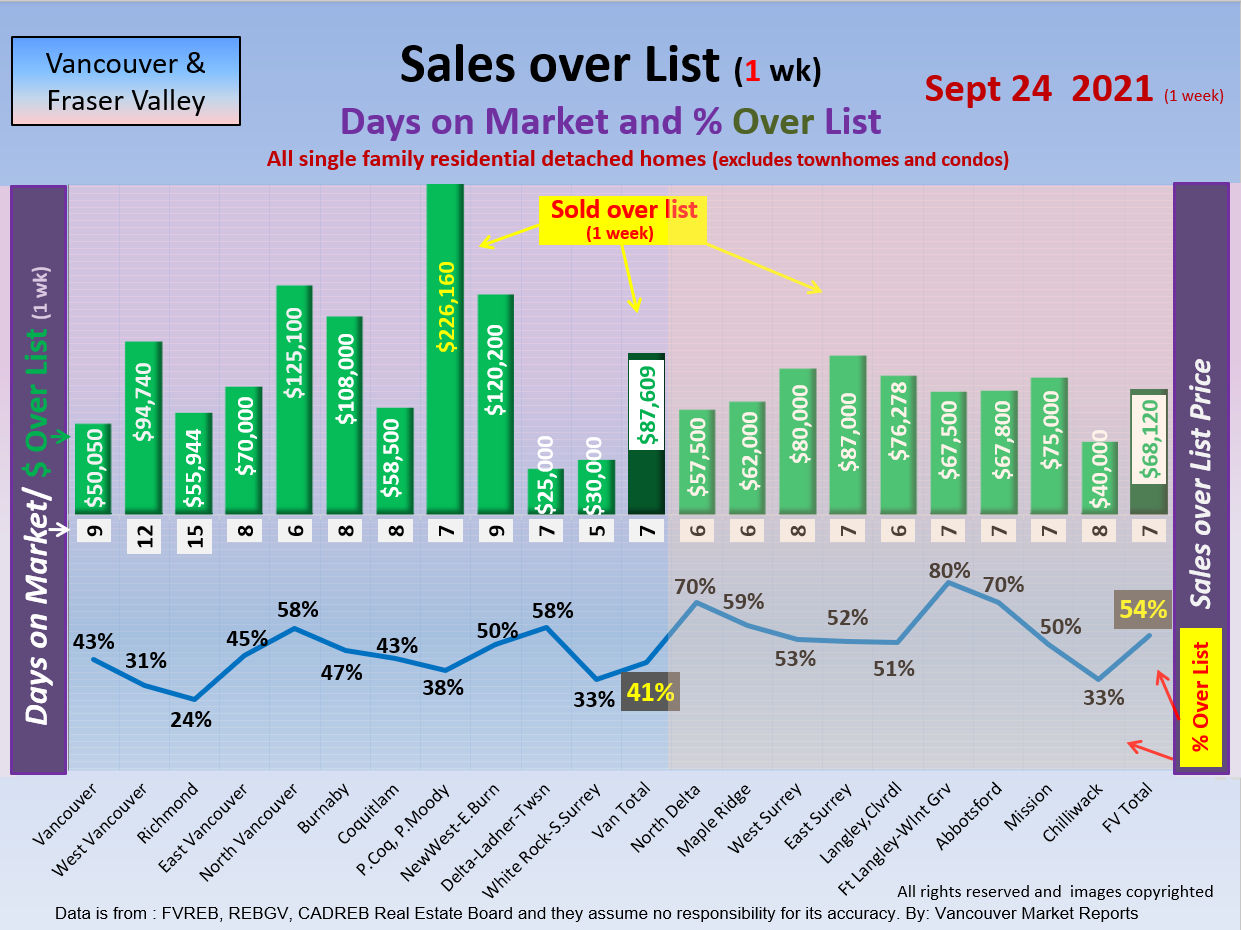
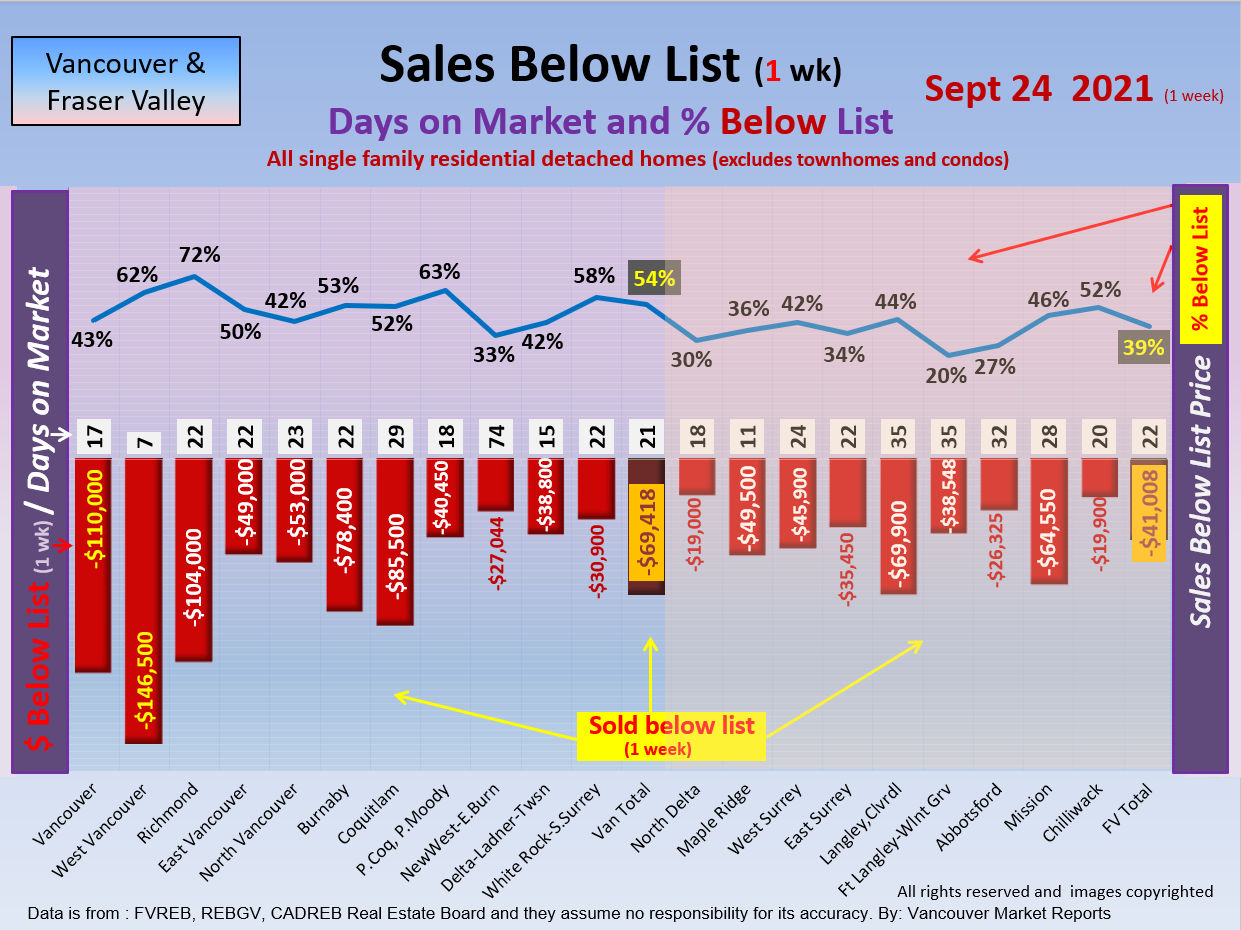
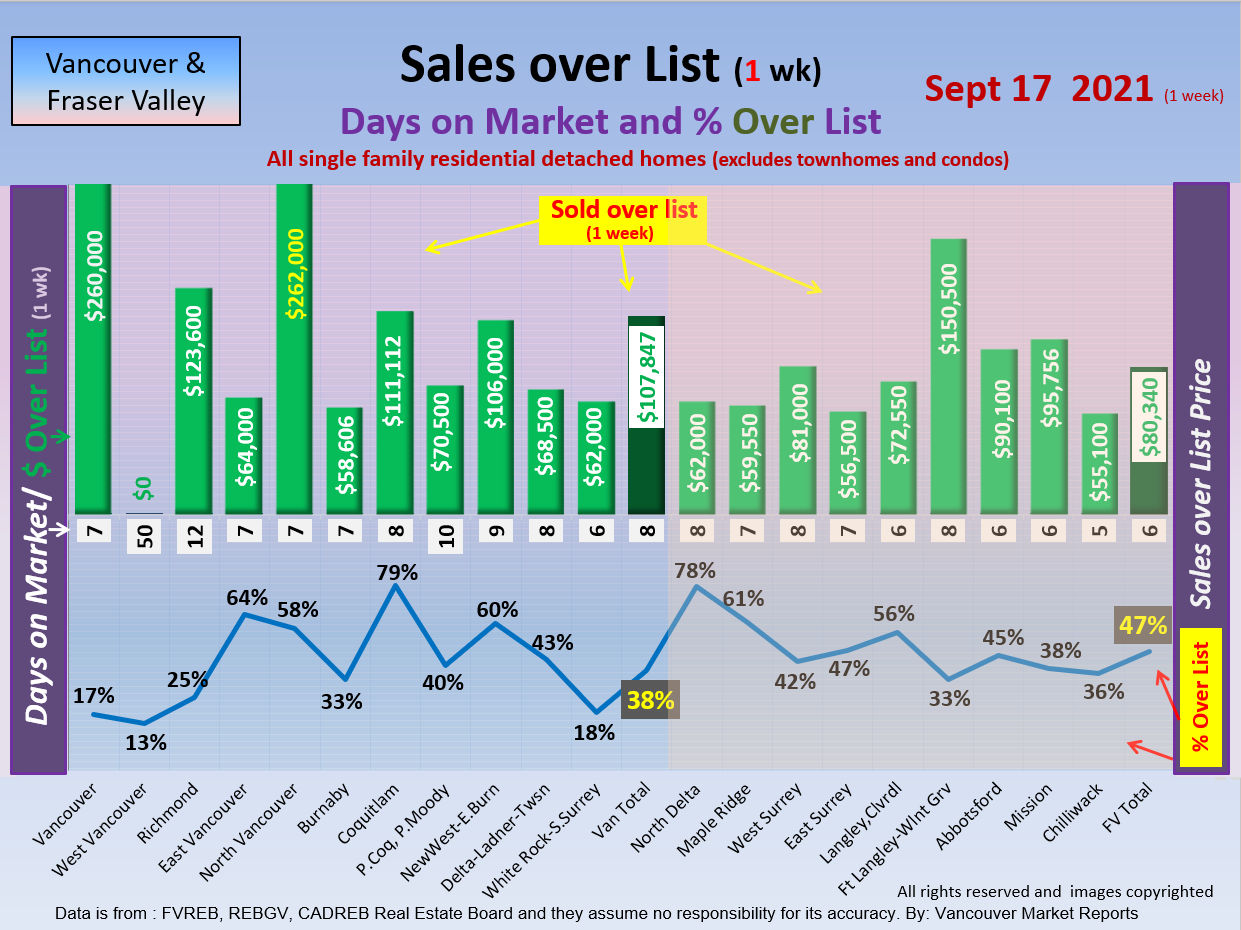
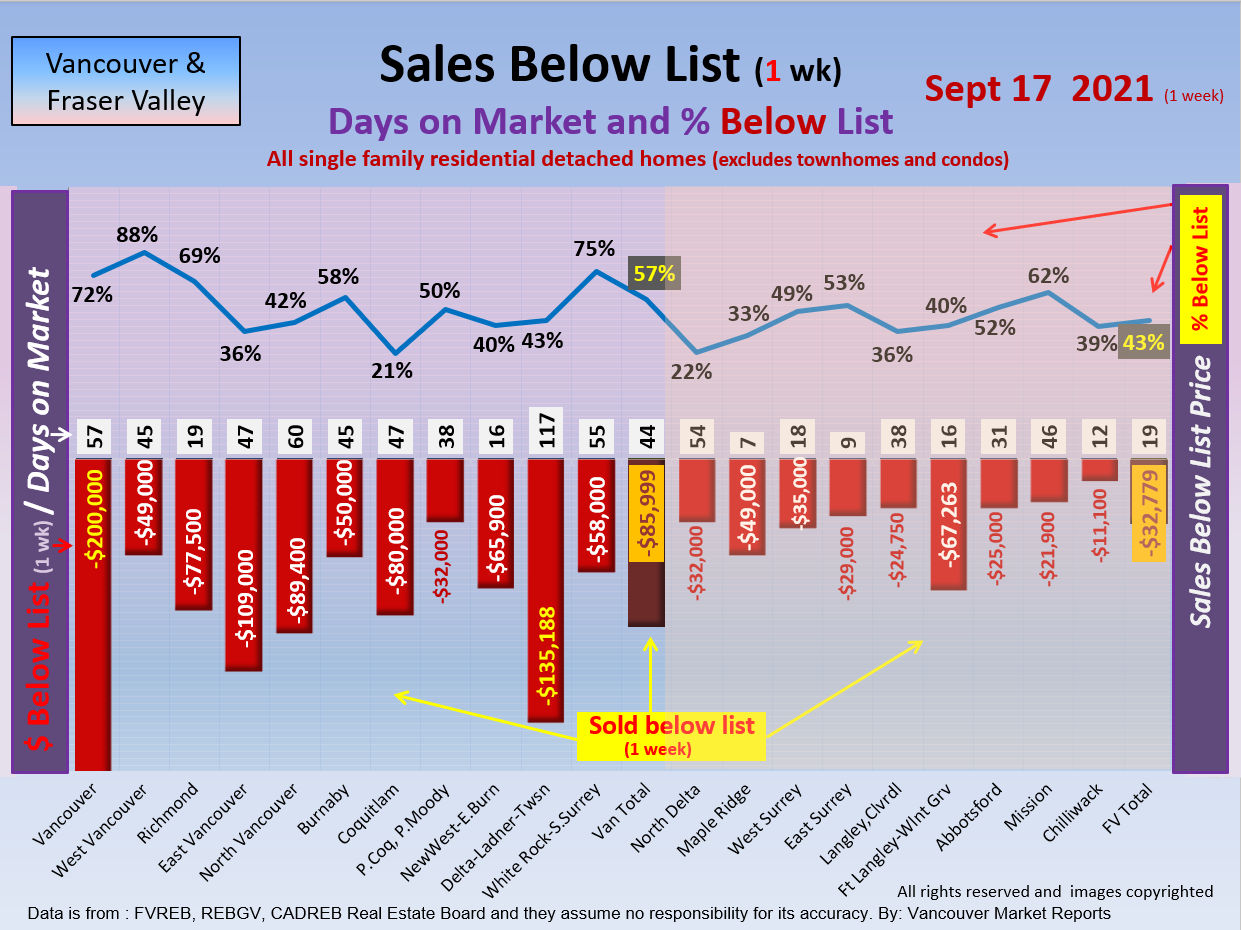
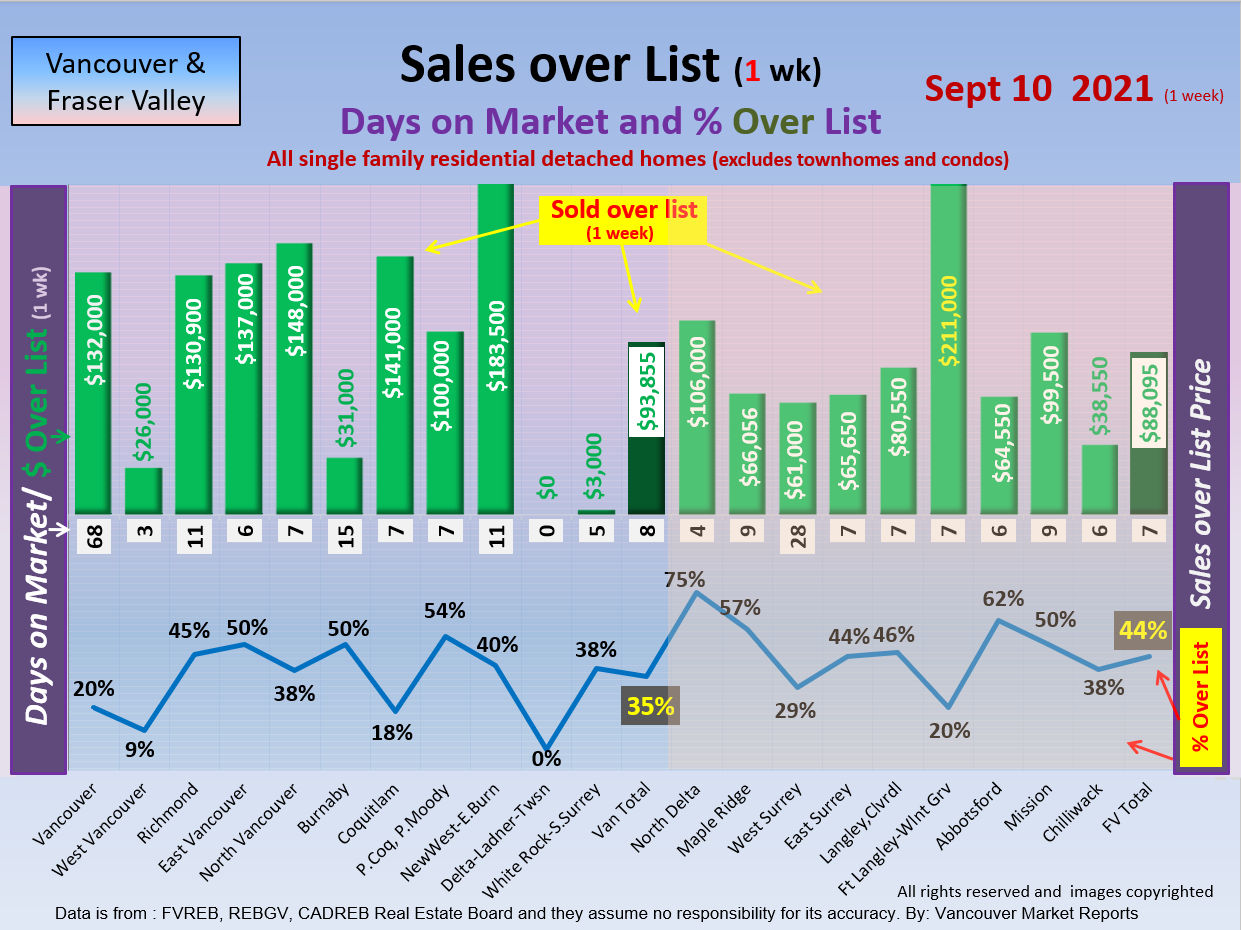
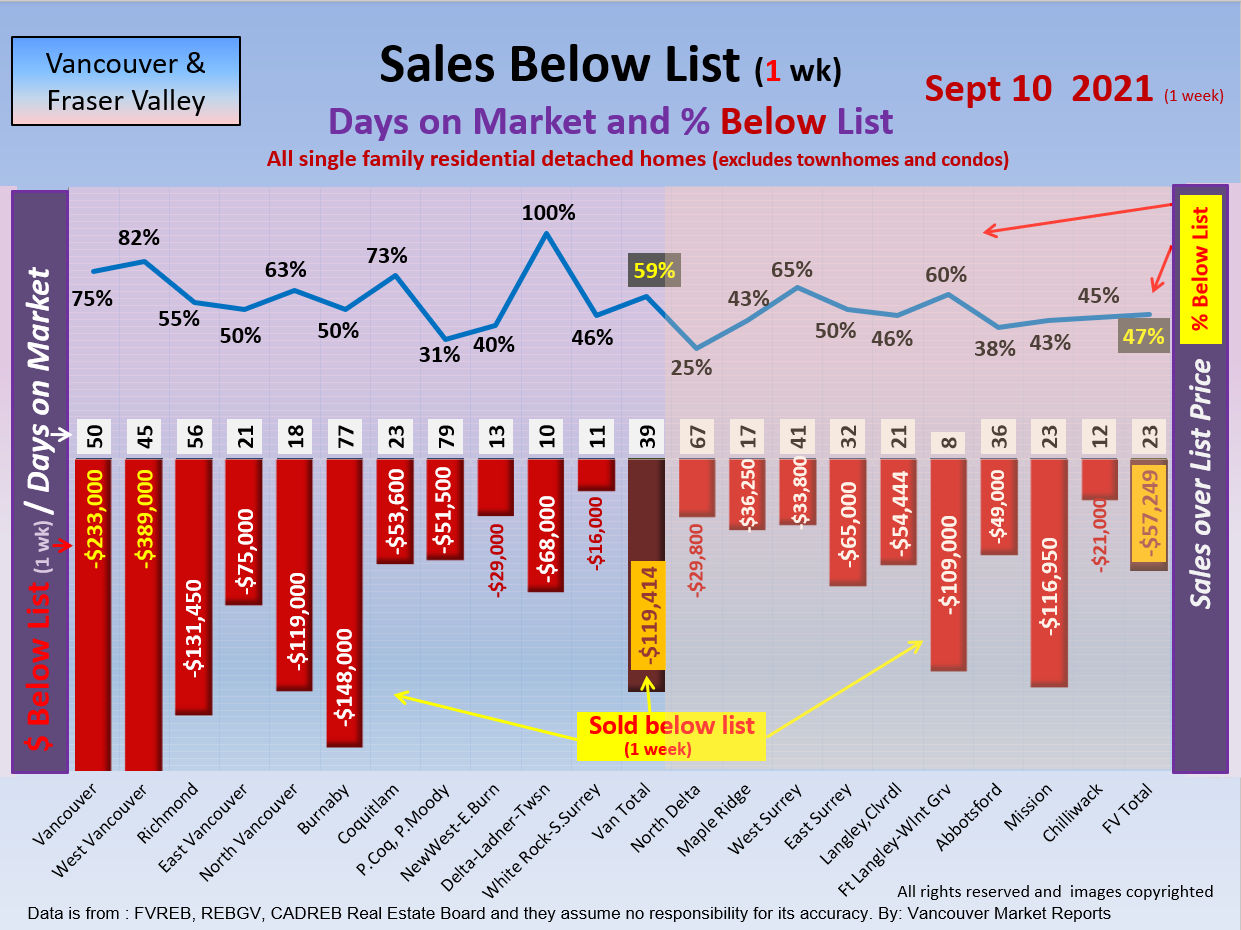
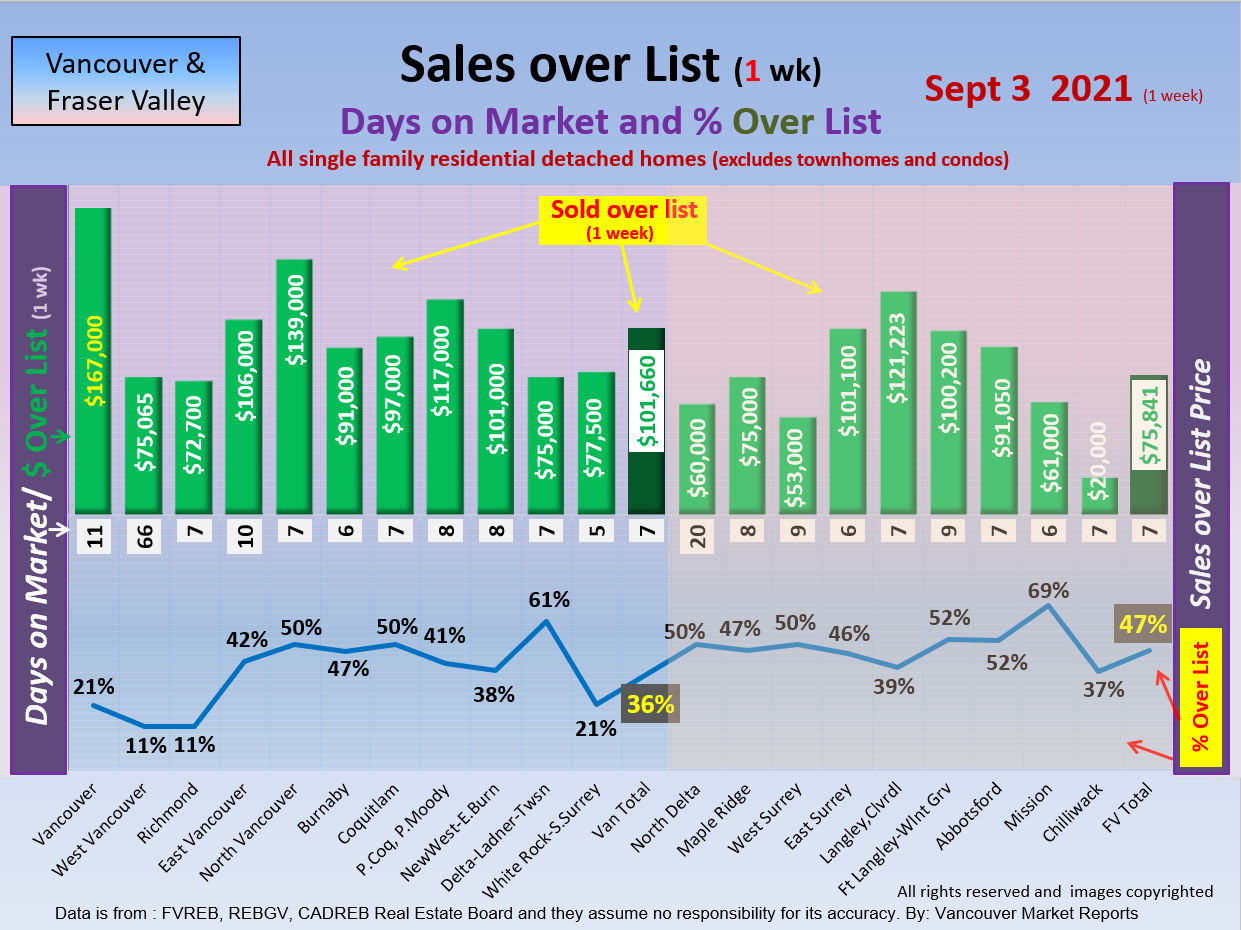
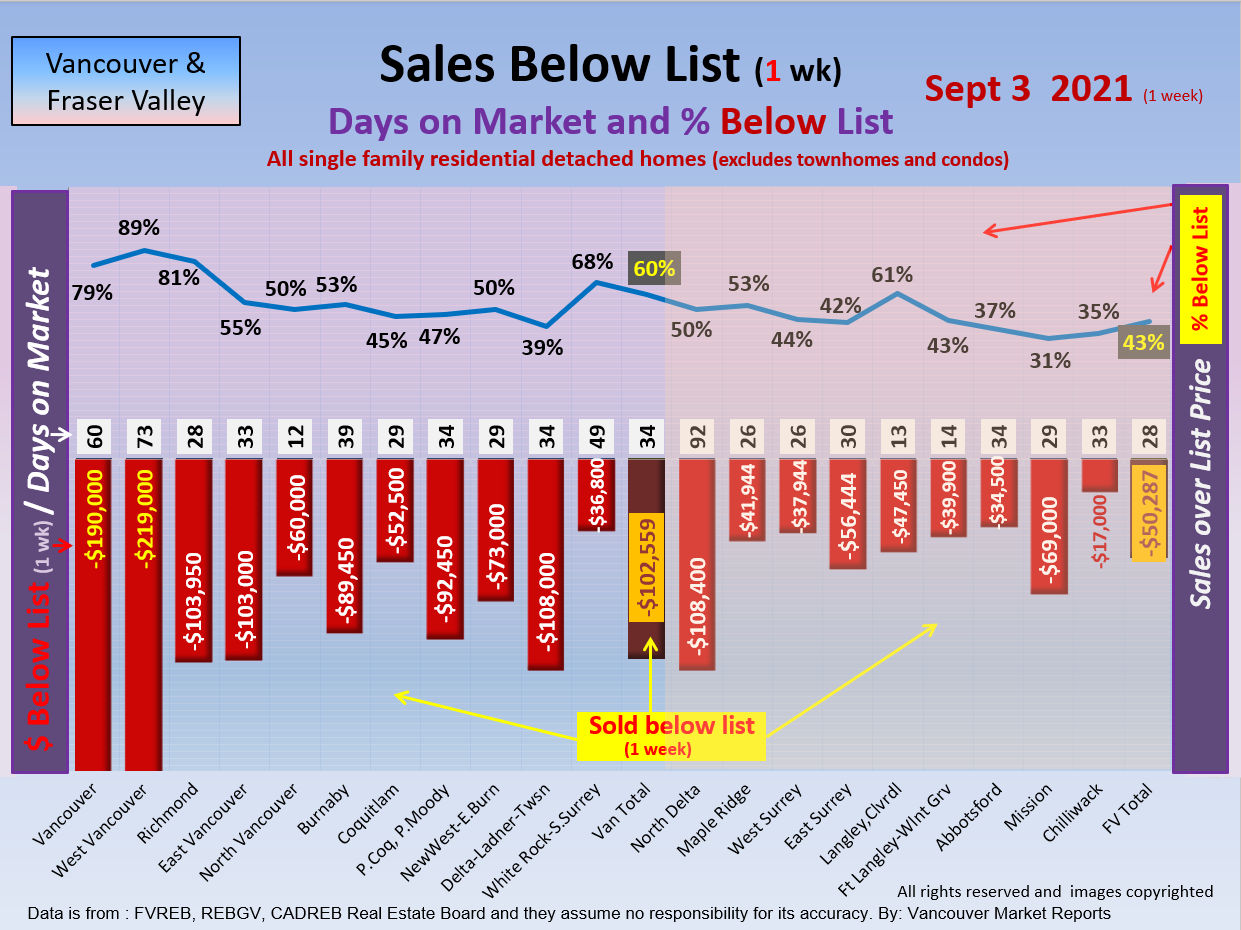
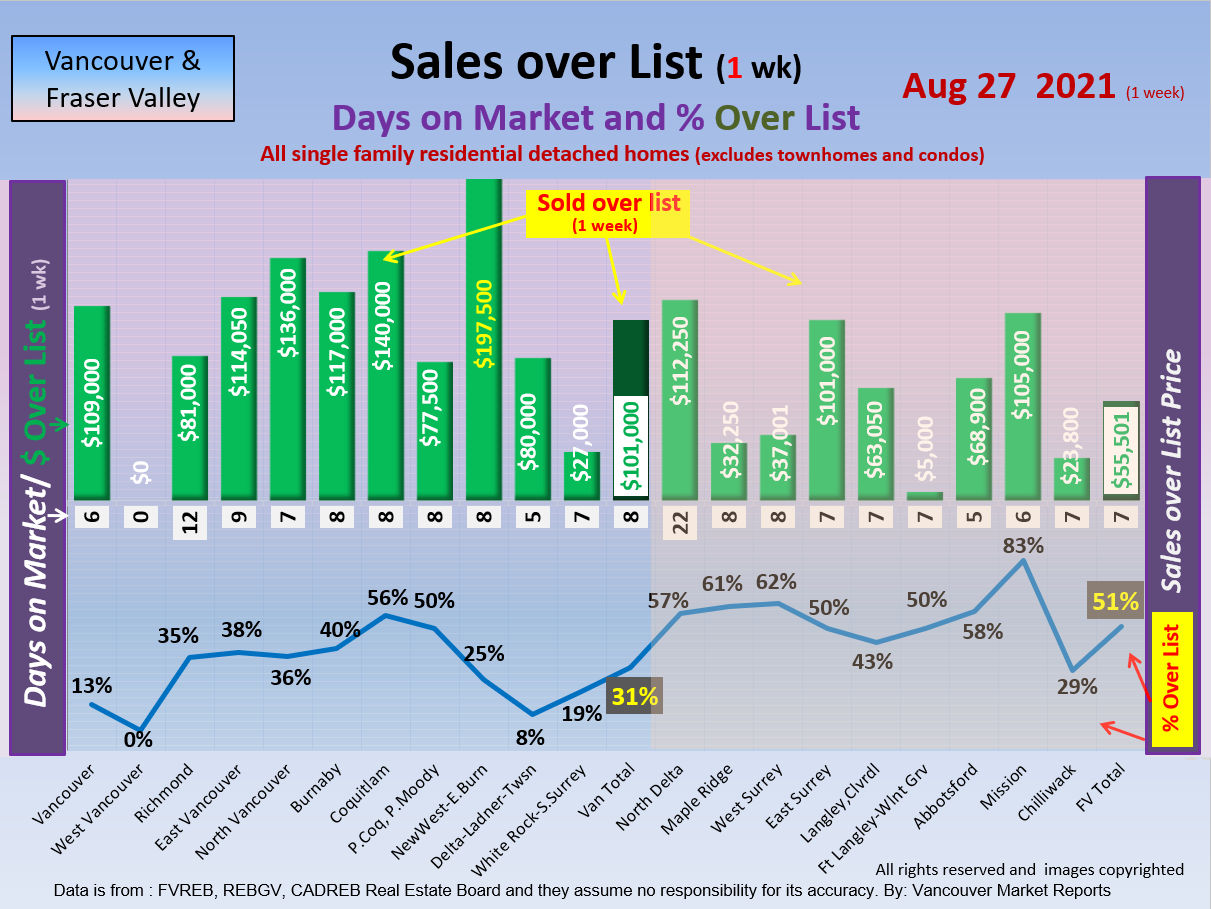
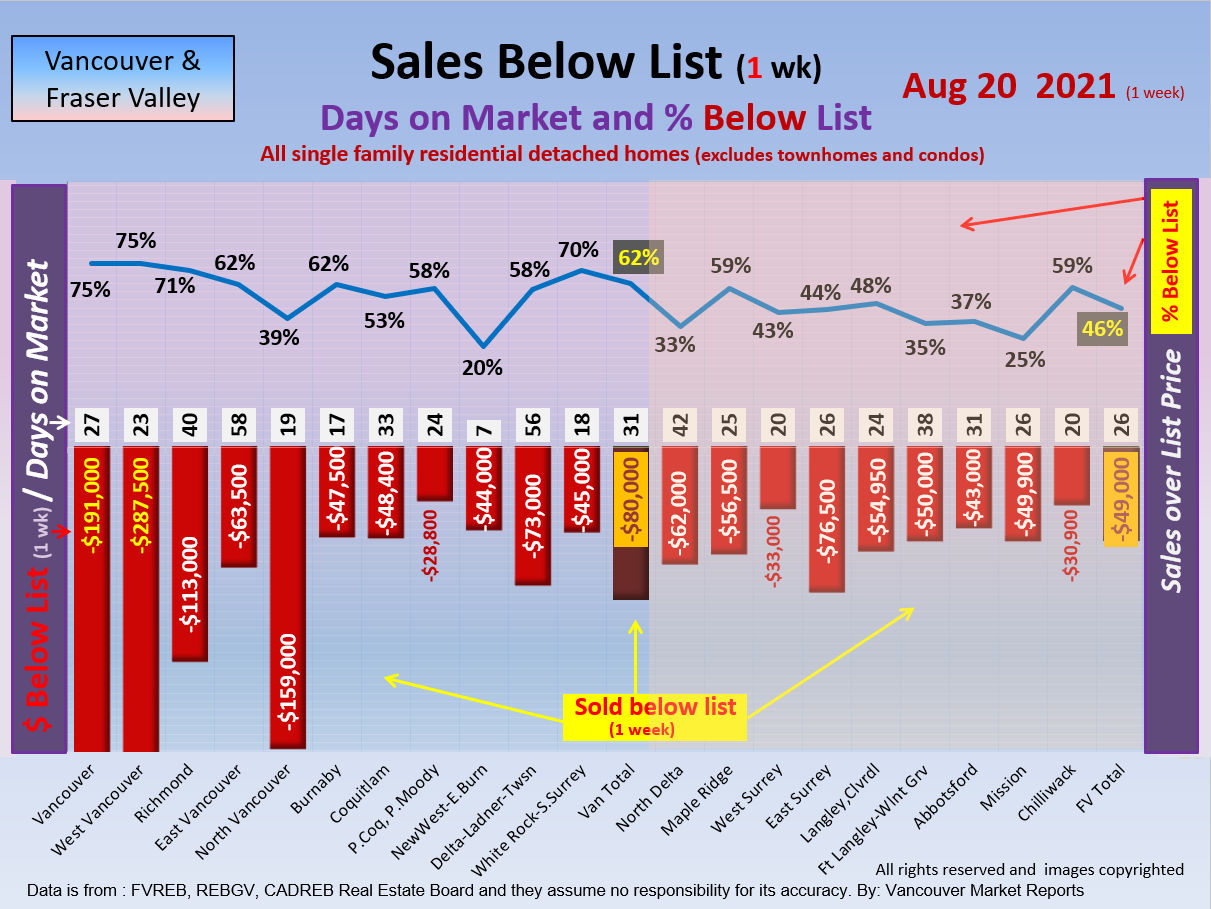
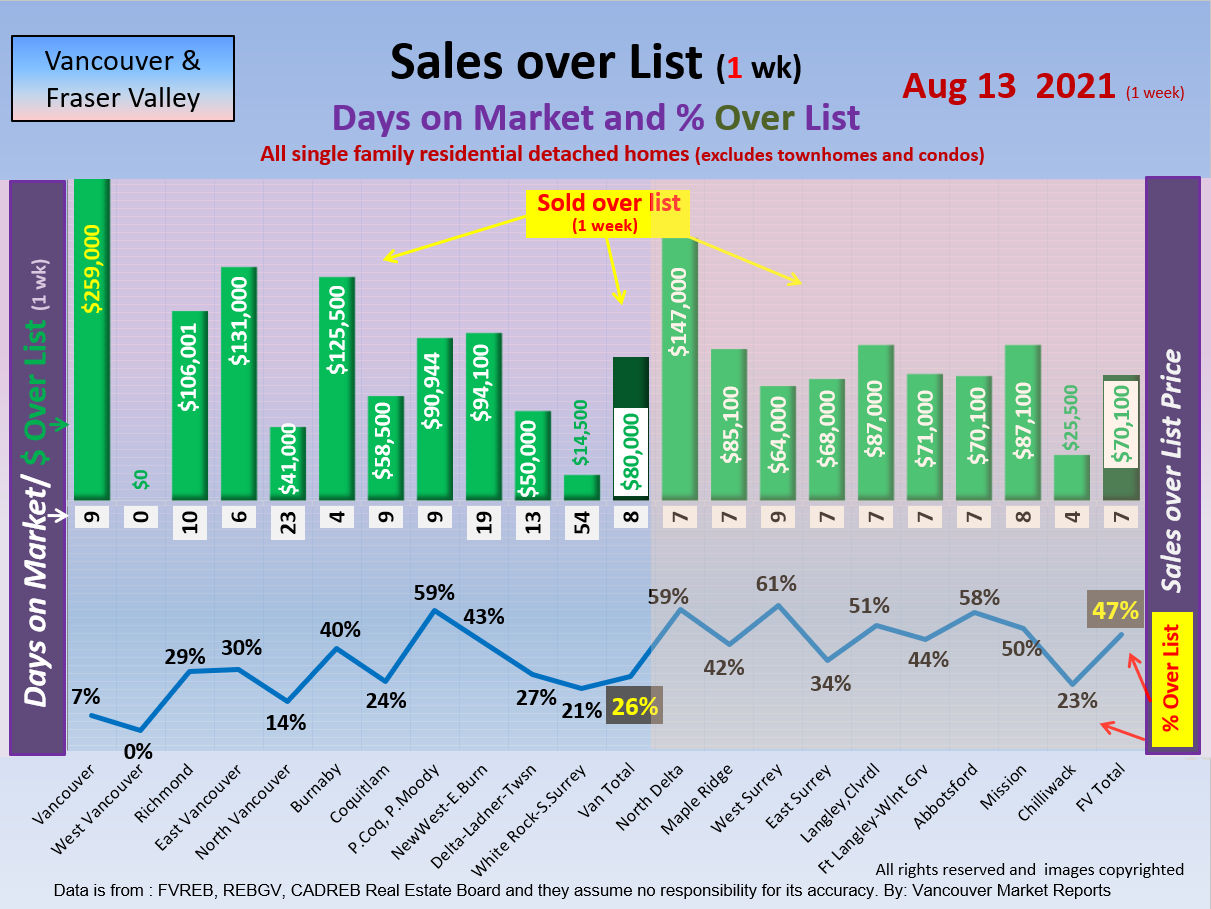
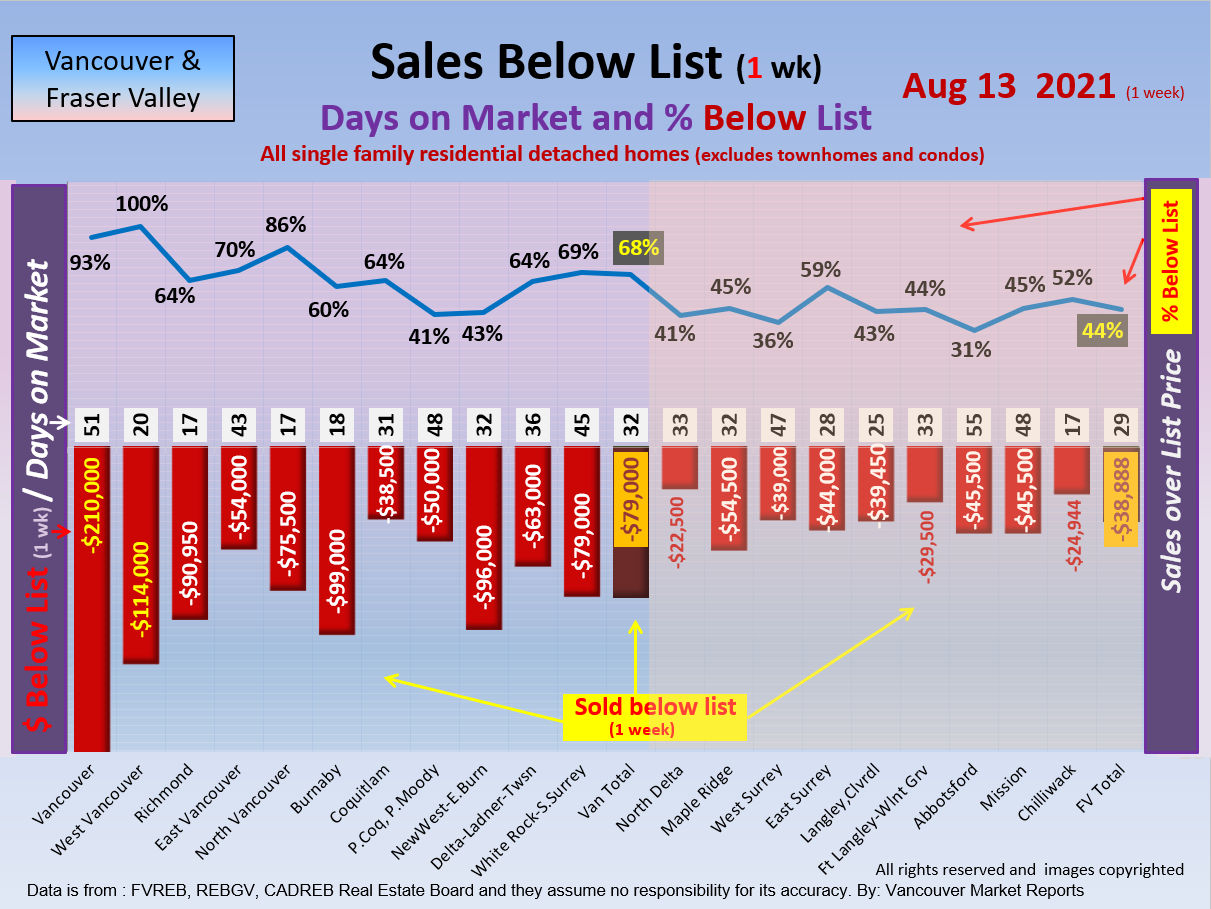
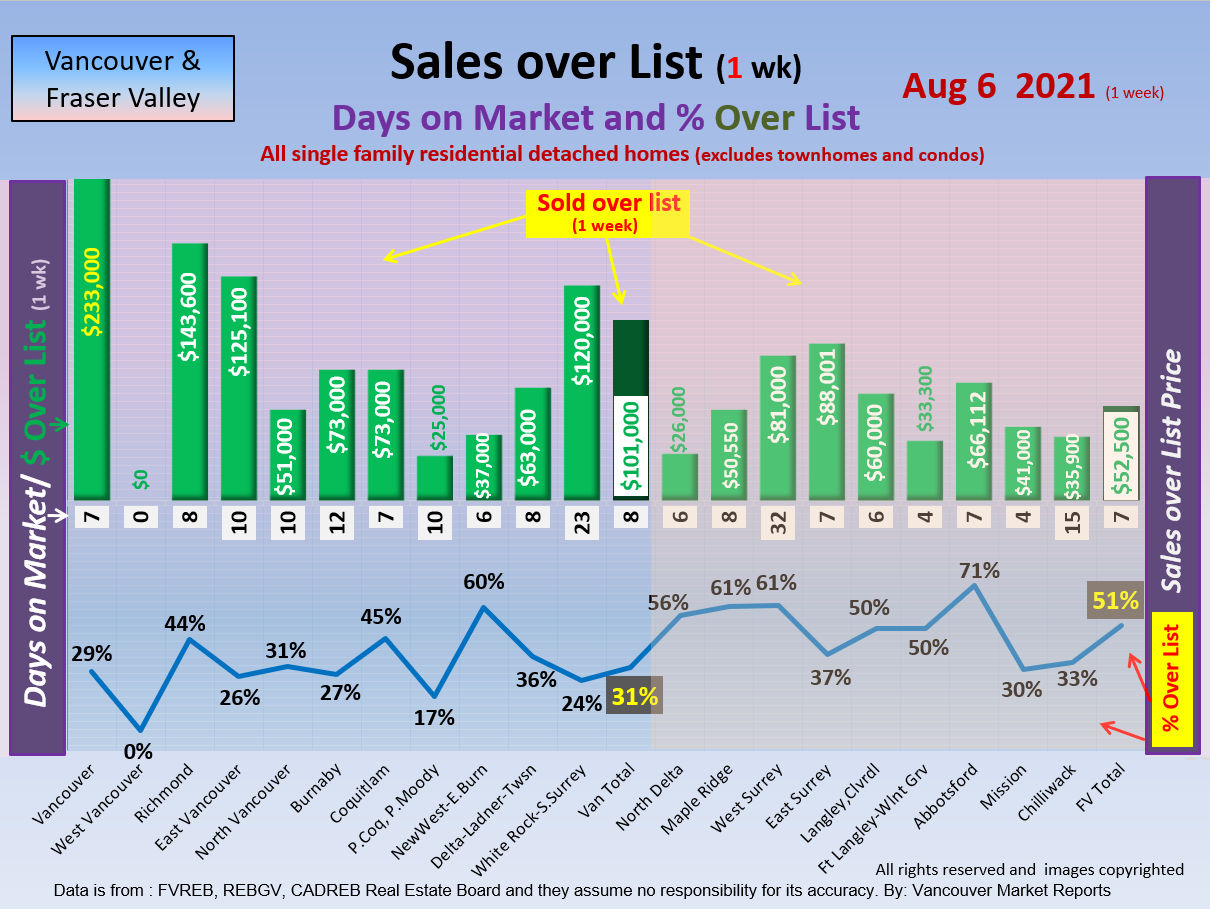
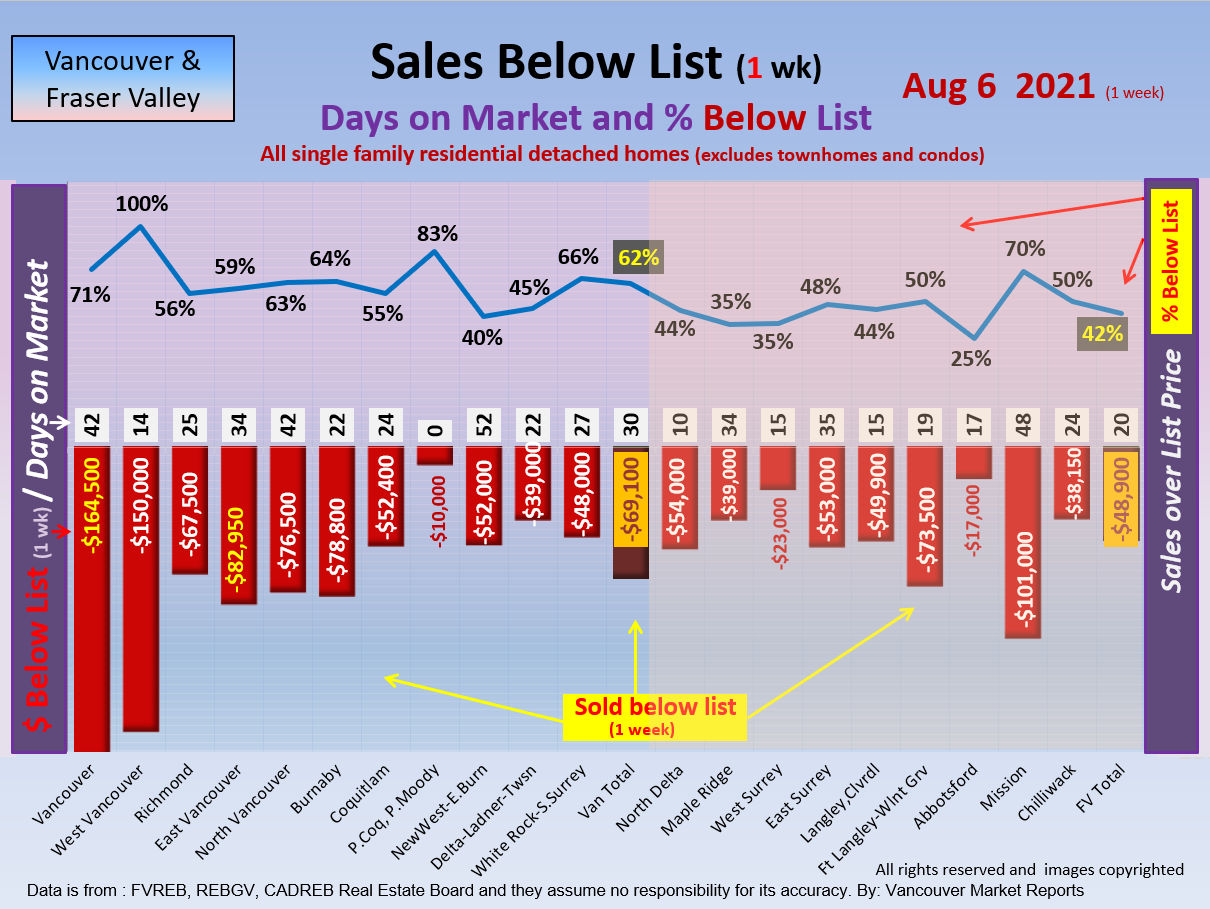
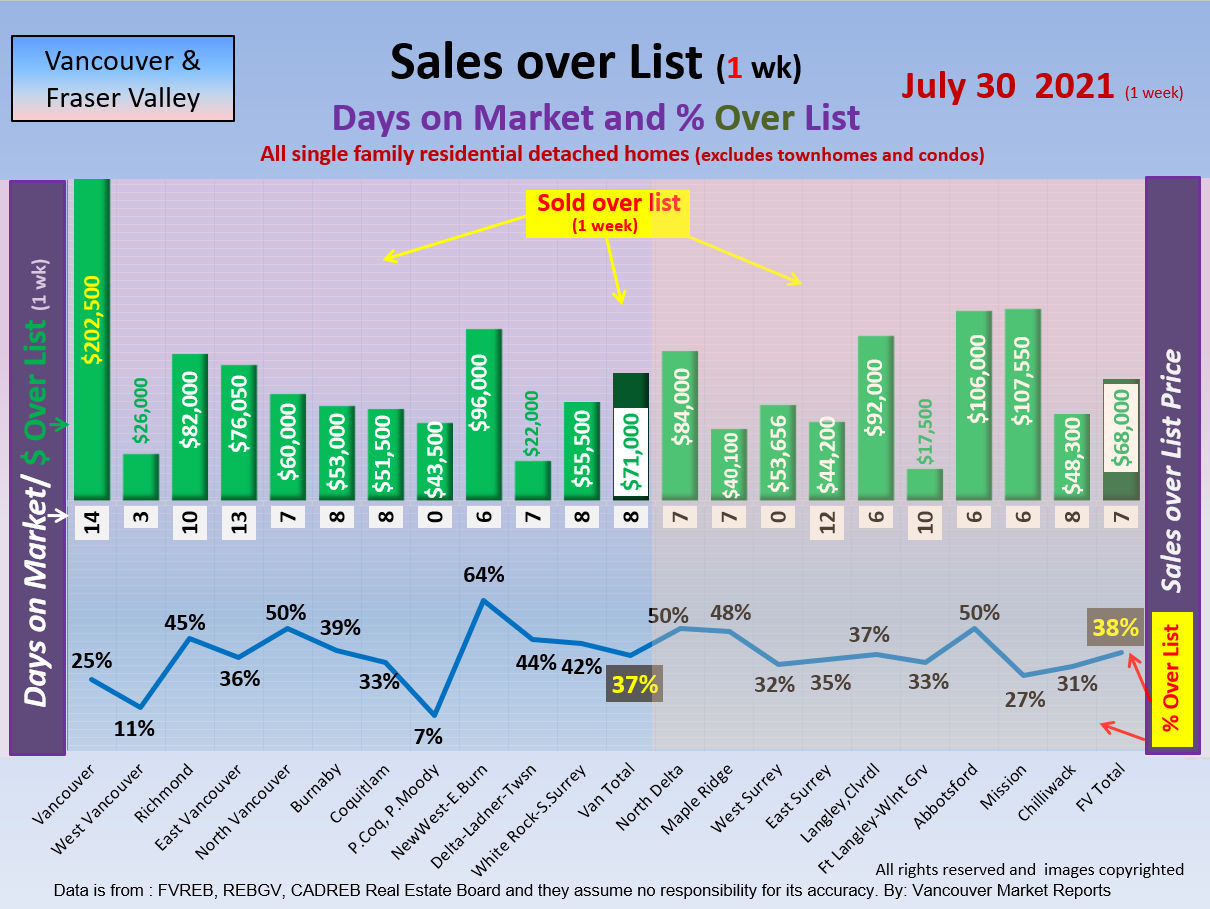
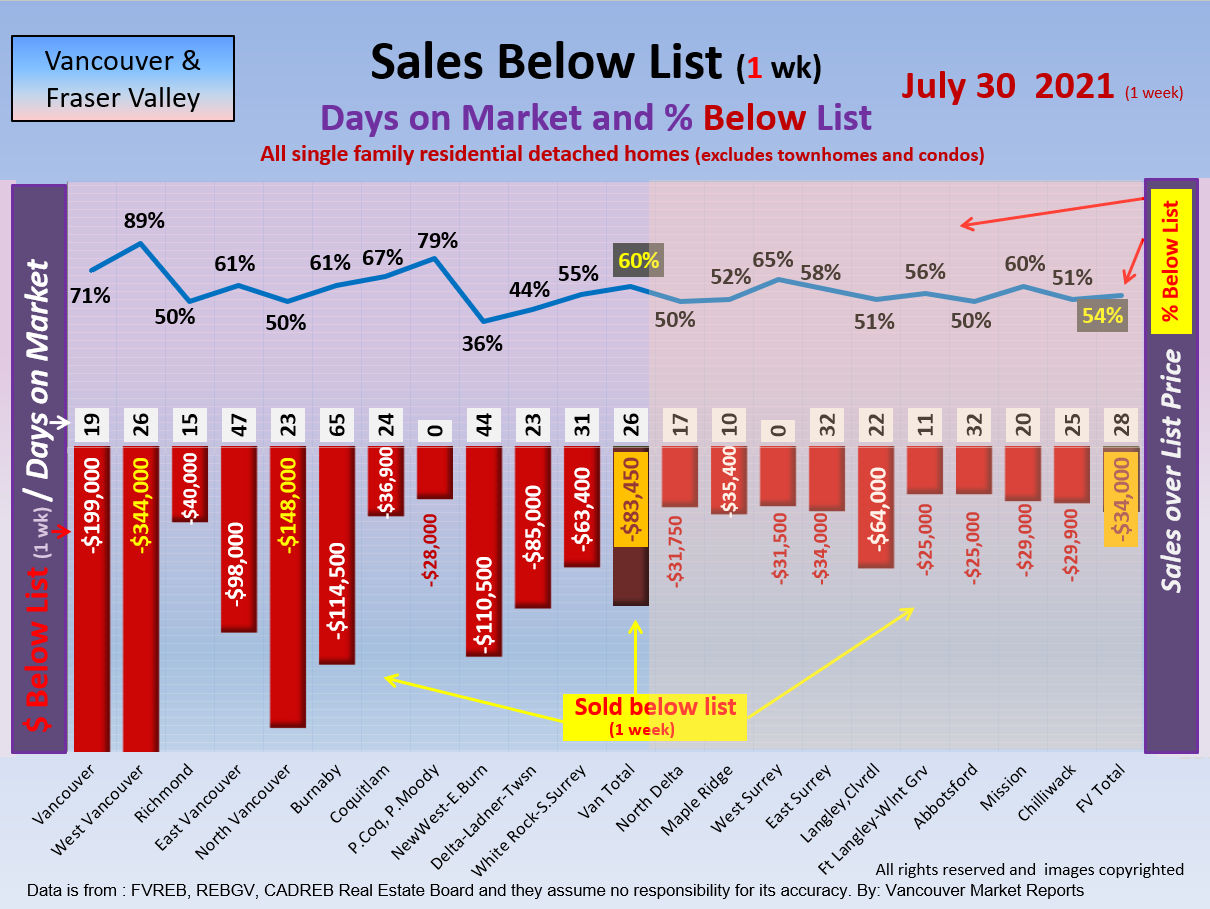
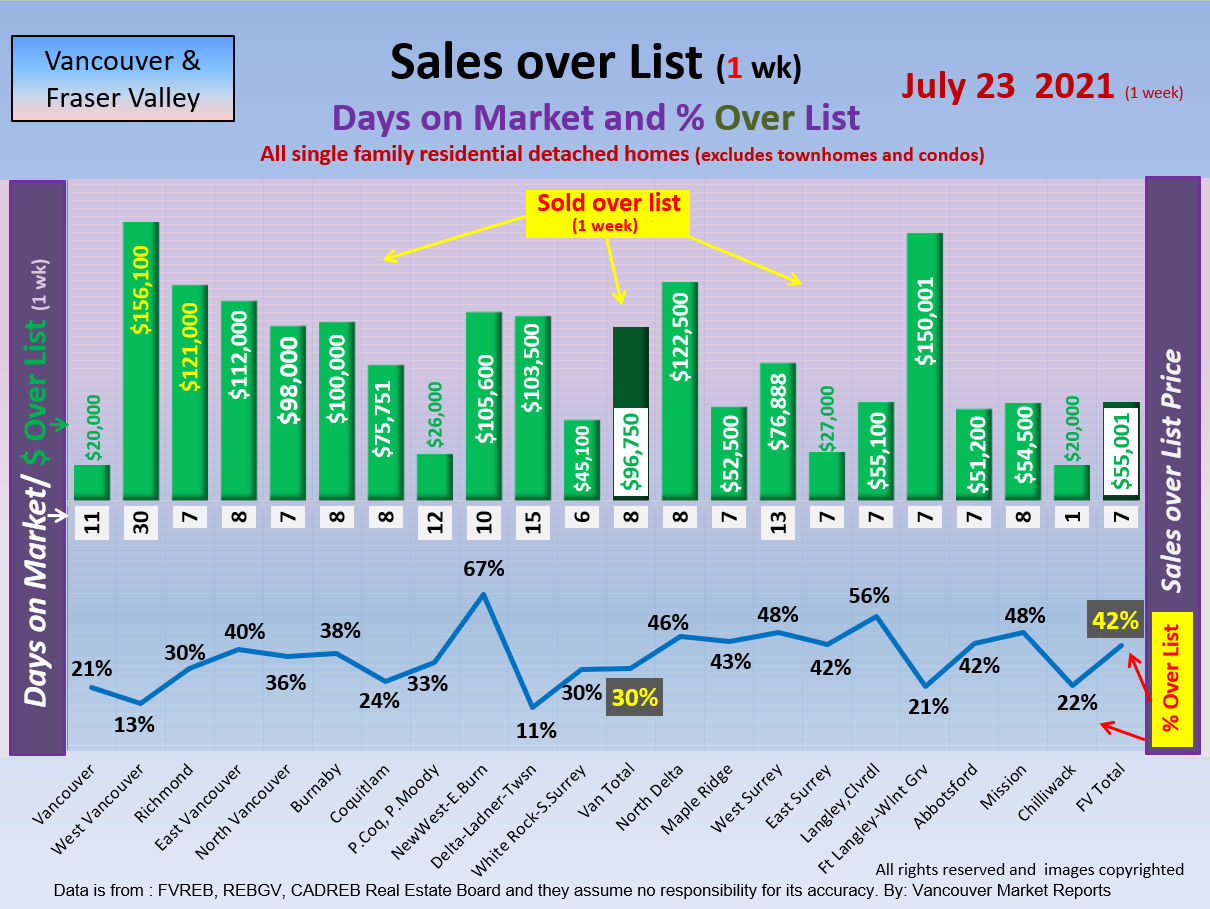
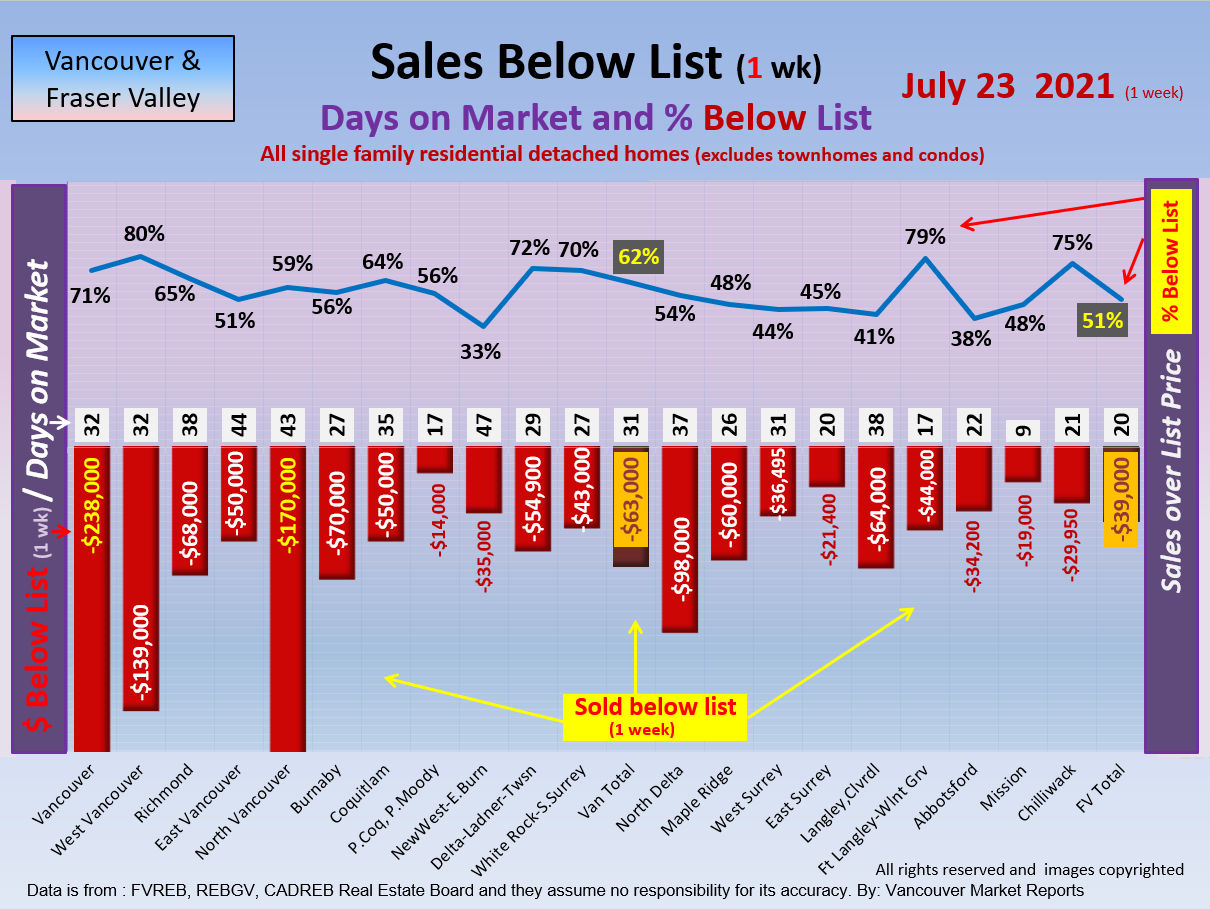
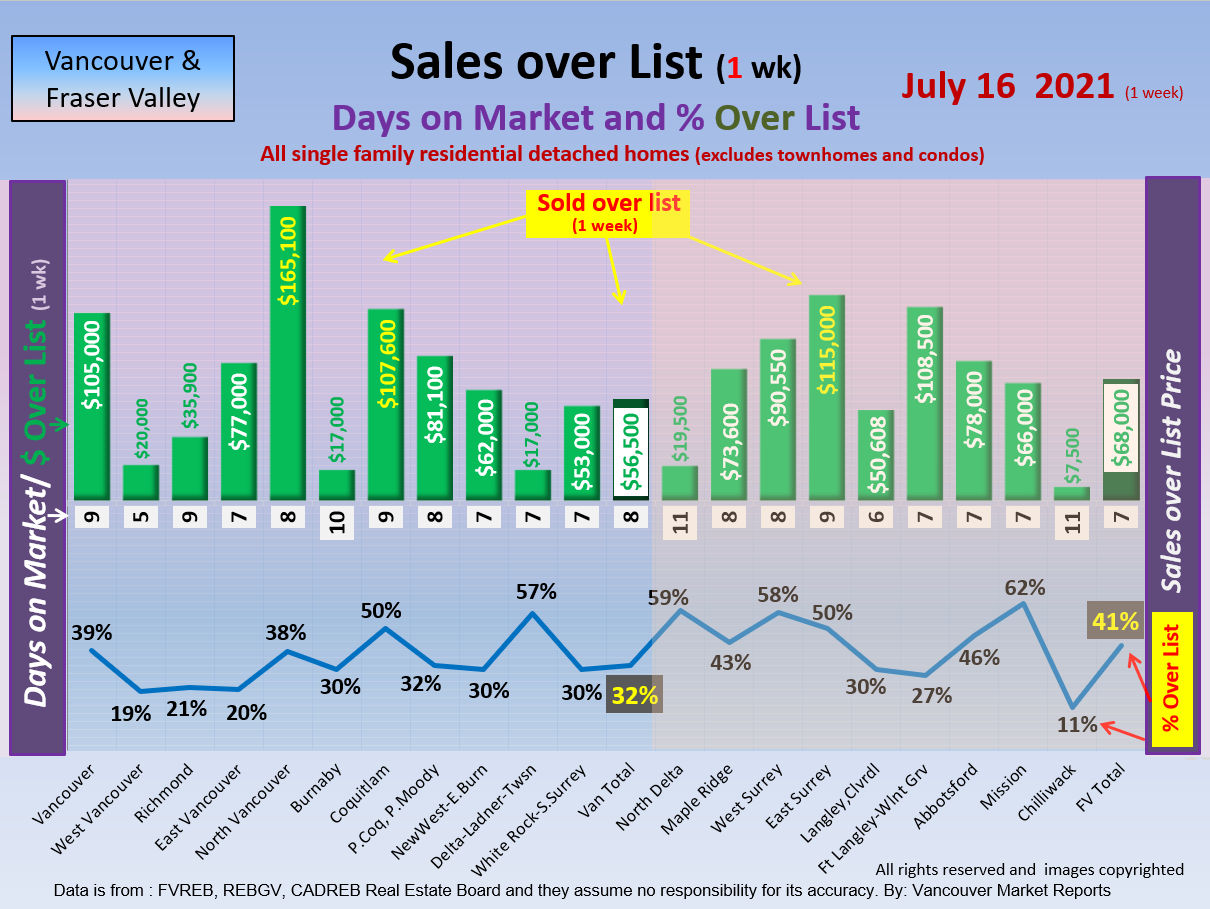
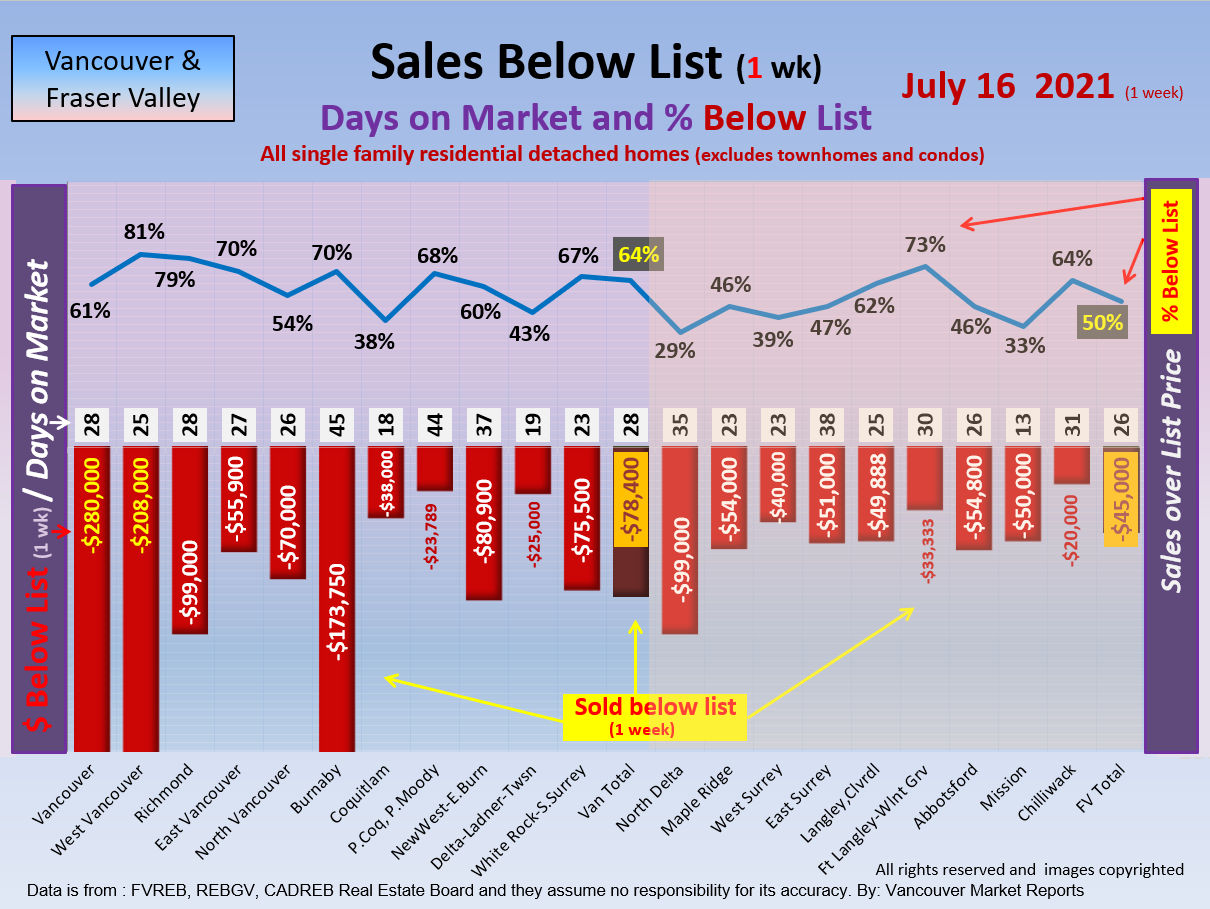
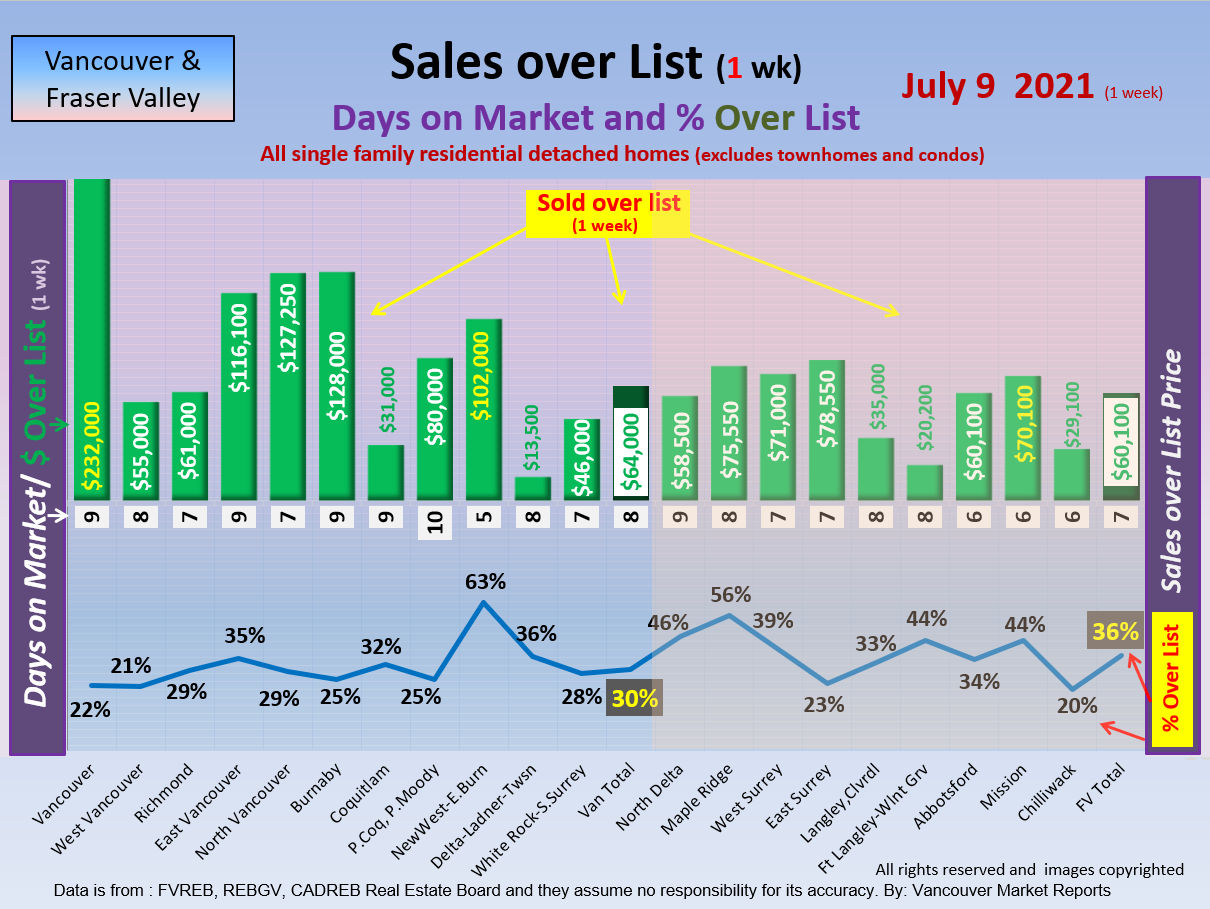
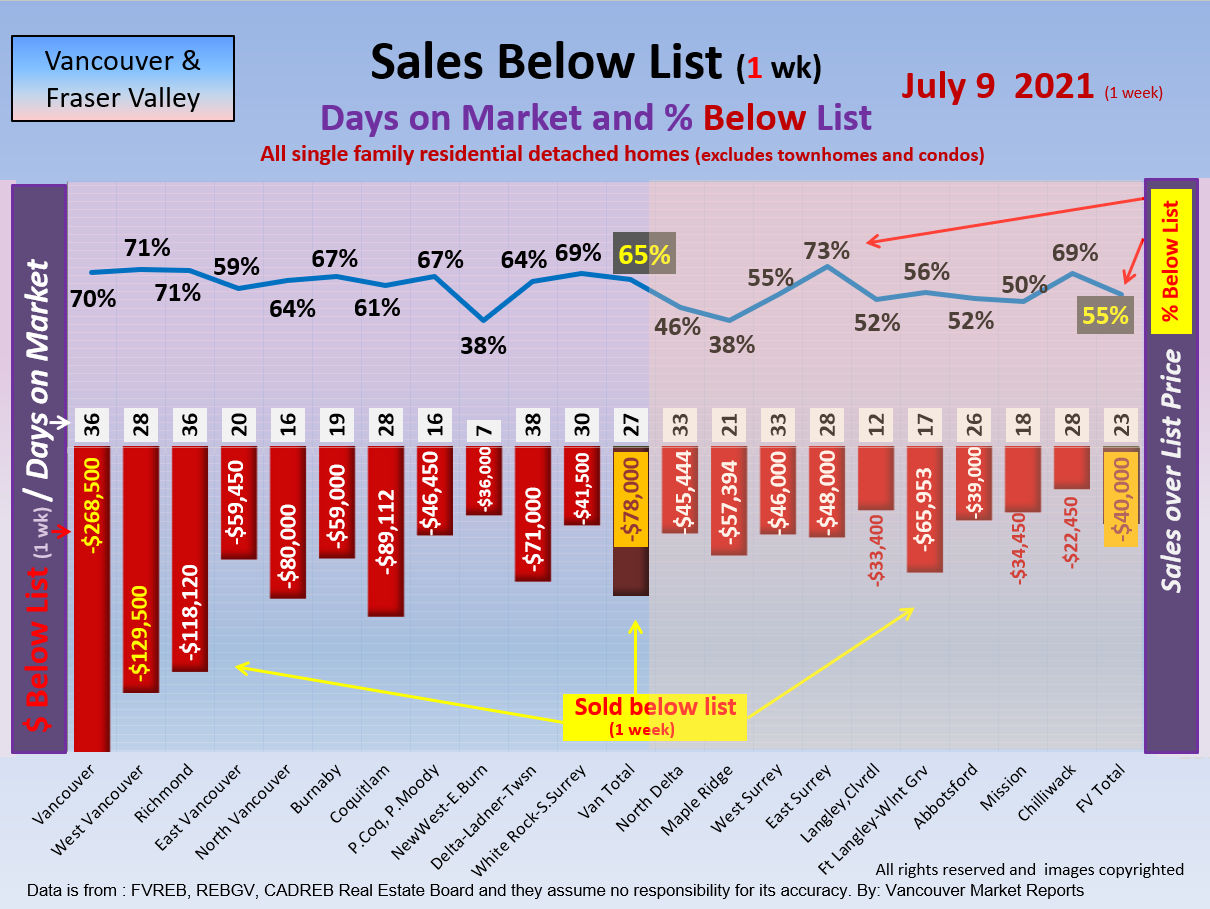
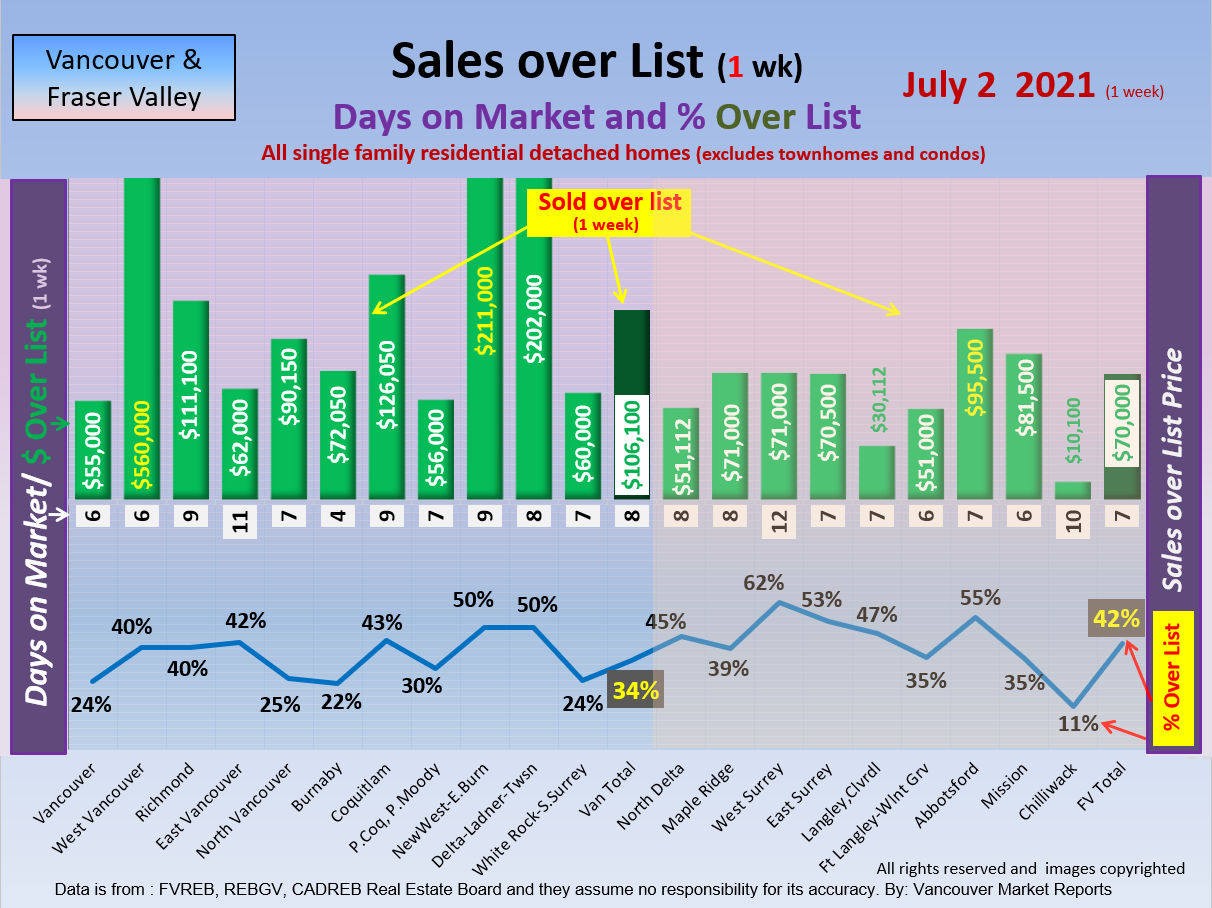
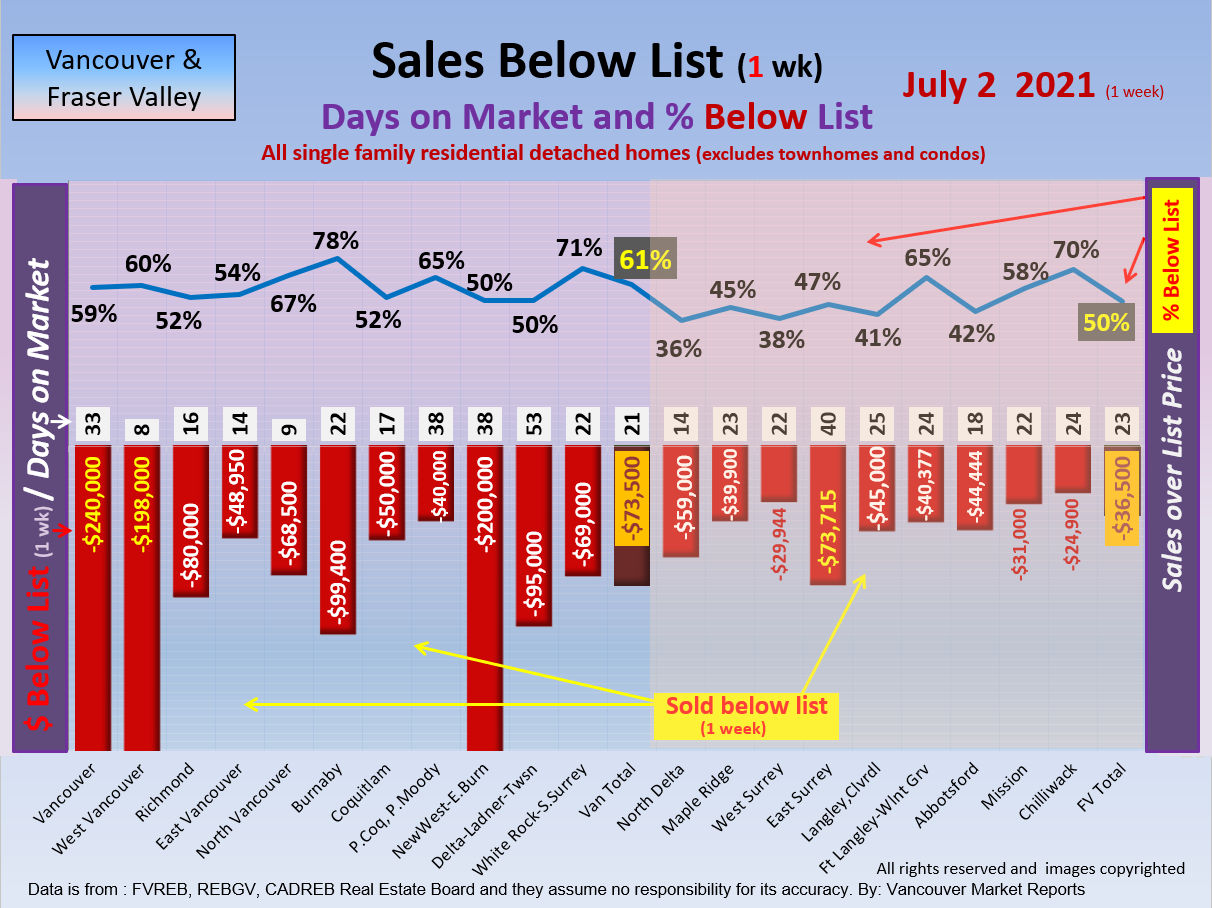
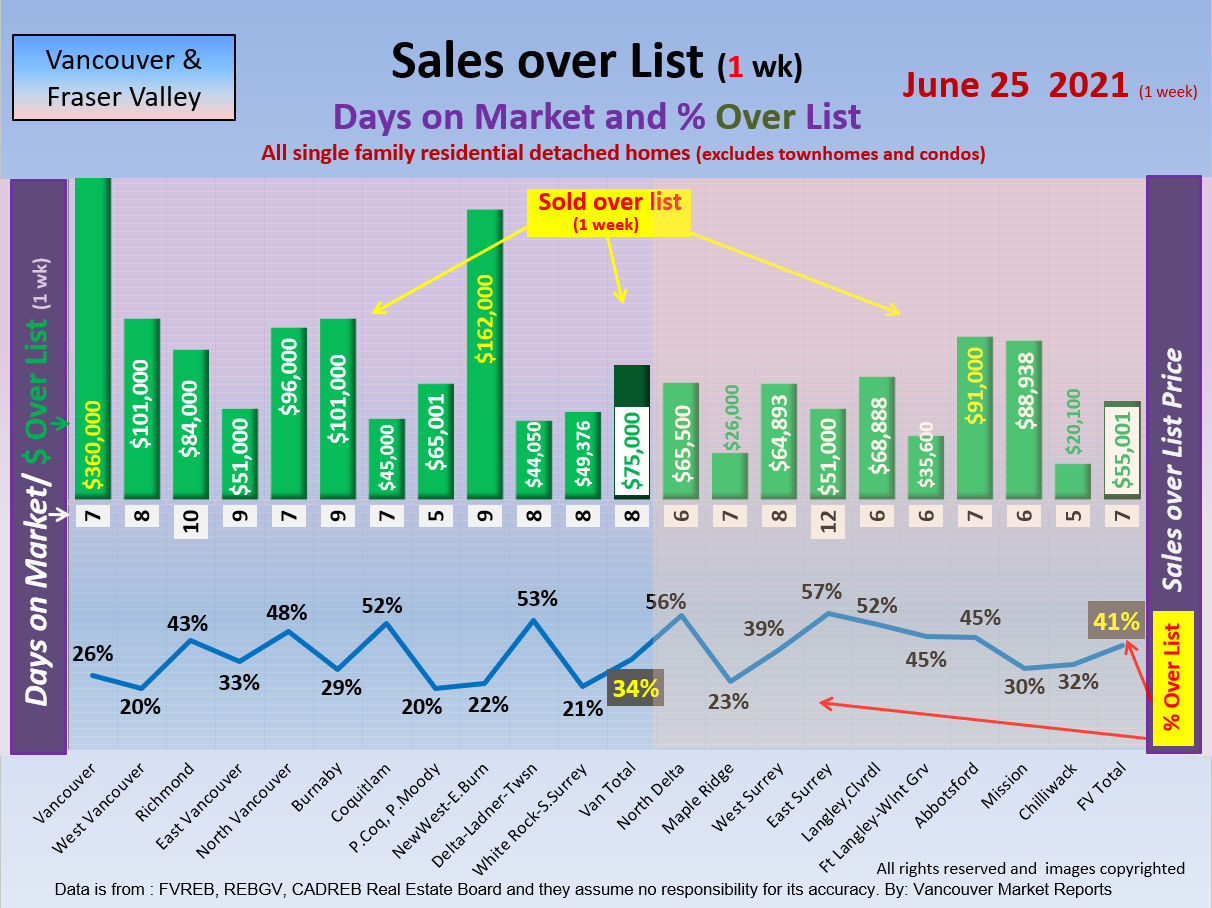
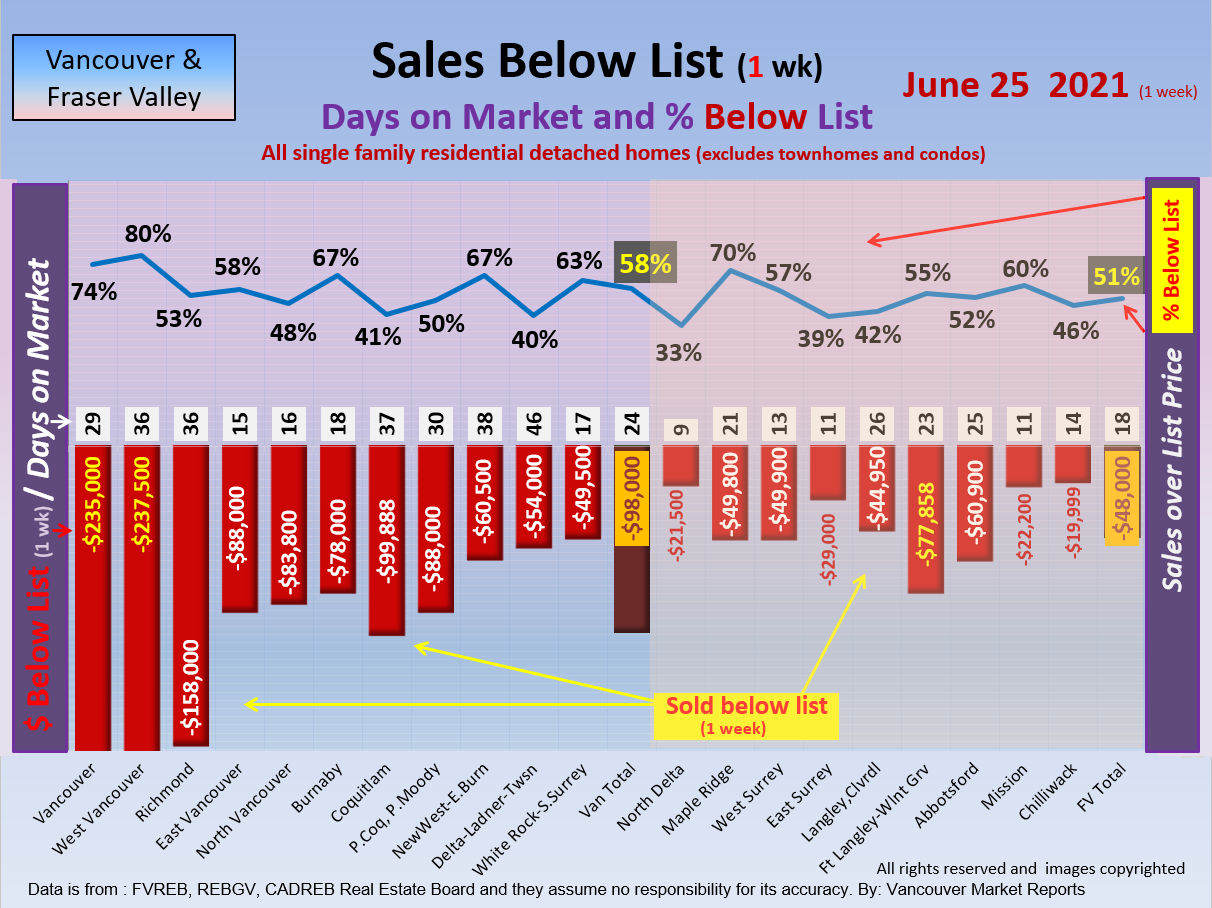
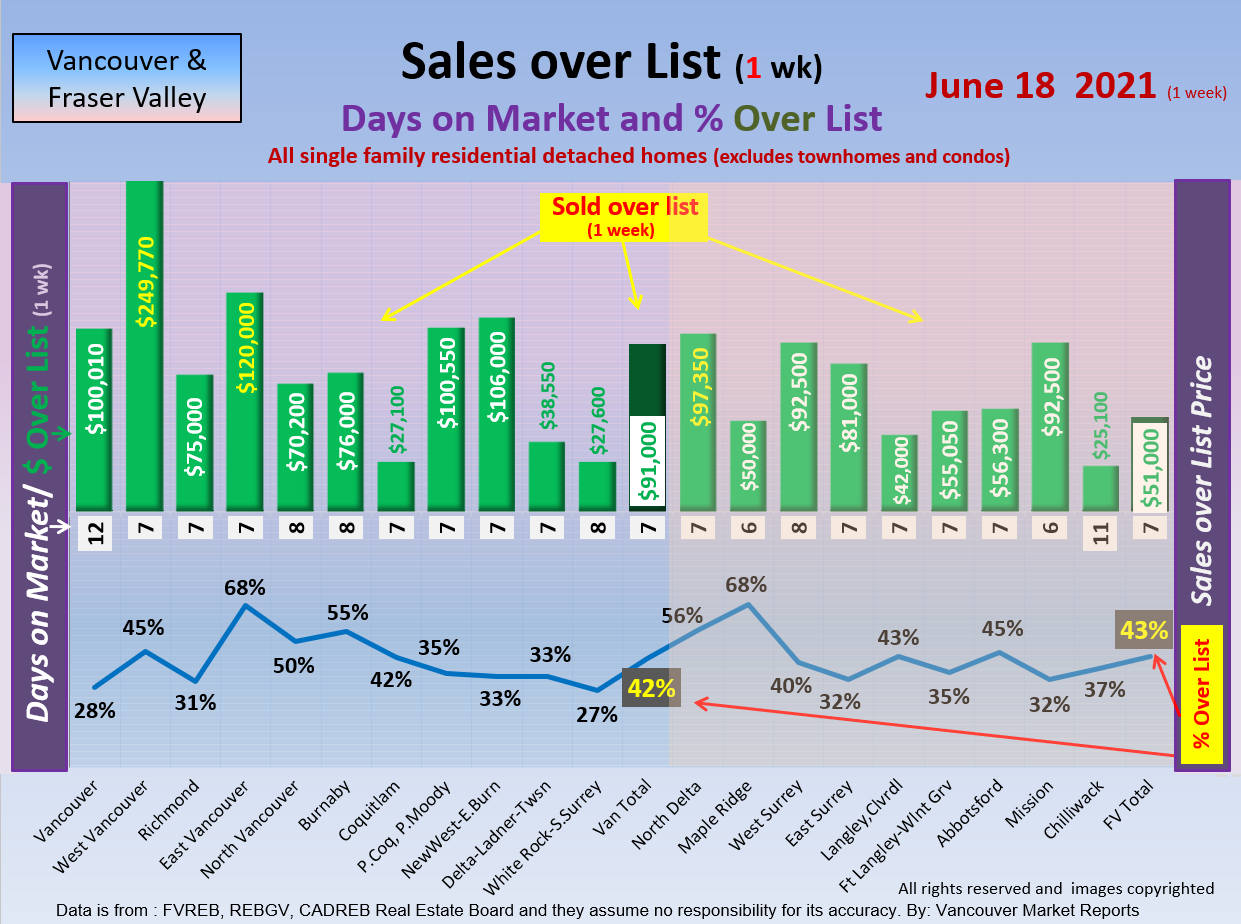
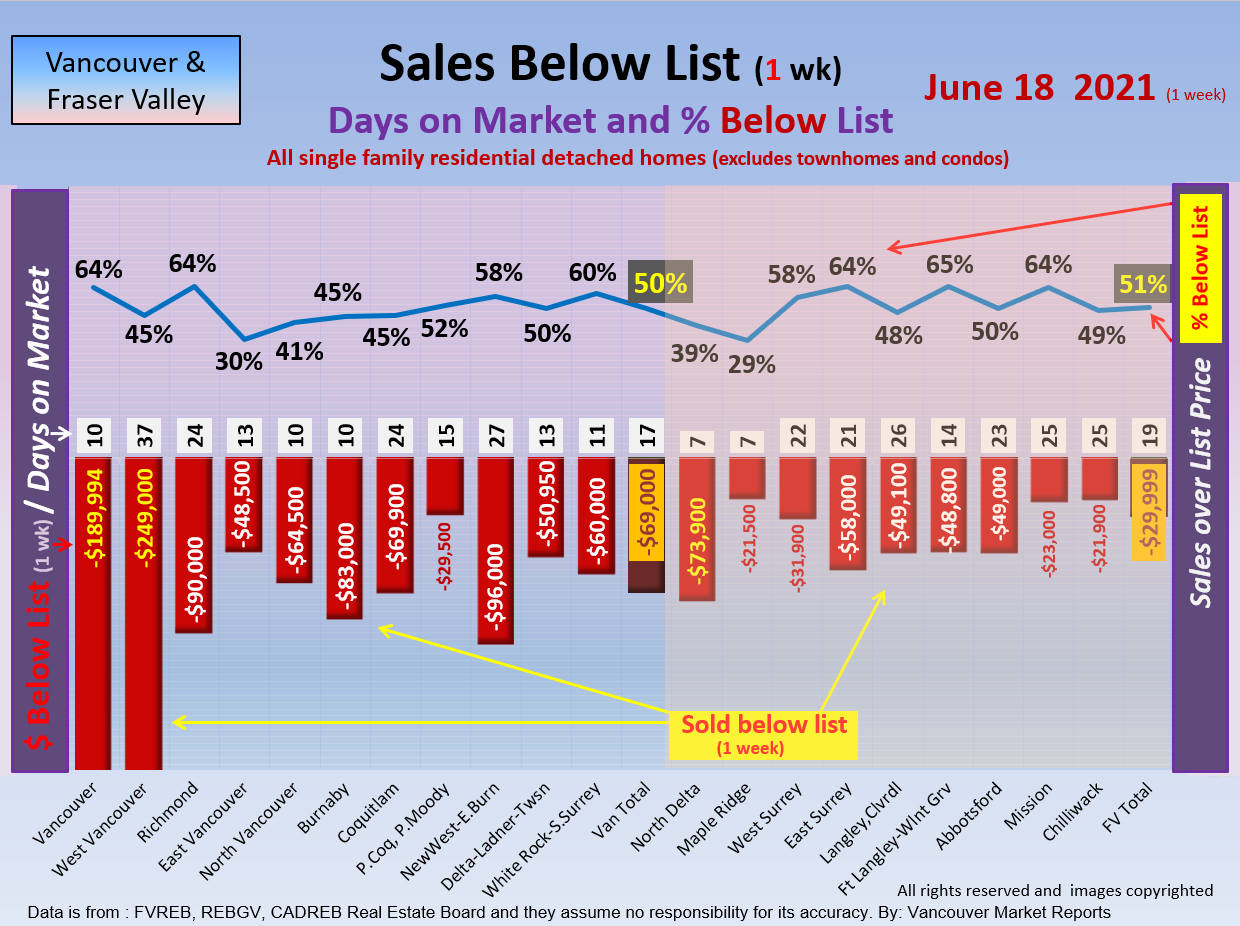
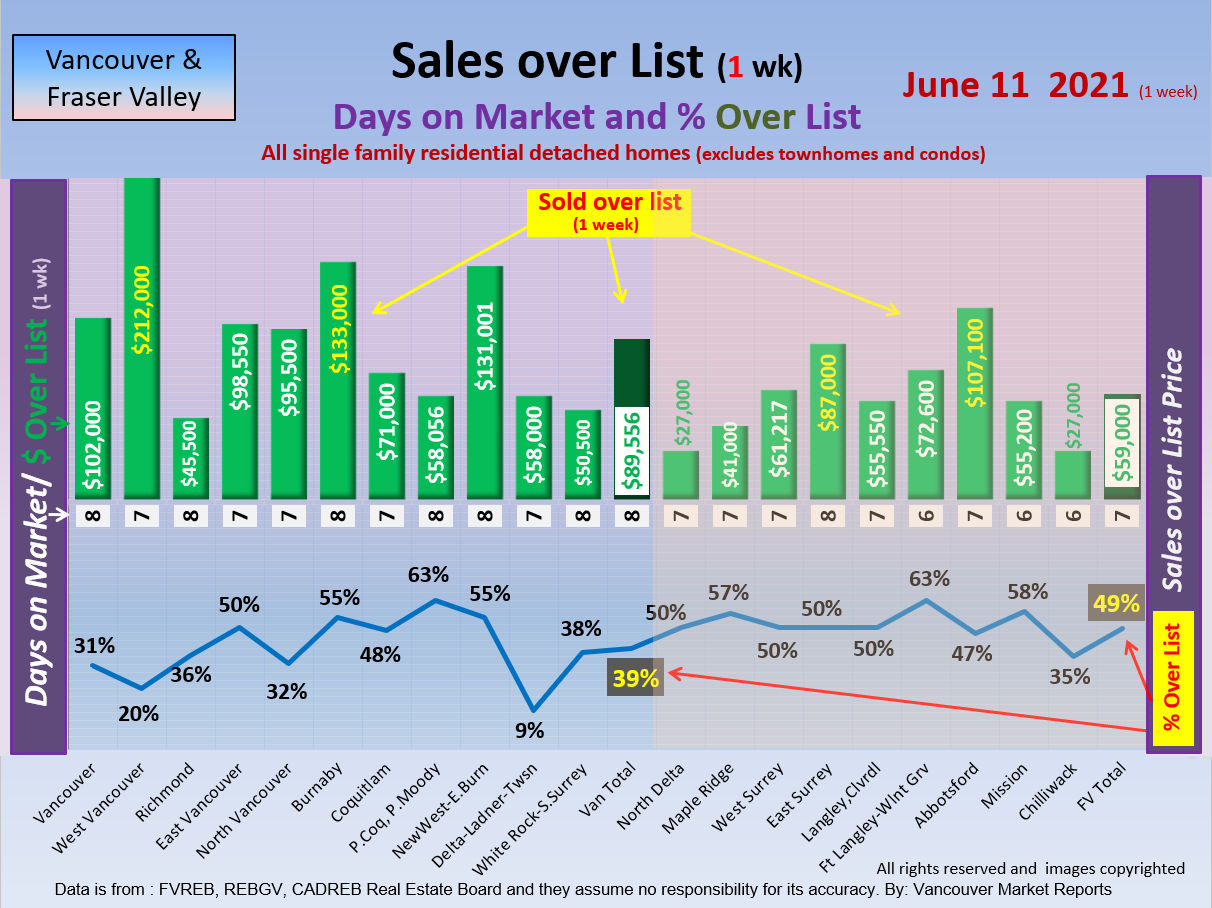
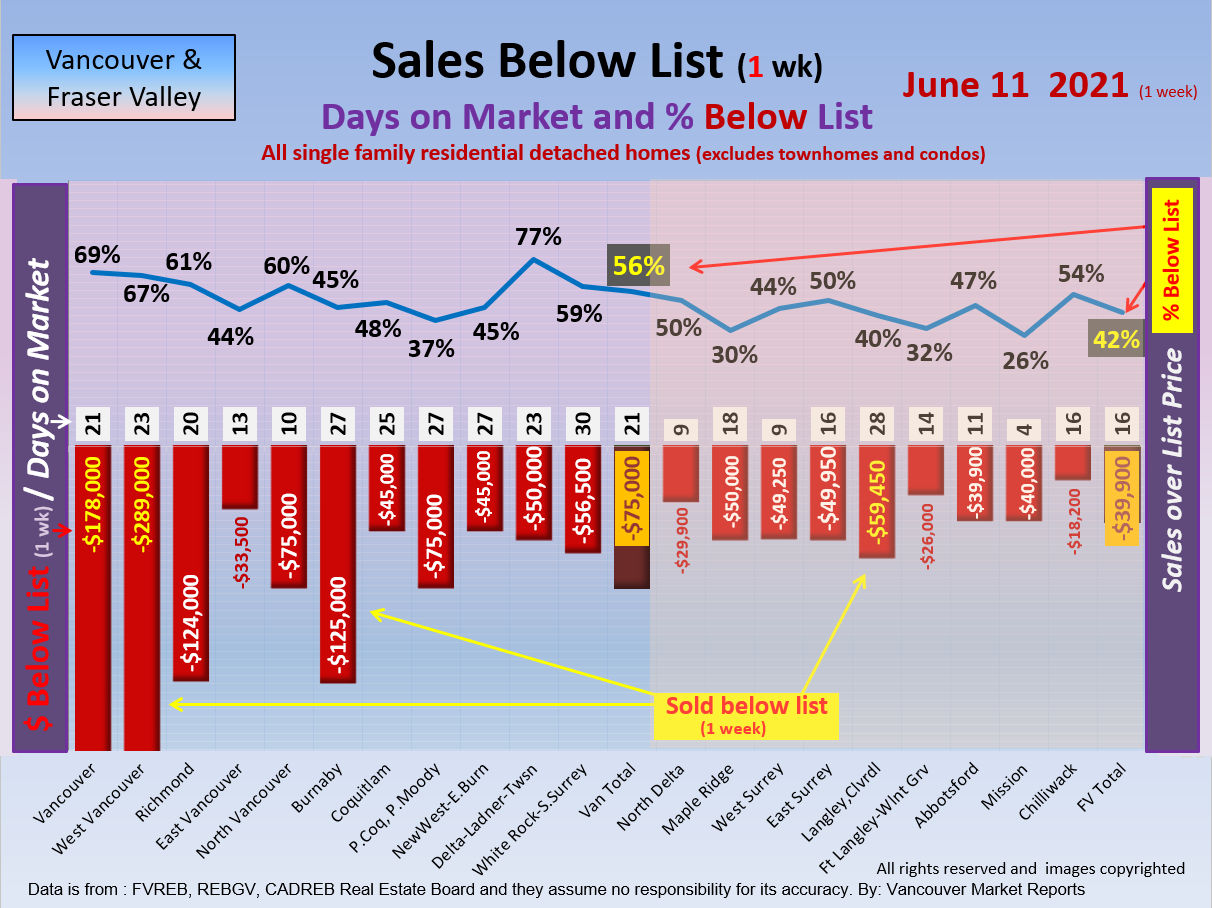
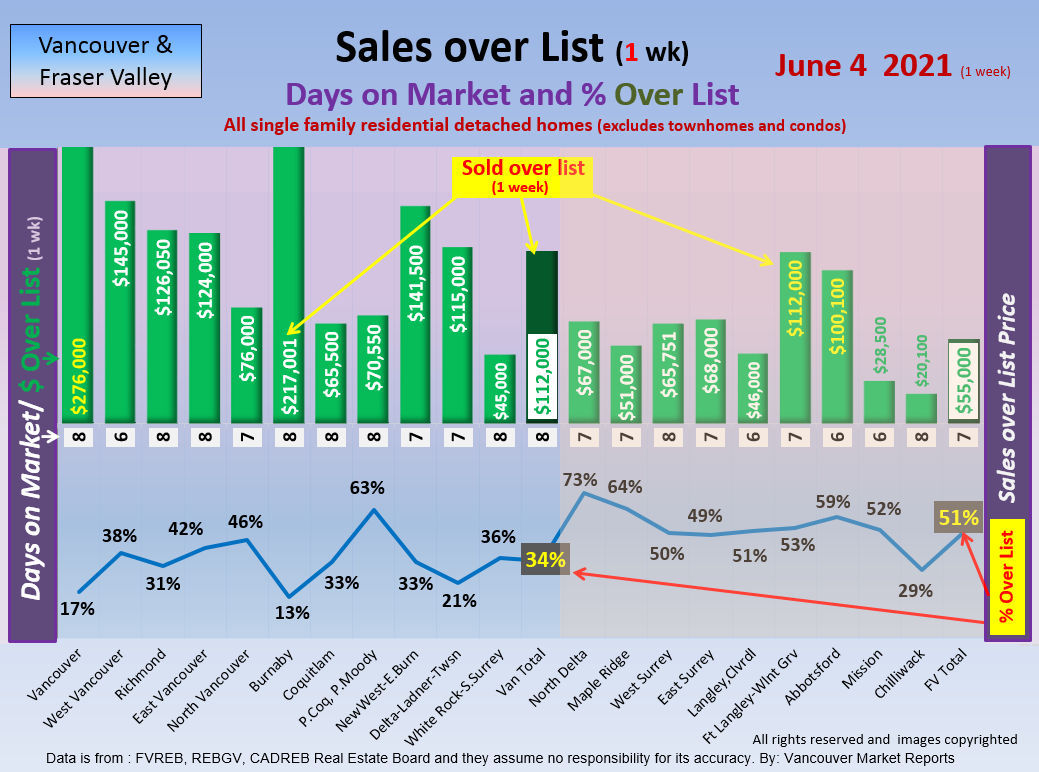
Now do compare the Weekly Discounts to the year 2021

Weekly Discounts History Below


Index Vancouver, Downtown-West End, Yaletown, Richmond, East Van, West Van, North Van, South Burnaby, North Burnaby, E.Burnaby-New West, Coquitlam, Port Coquitlam-Port Moody, Ladner-Tsawwassen, Maple Ridge, White Rock, N. Delta, W. Surrey E. Surrey, Langley, North Langley, Chilliwack, Mission, Abbotsford, East vrs West
Archives: Aug 2011
|
How the STR and MTI rates actually work Click here
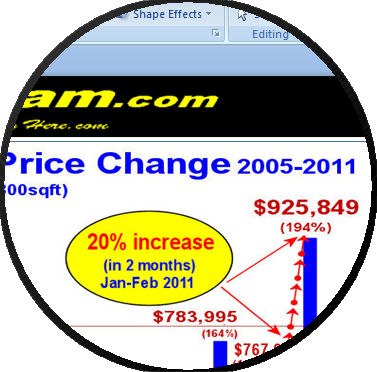
The Chinese Investors Are Coming; 20%-33% price jump in 6 weeks!
March 2 2011 w8c
Research shows that the Richmond Residential Market has jumped 20%, an all time price increase, nearly $158,000 for the average home in just 6 short weeks with no end in sight. (daily increases could make it closer to 30% today)
Listen to the " Entrepreneur of the Week's" podcast with the experts as to how this price surge could affect your home value and how you can make informed decisions. Click for podcast
The Chinese Investors are buying from helicopter viewings!
The recent study on the influx of mainland Chinese investors into Richmond and the coastal communities shows a dramatic increase in prices, 20%-33% in just six weeks. But the question for many is will that new money come to their community or will it be focused in a narrow ocean front corridor. click to read Full Report
East vrs West, why is one going up and one going down?
Does the new Chinese investment money trickle or rush into other communities to the East or to the North? The overview study looks at two areas
#1 The Chinese Corridor extending from Richmond to White Rock including to Tsawwassen, Ladner and a little bit north into the Vancouver Kitsilano area.
#2 The area east of it, namely of the Fraser Valley Real Estate Board: Surrey to Chilliwack. Here we see the first area has a 30% monthly listing sell-through and the area east of it is currently at a 9% monthly sell-through to read more ..click here
Abbotsford ..East and West very different markets.
Nowhere have we seen such a major home price difference as we do in East and West Abbotsford. This study shows that East Abbotsford had a substantial reduction of price of nearly $100,000 during 2008 and at the same time West Abbotsford barely adjusted. Today both these communities are selling for ~$85,000 difference yet they are located only 10 minutes apart. to read more ..click here
Advanced Market Reports: %%FIRSTNAME to access the current Supply-and-Demand and the next "30 Day Market Projections" reports for your home: Click Here .Abbotsford, Mission Chilliwack, Langley, Surrey, White Rock, East vrs West
Richmond, East Van, North Van, Burnaby, Coquitlam, Maple Ridge
Bill shares his secrets on how to make money in this R.E. market.
A moving Market either Up or Down creates great opportunities to gain extra equity.
How did Bill manage to sell his home at the exact top of the market.. what was his secret?
Hindsight is always 20/20, but now with my secret analysis you can better understand the market projections and earn money in both Up and Down markets! details
Get paid for your neighborhood, not just your home
Neighborhood profile movies can really increase your selling price and they are a new service to help you, the buyers and all Realtors.
Hear how many purchasers have out of town agents and don't know the neighborhood.
Public URL
details
Bill Coughlin
"Realtor and Lifestyle Consultant"
604-217-3992 cell 1-888-539-4664 Toll free [email protected]
Re/Max Little Oak Realty

|

Real Estate
Market Reports
Aug 24th Projections

Market Updates
from the local Experts


Bill Coughlin
eXp Realty

call me 1-778-374-3744
Email: [email protected]

The Market Updates
from the local Experts


Bill Coughlin
eXp Realty
call me 1-778-374-3744
Email: [email protected]

Do watch the Market Updates
from the local Experts
Bill Coughlin
eXp Realty
call me 1-778-374-3744
Email: [email protected]

Bill Coughlin
eXp Realty
call me 1-778-374-3744
Email: [email protected]
|