Full View

 PAGES
   1-12

    Market Analysis and Forecasting
       
West Vancouver - DETACHED 

April 1 2024 (update)


1. The Summary of total number of Listings Marketed, Expiries, Sales and %SOLD rate.


When Market Activity  is 21-40% , we are in a Sellers Market. When Market Activity  is 14% and lower , we are in a Buyers Market. There are winning strategies for both Market types. With the right advice and action from the right Realtor, both markets can provide you an opportunity to maximize your return.   (Subscribe)


    Market Analysis and Forecasting
       
West Vancouver - DETACHED 

April 1 2024 (update)

      2.  What Price Range is Selling, in How many Days to Sell and at What Sales Discount?


When Market Activity  is 21-40% , we are in a Sellers Market. When Market Activity  is 14% and lower , we are in a Buyers Market. There are winning strategies for both Market types. With the right advice and action from the right Realtor, both markets can provide you an opportunity to maximize your return.   (Subscribe)


    Market Analysis and Forecasting
       
West Vancouver - DETACHED 

April 1 2024 (update)


        3. What Changed in the Last Month or the Last Year: # of Properties Available, Home Price Changes, DOM & the Sales Discount?


When Market Activity  is 21-40% , we are in a Sellers Market. When Market Activity  is 14% and lower , we are in a Buyers Market. There are winning strategies for both Market types. With the right advice and action from the right Realtor, both markets can provide you an opportunity to maximize your return. (Subscribe)


     Market Analysis and Forecasting
       
West Vancouver - DETACHED 

April 1 2024 (update)

4.  What  Neighbourhoods are Selling, What is their Price $Discount & How Many Days to Sell ?


When Market Activity  is 21-40% , we are in a Sellers Market. When Market Activity  is 14% and lower , we are in a Buyers Market. There are winning strategies for both Market types. With the right advice and action from the right Realtor, both markets can provide you an opportunity to maximize your return. (Subscribe)


     Market Analysis and Forecasting
       
West Vancouver - DETACHED 

April 1 2024 (update)

5. Summarized Market Update for your Social Media or your Blogs.


When Market Activity  is 21-40% , we are in a Sellers Market. When Market Activity  is 14% and lower , we are in a Buyers Market. There are winning strategies for both Market types. With the right advice and action from the right Realtor, both markets can provide you an opportunity to maximize your return. (Subscribe)


     Market Analysis and Forecasting
       
West Vancouver - DETACHED 

April 1 2024 (update)

      6. Market Forecast  - Should I Sell Now or Wait?  the #1 Real Estate Question? :  What do the Forecast and Trends Indicate? 


When Market Activity  is 21-40% , we are in a Sellers Market. When Market Activity  is 14% and lower , we are in a Buyers Market. There are winning strategies for both Market types. With the right advice and action from the right Realtor, both markets can provide you an opportunity to maximize your return. (Subscribe)


     Market Analysis and Forecasting
       
West Vancouver - DETACHED 

April 1 2024 (update)

7.a  How did the Top 50% of the Home Prices Change & How Much did they Discount on Sale?

The BLUE line details the Top 50% Home Price Index: (HPIp Top 50%) over the past 13 months in West Vancouver.  (The HPIp top 50% is the Paired Housing Price Index for High End homes above $2,600,000)
The Home Price Index HPIp is the MOST Accurate Indication of Price Changes. (Note: Each Sale is paired to it's previous sale after 2005 to determine its exact price change.)

Sales Discounts RED bar are a MAJOR indication of Pending Market Changes. When the Sales Discounts are Increasing or Decreasing it gives you an advanced understanding of the Market Trends. (Subscribe)


     Market Analysis and Forecasting        West Vancouver - DETACHED 

April 1 2024 (update)

7.b How has the Top 50% Market performed over the last year? 
                       Are Listings or Sales Up or Down?  Is the
Top 50% %SOLD Sell-Through-Rate Higher or Lower?

 The BLUE line details the Top 50% Monthly Listings Marketed in each of the past 13 months in West Vancouver.

The RED line details the Monthly Sales count in each of the past 13 months in West Vancouver.

The Bar Graph above shows the %SOLD (STR Sell-Though-Rates) (Absorption)  This Monthly Rate is calculated by the Sales over the Total Listings Marketed. (Subscribe)


     Market Analysis and Forecasting
       
West Vancouver - DETACHED 

April 1 2024 (update)

8.a How did the Lower 50% of the Home Prices Change & How Much did they  Discount on Sale?

The PURPLE line details the Lower 50% Home Price Index: (HPIp Lower 50%) over the past 13 months in West Vancouver.  (The HPIp Lower 50% is the Paired Housing Price Index for Low End homes below $2,600,000)
The Home Price Index HPIp is the MOST Accurate Indication of Price Changes. (Note: Each Sale is paired to it's previous sale after 2005 to determine its exact price change.)

Sales Discounts RED bar are a MAJOR indication of Pending Market Changes. When the Sales Discounts are Increasing or Decreasing it gives you an advanced understanding of the Market Trends. (Subscribe)


     Market Analysis and Forecasting        West Vancouver - DETACHED 

April 1 2024 (update)

8.b How has the Lower 50% Market performed over the last year? 
                       Are Listings or Sales Up or Down?  Is the
Lower 50% %SOLD Sell-Through-Rate Higher or Lower?

 The BLUE line details the Lower 50% Monthly Listings Marketed in each of the past 13 months in West Vancouver.

The RED line details the Monthly Sales count in each of the past 13 months in West Vancouver.

The Bar Graph above shows the %SOLD (STR Sell-Though-Rates) (Absorption)  This Monthly Rate is calculated by the Sales over the Total Listings Marketed. (Subscribe)


     Market Analysis and Forecasting
       
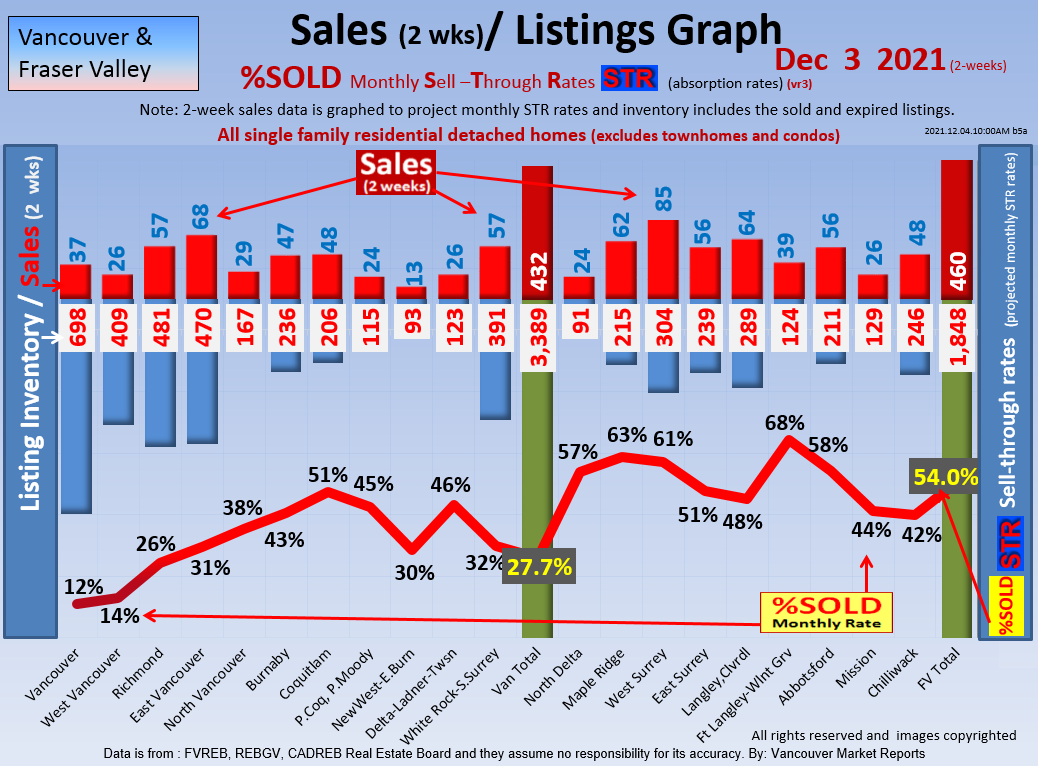
Lower Mainland - DETACHED 

April 1 2024 (update)

9.a How many homes Sold in the last 2 weeks & what was the monthly %SOLD rate? Are the listing inventories growing or shrinking?

The   Red bars  indicate the SFD Sales and the  Blue bars   the Total Listings Marketed during the last 2 weeks 

Sales Discounts RED bar are a MAJOR indication of Pending Market Changes. When the Sales Discounts are Increasing or Decreasing it gives you an advanced understanding of the Market Trends. (Subscribe)


     Market Analysis and Forecasting
       
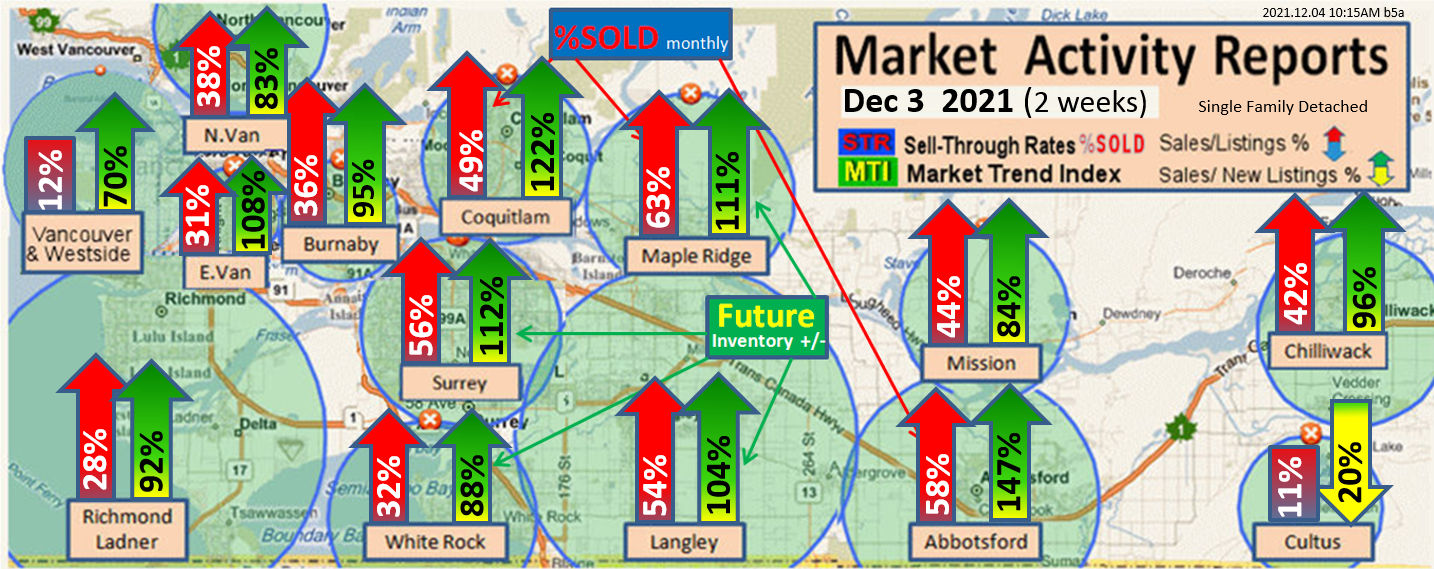
Lower Mainland - DETACHED 

April 1 2024 (update)

9.b For the previous 2 weeks we look at larger Geographical and Ethnical areas  %SOLD rates & Market Trend Index (MTI)  to see if the listing inventories are growing or shrinking?

The last 2 weeks of Sales;  %SOLD  STR   are expressed as a monthly rate.

The Market Trend Indicator  ( MTI) is  a MAJOR indication of changing listing Levels. When inventories are Increasing or Decreasing it gives you an advanced understanding of the pending competition and Market Trends. (Subscribe)


     Market Analysis and Forecasting
       
Lower Mainland - DETACHED 

April 1 2024 (update)

10. Make a quick CMA for West Vancouver's High End SFD Homes (Top 50%)
by using it's previous Sales Price
?


   West Vancouver's Home Evaluator / ROI / Forecaster
Single Family Detached High End .. more than $3,000,000       

What Is Your Home Value, Profit; Return On Investment?
              你的房屋价值 ,利润, 投资收益率知多少?


No Flash? Use our Mobile Friendly Link


Date Value

                                                    计算你的房产价值;     与130的本地和全球市场比较你的投资利润
Calculate Your Home Value & Compare Your ROI to 130 Local & World Markets. 


cx

Approximately 7% of all the MLS SFD home listings in the Lower Mainland were listed at the right price to earn a sale in 2012. The other ~93% either Reduced their List Price to sell or did not sell. This Valuation Formula is accurate with in ~2% approximately 40% of the time. To increase the CMA accuracy this home valuation needs to be adjusted for any changed conditions.  (For example: a 1% deprecation per year since the previous purchase date unless renovations equals the deprecation amount, any change in use or change in neighbourhood values.) 
Note: The subject home's previous purchase price is required to have been at fair market value at that time in order to increase accuracy.


     Market Analysis and Forecasting
       
West Vancouver - DETACHED 

April 1 2024 (update)

11. Who is selling West Vancouver?

              Answer: RE/MAX!


     Market Analysis and Forecasting

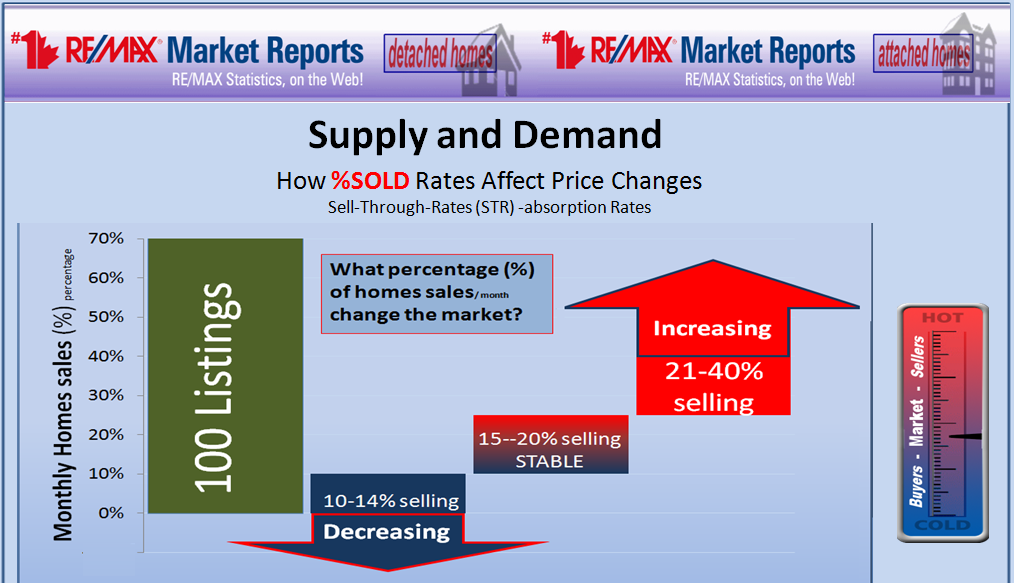
12. How does the  %SOLD   or Sell-Through-Rate  determine a Buyer's or Seller's Market?

When Market Activity  is 21-40%, we are in a Sellers Market. When Market Activity  is 14% and lower , we are in a Buyers Market. There are winning strategies for both Market types. With the right advice and action from the right Realtor, both markets can provide you an opportunity to maximize your return. (Subscribe)


I invite you to subscribe to these  Advanced Market Reports.

Index Abbotsford Burnaby North Burnaby Chilliwack Coquitlam North Delta Delta Ladner Langley N. Langley Maple Ridge Mission New West Port Coquitlam Port Moody Richmond Surrey West Surrey East South Surrey White Rock 溫哥华房產投資Vancouver Westside Downtown-West End Yaletown East Vancouver West Van North Van

Number of visits on this page: 1,065. Number of visits on this site: 12,078,866.