click on your city to see current report
Hello, Fellow Real Estate Agent..please enjoy and use these reports to assist you in closing that next listing.
These reports are compiled for you. Any feedback or comment is very much appreciated.
If you would like to sponsor any city, feel free to let me know.
NOTE: This representation is based in whole or in part on data generated by the Real Estate Boards of Greater Vancouver, Fraser Valley, Chilliwack which assume no responsibility for its accuracy.
Copyright © 2011 by BillCoughlin
click on your city to see current report
You probably currently pay staff to compile much of this board information already... so we are hoping to save you these costs.
1. When selling a home in your city, Real Estate is your best choice because of the following reasons:
1. Chances are that a Real Estate Agent will sell your home over the competition:
(Here the Real Estate Total sales including "Out of Area" Real Estate agents are counted)
2. Listing with a local Real Estate Agent gives you a greater chance of selling:
e.g; your LOCAL CITY Real Estate agents produce $$$$/agent and the other guys produce less (Local City area only)
Note: (here I remove the out of town Real Estate agent production for these calculations)
e.g: Focusing on what the Local Real Estate agent is producing in the Local Area rather than the office total. I do not calculate in the out of town agents’ local volume, but dividing the local agents' volume by the number of local agents to give you the highest volume per agent.
If I factor in the 30% out of town agents volume that sell 1 house here and there, then the Real Estate volume counting all those agents would dramatically drop the volume/agent. So I focus on the local volume per local agent whenever practical.
Note: the listings and sales by non local agents in Chilliwack are about 26% and in the Burnaby area they are nearly 75%.
I think it is important to stress local office performance as having a stronger value than an out of town agent's services, e.g. LOCAL offices are involved in the community, know the neighborhoods, have office tours and have a strong local agent support base.
2. I have now added in two major new statistics to really help you get the Real Estate success story across and list more homes.
1. Number of days on the Market to sell (Yes - this one is usually a lower number than all the competition)
2. You get more money when you sell with Real Estate (Yes - Real Estate has the smallest discount from List price to Sale price of most all companies).
Some companies really BUY their listings and then have huge discounts when they finally sell. Bottom line, we usually have market share, office tours and have more exposure, resulting in a higher and faster sales price and now those facts are in print for your agents to use as listing tools. In fast markets, the less informed offices can under-list and result in average prices well over list price. So I will continue to adjust this report to demonstrate the extra professionalism of the Real Estate agent. Some other offices really use the market stats to get sharper list prices.
Hopefully these new tools I am providing now give our Real Estate agents the upper hand to price on market.
Hello fellow Real Estate Agent.. please enjoy and use these reports to assist you in closing that next listing.
These reports are complied for you for .. any volunteers and comments appreciated. If you would like to sponsor this city, please let me know.
NOTE: This representation is based in whole or in part on data generated by the Real Estate Boards of Greater Vancouver, Fraser Valley, Chilliwack which assume no responsibility for its accuracy.

The VancouverMarketReports.com has even more detailed listing aids (reports every 2 weeks)
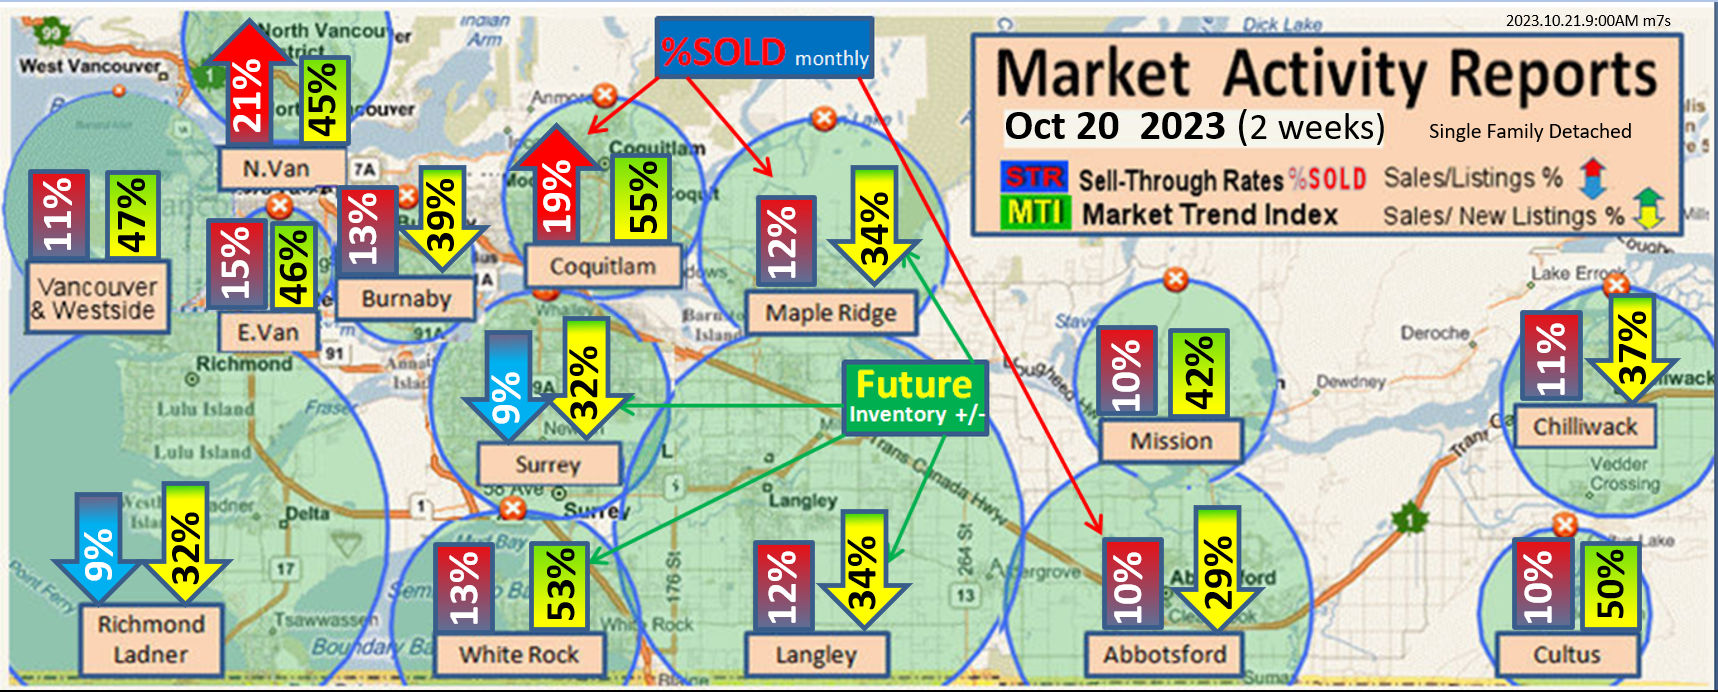
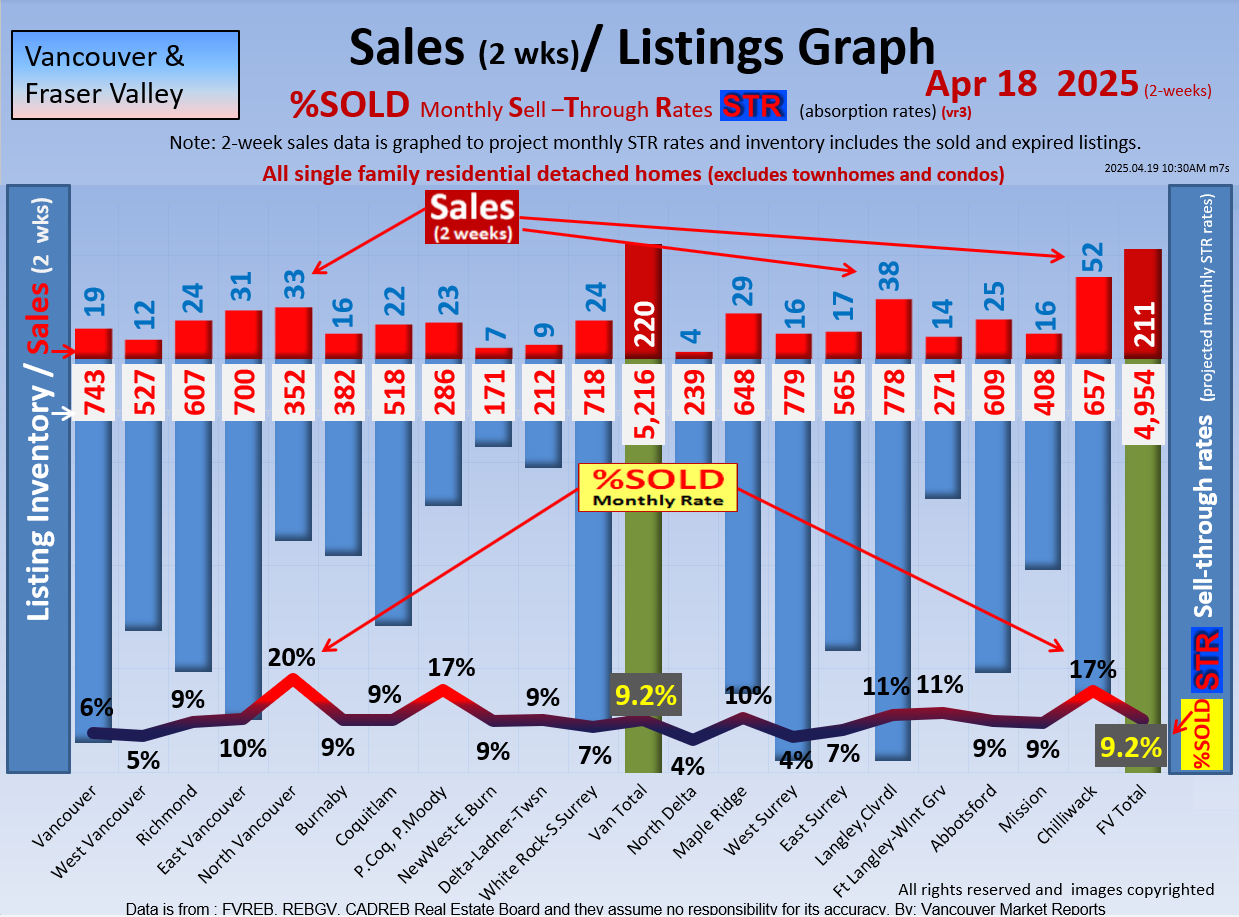
1. Absorption Rates (STR the Sell-Through-Rates /month)
This is a very useful tool to determine if the market is going up or down and help the seller fetch a better price for their home.
2. Market Trend Indicators ( MTI )
This is the forward projections based on increasing or decreasing inventory levels. It is a wonderful tool for helping the customer see 1-2 months into the future.
3. Sales Discount Rates (SDR) Average (median)
This is the difference from the List Price to the Sales price. It is our strongest indicator of market changes. When time allows and demand is there for the report, an update every 2 weeks is the goal.
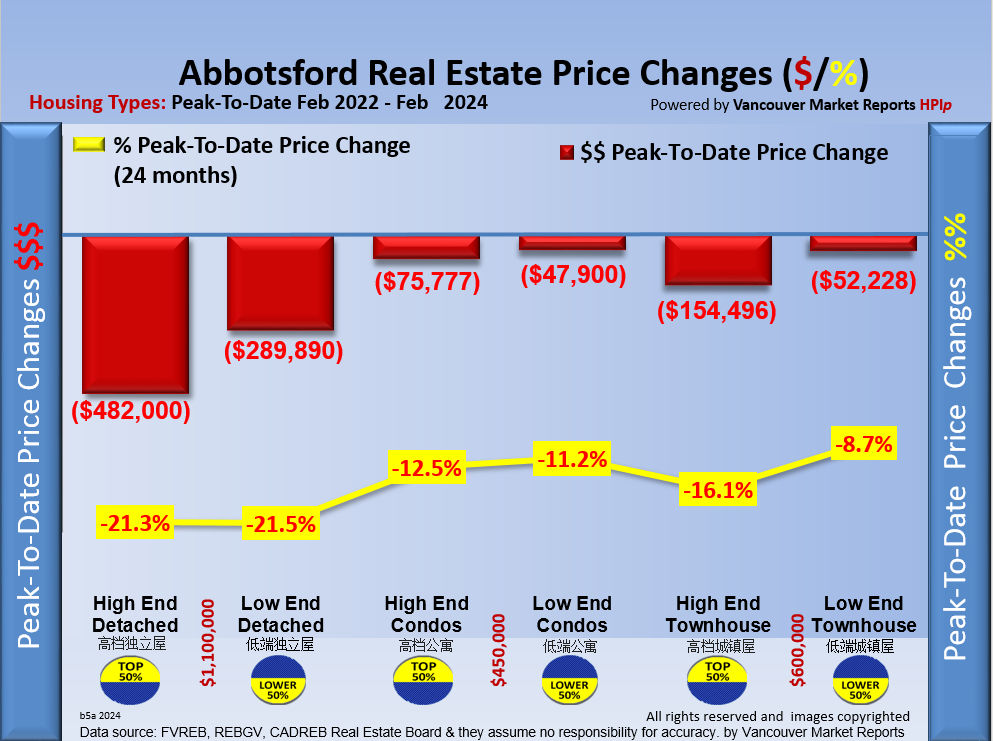
4. Home Price Index; (HPI)
Many boards actually don't do Home Price Indexes and in general the boards that do can produce HORRIBLE indicators of market changes. For example, Local boards often average the 2 bedroom home and the 6 bedroom home, or a high end lot home and low end lot home and with little adjustments on sqft, etc to determine the average price (HPI).
1. This does not work!! So if the high end market actually drops $100,000 and you sell more high end homes that month than low end homes then their HPI (average) shows that the prices went up instead of down???
2. Note: We attempt to use very narrow study criteria to compare standardized home sizes and similar lots and areas.
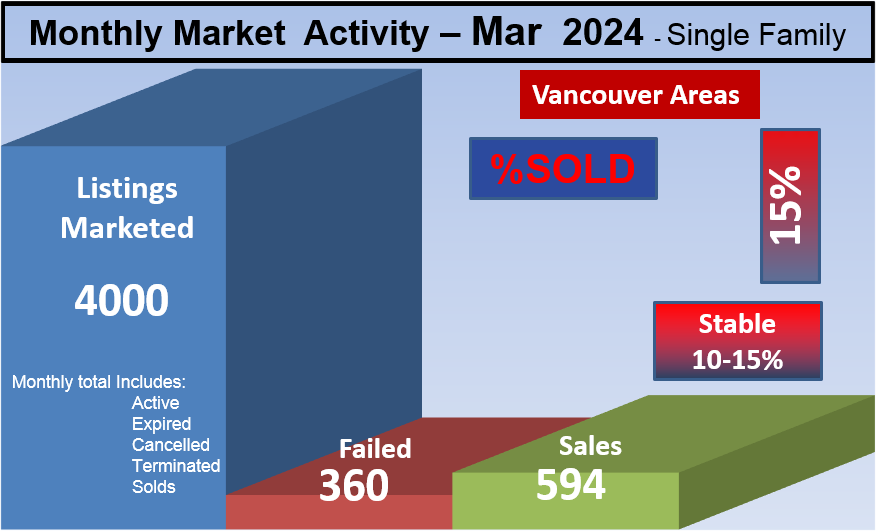
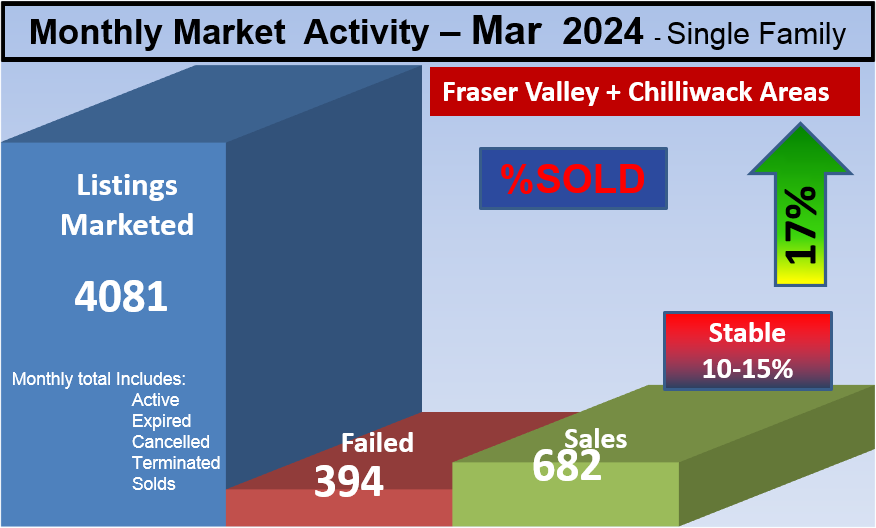
The Lower Mainland Real Estate Market Reports
温哥华里士满加拿大不动产市场变动
When looking at the data remember that the out of town Real Estate agent sales are only counted for total Real Estate sales.
1. But all the performance reports such as volume per agent, DOM and discount are based on LOCAL listings/sold data by local agents.
2. Market Areas are determined by actual market areas not by municipal boundaries or by board areas necessarily.
For example:
1. White Rock includes the South Surrey Elgin area and this area will not be counted in Surrey.
2. North Delta will be counted as part of Surrey as more out of town agents sell North Delta than Local Delta agents do.
3. We calculate all the sales volume for the month only from the local city area stats as provided from the board for Processed date, not Sales date.
1. Note: this market share is to help a vendor pick a strong Real Estate office to help sell their home and is not about how much your agents sold out of the area - only how dominantly they sell within their local market area.
2. We cannot use the sold date as sales that are finally processed 2- 3 weeks later would then change the statistics. For example, the previous month’s absorption rate taken at the end of the month with increase by 10% or more if recalculated one week later.
4. Our aim is to compile monthly reports rather than cumulative reports so Brokers can see the monthly changes.
If you would like some customized reports let me know, or If you would like to sponsor or another area let me know.
Bill Coughlin
eXp Realty
1-778-374-3744
[email protected]
The Real Estate Mixed Market Report has been available to every Real Estate office in the Lower Mainland since 1985,
and Victoria and Vancouver Island since 1997. In December 1999, it was moved to the Internet and renamed the Real Estate Mixed Market Report - Online.
In 2003 the Kamloops and District Board was added- removed,and the Okanagan Mainline Real Estate Board offices joined in 2006.
In 2007, the BC Northern Real Estate Board became our 7th Board
|
Wow.. Thank you Jim for providing these most incredible marketing tools
that has helped 1,000's of Real Estate agents
get more listings by using your Real Estate reports!
From Real Estateers throughout the province
we applaud you!!!!
Thank you Jim!
|
|
HI there, I'm Bill Coughlin from eXp Realty Abbotsford and I am tempting to carry Jim Lees 26 year legacy of providing the Vancouver Market reports.
I love statistics to the 9th degree and back in 1983 I started analyzing the absorption rates and developed a very detailed Home Price Index.
Monthly I will be sending out the Real Estate Market Share Reports to 1,000+ Real Estate agents in the lower currently
I'm doing the local 17 cities and will move into the other Real Estate Boards when time or as volunteers arrive.
I also do the STR Sell-through rates, the MTI market trends , and a very detailed HPI Home Price Index for
our 17 lower mainland market areas which is published in the (VancouverMarketReports.com)
|
Right Click any image to save to your computer
The Lower Mainland Real Estate Market Reports
温哥华里士满加拿大不动产市场变动
Bill Coughlin
eXp Realty
1-778-374-3744
[email protected]
|
|


 Bob Mill's Invitation