......

, When do you think 's SFD Home Prices will Peak.. turn to a Buyers Market?  

How can you get More Listings SOLD?
Over Priced Listings are still the #1 problem
(59% expiry rate in 2013):  Only 26% of last years listings were listed on the money to be sold without having to reduce the listing price.

How can make your CMA's More Powerful and get a higher conversion at the RIGHT PRICE?

Over 1,000 CMA'S this Year have used these Advanced tools to get those sharper prices!

The ABSOLUTE Most Accurate Home Price Index (paired) HPIp  now enables you to see the Home Value Histories, the Current Values to help you create your instant CMA's and soon to come the Forecasts

 
, may we show you how we help so many?  (Yes)
Click Here  to Expand the Movie  
Price Reductions Work! In August, in the Vancouver area, 47% of the single family home sales over 30 Days On Market REDUCED their list price by $45,000 (median)
At the same time 59% of the August single family sales in FV/Chilliwack that were over 30 DOM REDUCED their list price by $19,994 (median) 

    Note:  61% of the listings now expiring had no price reduction!  Last year 63.5% of the listings expired!  
  

Sponsored in part by Virtual Real Estate Assistants​


Burnaby

June 1, 2026

gas gauge

Current:  Burnaby's Residential Detached housing market is in a Buyer's Market with %SOLD rate.
                (This means 7 homes out of 100 sold last month  with an average $95,000 decrease from the original price) Lesson

Most Active Range: Homes below $1.7 mill. have  14.8 %SOLD rate
Least Active Range: Homes  above $3.5 mill. have 1.6 %SOLD rate.

History: The Burnaby Year-To-Date Home Price Index HPIp (Top 50%) shows that prices decreased $243,275.
               The Burnaby Home PriceIndexHPIp (Lower 50%) Year-To-Date shows that prices  decreased $168,101.
                   *The HPIp (Home Price Index) is an approximate reflection of the Average Home Price Changes.

Forecast: Burnaby has a normal Listing supply; 426 homes are for sale and with the 7 %SOLD monthly rate gives us a ~14 months of inventory. 10% of the active listings have reduced their price by $115,142  on average or $100,000 median. We project Burnaby now in Buyer's market.

Greater Vancouver May 2026: 

The Metro Vancouver housing market nosedived in May. Detached home prices dropped by an average of $12,351. This is a much bigger drop than April, when prices only went down $745. Right now, in what is normally one of our stronger spring market months, 76% of detached-home markets are declining. 

Condo prices also fell, by an average of $2,047. About 61% of condo markets are still decreasing, but townhomes are doing better this month. Prices went up by an average of $888. Even better, 63% of townhome markets are rising. Last month, only 18% were going up. This shows more buyers are interested in townhomes. The June forecast for is that detached homes and condos will stay under strong downward pressure, while townhomes could remain stable.

It’s more important than ever to know what’s happening in your local area. Want to see which neighbourhoods are doing well or not? Check VancouverMarketReports.com every Saturday at noon for the latest Sell-Through Rates for all 17 cities. For advice or a free home market review, call Bill Coughlin and the Coughlin Team at 778-374-3744. We can help you make the best move.


Fraser Valley May 2026: 

The Fraser Valley housing market slowed down in May. Detached home prices dropped by an average of $8,452. This is a bigger drop than April, when prices went down $3,825. Right now, that is not good for what is normally one of our stronger spring market months, with 83% of detached-home markets declining.

Condo prices were the bright spot. Prices went up by an average of $1,212, bouncing back from April, when prices went down $815. Right now, 67% of condo markets are rising. Last month, only 50% were going up. This shows more buyers are interested in condos again.

Townhomes are still under pressure. Prices fell by an average of $4,062. Right now, 75% of townhome markets are declining, the same as last month. This means the townhouse market could be under even more pressure next month.

The June forecast is that detached homes and townhouses will stay under strong downward pressure. Condos, as the most affordable choice, could continue to improve or stabilize.

It’s more important than ever to know what’s happening in your local area. Want to see which neighbourhoods are doing well or not? Check VancouverMarketReports.com every Saturday at noon for the latest Sell-Through Rates for all 17 cities. For advice or a free home market review, call Bill Coughlin and the Coughlin Team at 778-374-3744. We can help you make the best move.


......

Spring 2014 Market News

 STOP  61% of 's listings from EXPIRING!


Re/Max Market Share Reports

Sponsored in part by Virtual Real Estate Assistants​

Hello  , fellow RE/MAX Agent.
These Re/MAX Market Share Reports are sponsored by
the Canada's Most Referred Referral Network! we thank  them for their support and please refer to them in your appreciation.

West Van - Steve Burk North Van - steve Burk Downtown Westend - Steve Burk Van Westside - Sharon Lum Coquiltam - Phil Haig Port Coquiltam and Port Moody -Phil Haig Mission - Bill Coughlin Chilliwack - Corney Les Cultus Lake - Bill Coughlin Abbotsford - Bill Coughlin North Langley - Jorda Langley - Bill Coughlin East Surrey - Greg Mark West Surrey - Greg Mark Burnaby - Albert Yen New West - John Mackenzie North Delta - Tom Edwards White Rock - Team Claude Richmond Multi Family - Larry and Taylor Biggar Richmond - Larry and Taylor Biggar Coal Harbour - Steve Burk N. Burr..by - Charlie Kiers Maple Ridge - Lori Blake Ladner Delta - Gurdial Badh East Van Multi Fmly - Gurdial Badh East Van -Charile Kiers Powell River - Ross Cooper Whistler Edmonton - John Carle Calgary - 1 Calgary - 2 Calgary - 3 Kelowna Edmonton - Jogn Carle 2 Calgary - 4 Calgary - 5 Calgary - 6 Calgary - 7 Calgary - 8 Calgary - 9 Calgary - 10 Calgary - 11 Calgary - 12 Calgary - 13 Nanaimo - Rudi Widdershoven Victoria RMR Referral Network The Network is growing and growing !


Remax Report ...If you cannot see this image   you need to click through the top link

Remax Report ...If you cannot see this image   you need to click through the top link

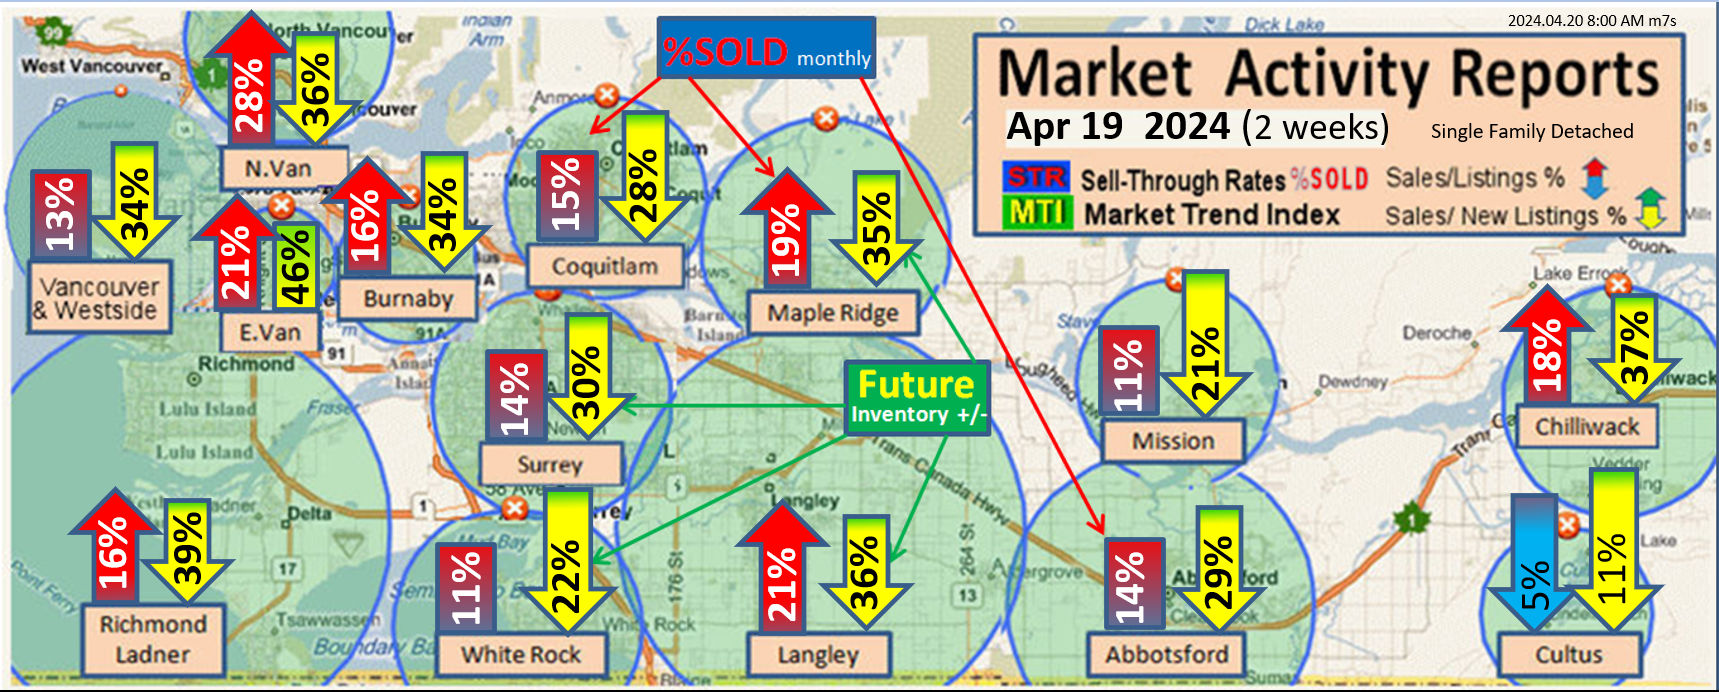
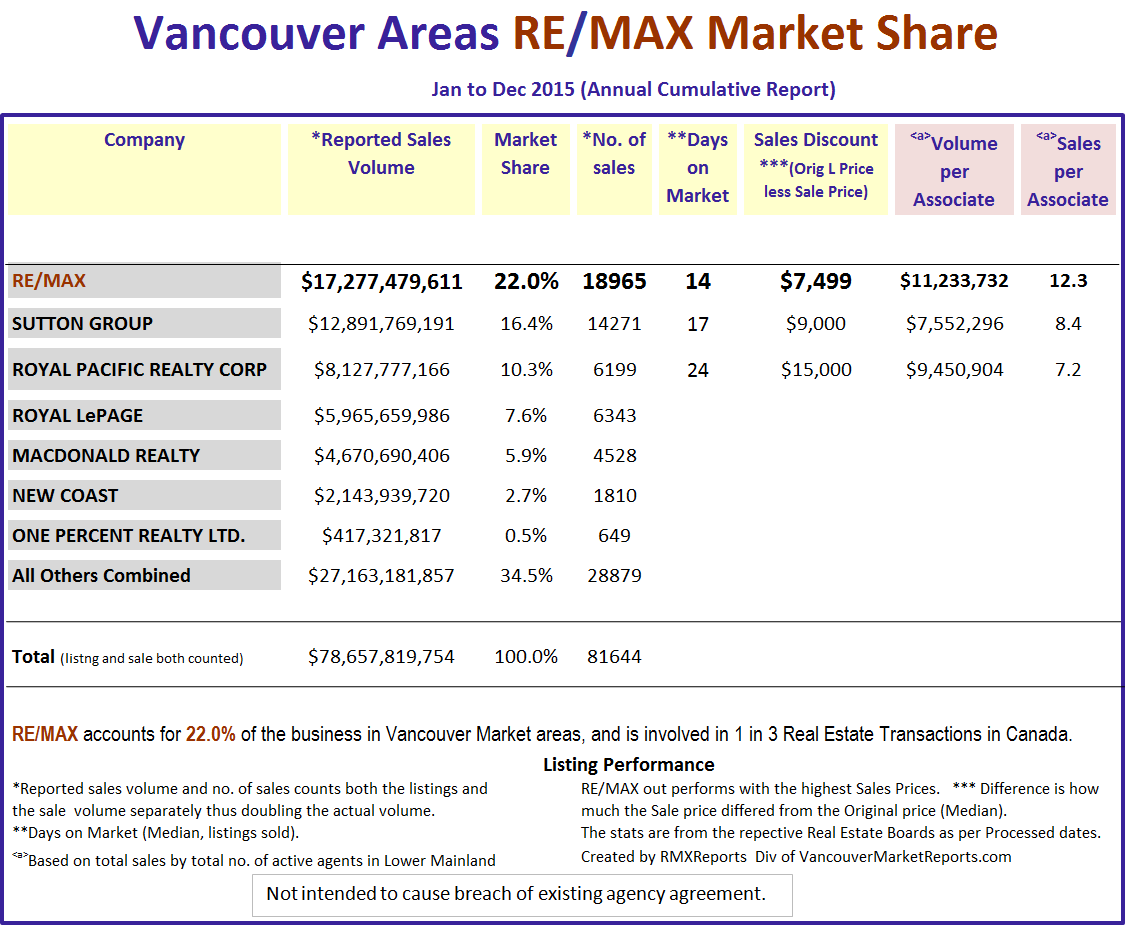
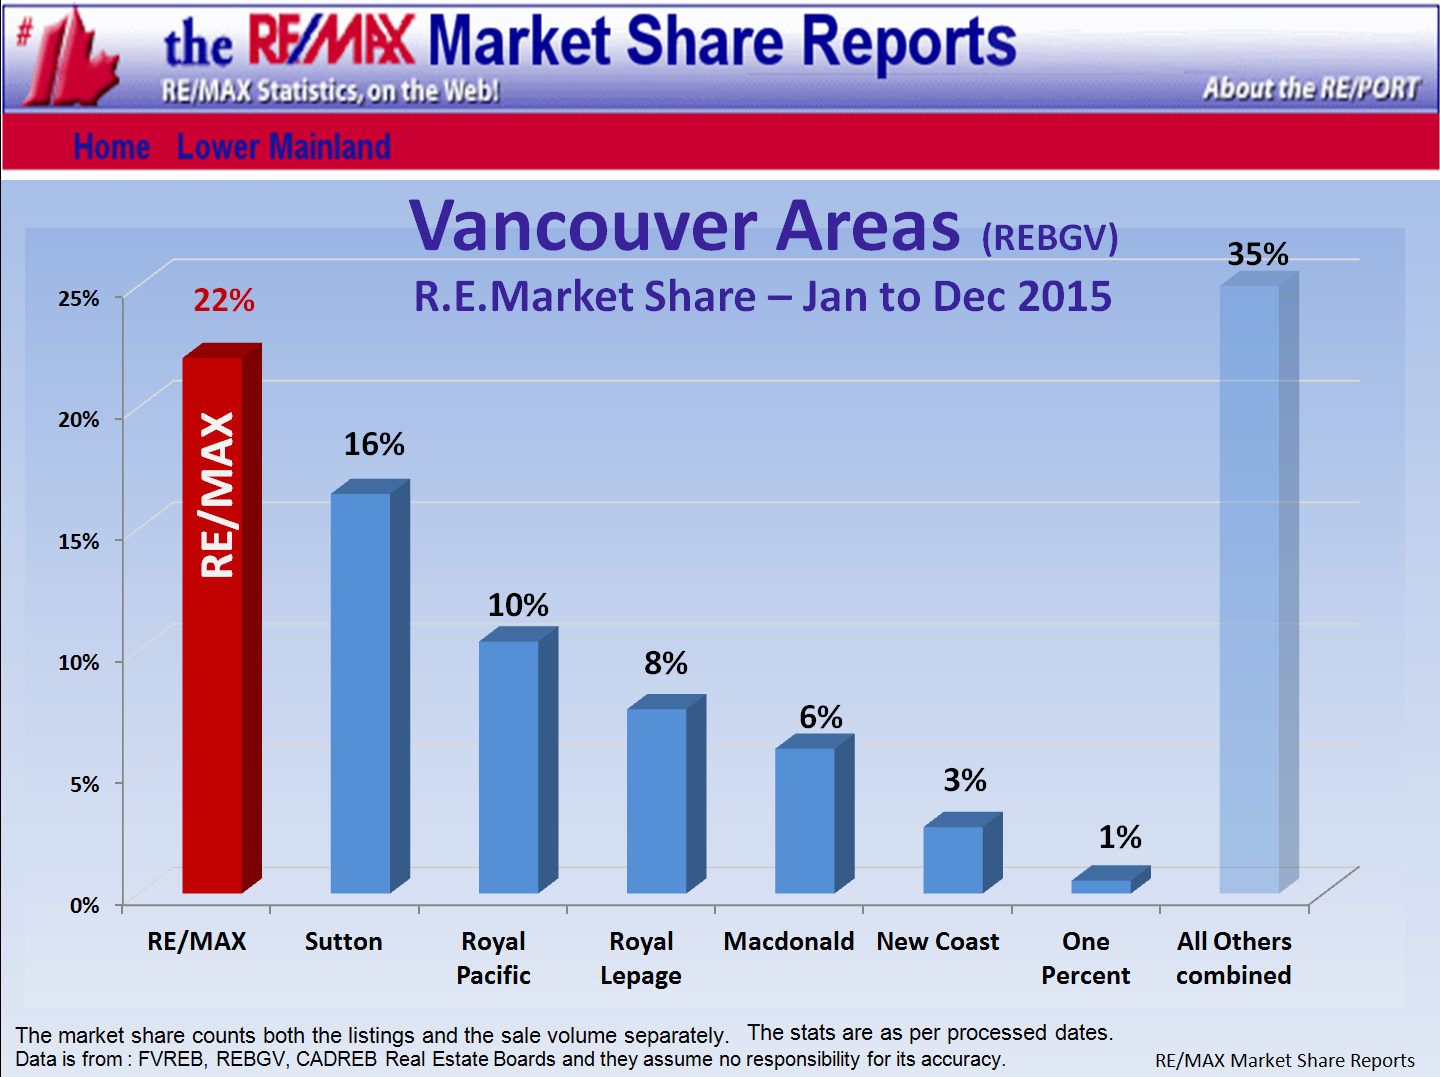
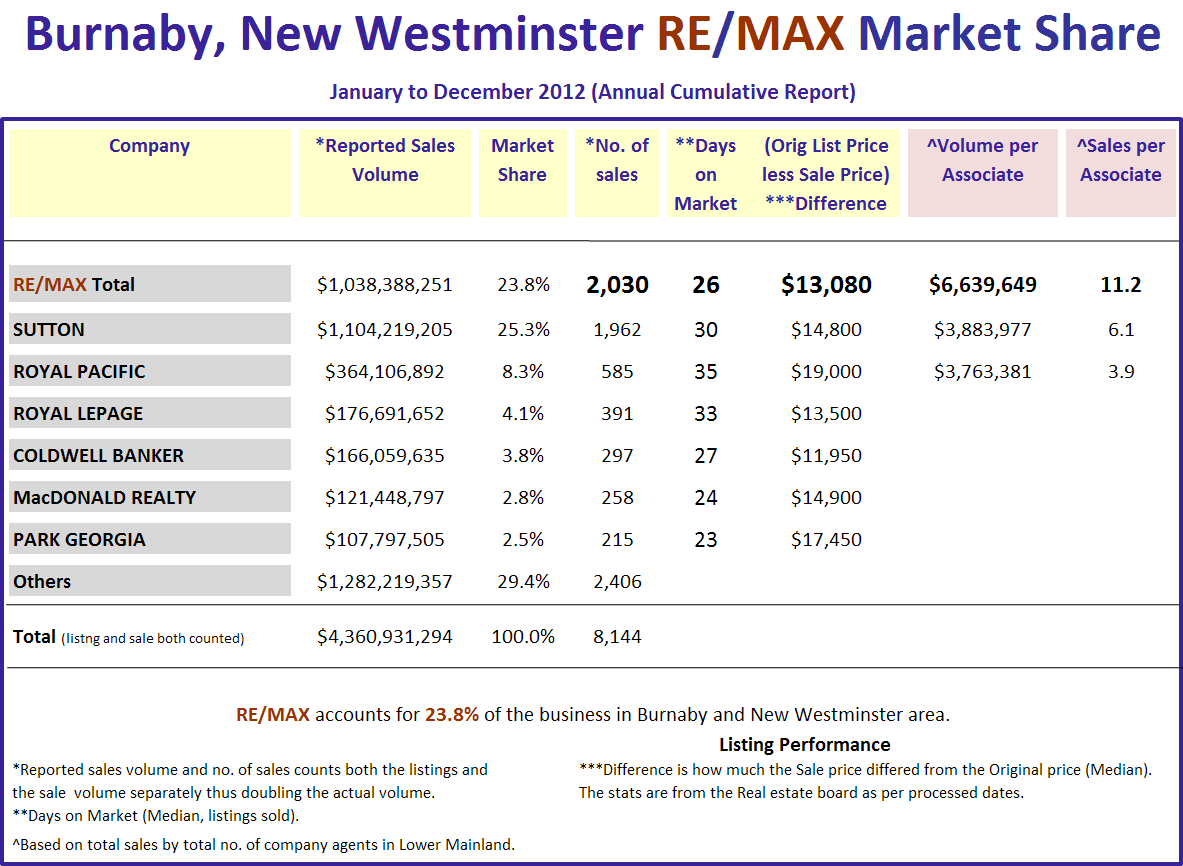
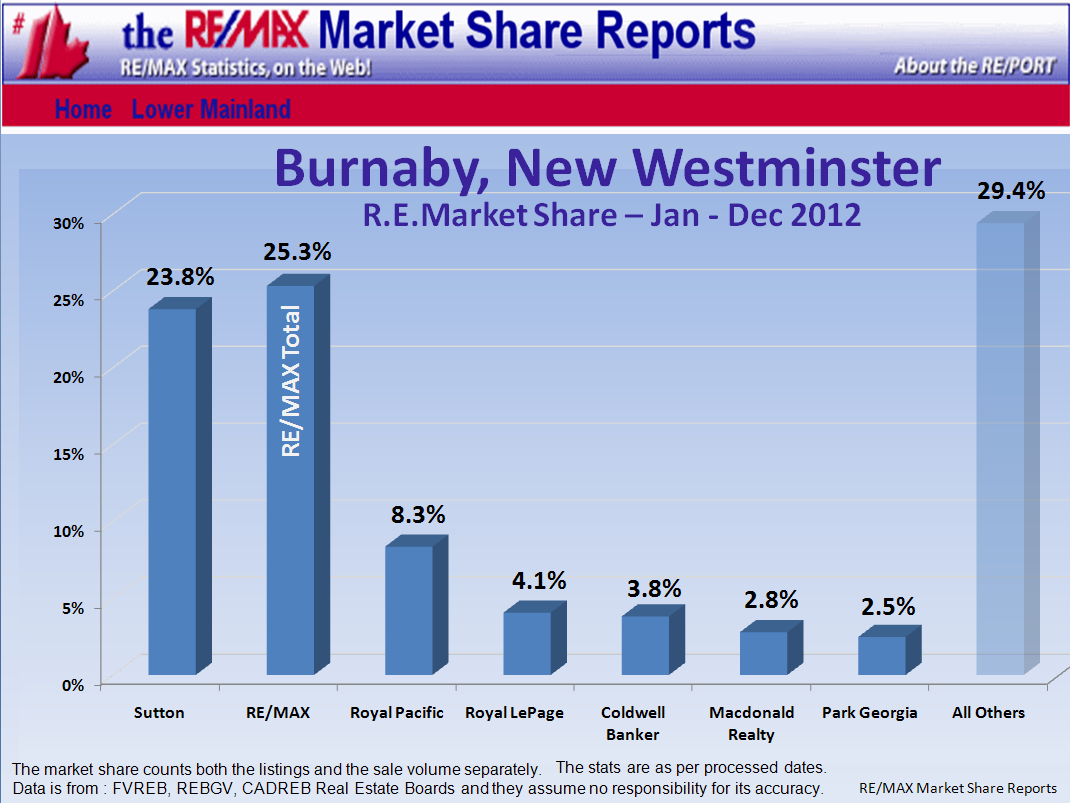
NOTE: This representation is based in whole or in part on  the Real Estate Boards of Greater Vancouver, Fraser Valley, Chilliwack which assume no responsibility for its accuracy.

Previous Quarterly Report   The Cumulative report.. the BEST REPORT for your CMA to help you win the listings.                                               Copyright © 2011 by Bill Coughlin

We thank Bill Coughlin for his support of these Burnaby Real Estate Updates which include sub-areas such as East Burnaby, Capitol Hill BN, South Slope, Government Road, Deer Lake etc. Contact Bill as the Local Expert.... more details.

Burnaby Real Estate Market updates for Deer lake, Goverment road and all other sub areas

Burnaby Real Estate Market updates for Deer lake, Goverment road and all other sub areas

Burnaby Real Estate Market updates for Deer lake, Goverment road and all other sub areas

Burnaby Real Estate Market updates for Deer lake, Goverment road and all other sub areas

Download the full BurnabyMarketupdatereport.PDF

Government Road, Deer Lake, East Burnaby, Capitol Hill BN, South Slope etc. sub areas updates for Burnaby

Government Road, Deer Lake, East Burnaby, Capitol Hill BN, South Slope etc. sub areas updates for Burnaby

Government Road, Deer Lake, East Burnaby, Capitol Hill BN, South Slope etc. sub areas updates for Burnaby

Government Road, Deer Lake, East Burnaby, Capitol Hill BN, South Slope etc. sub areas updates for Burnaby

This Burnaby Real Estate Market update includes the sub areas Government Road, Deer Lake, East Burnaby, Capitol Hill BN, South Slope etc.


About these Reports
 

  • Pop-bye Gifts
  • Gift Cards
 

Real Estate Mixed Market Reports


Real Estate Mixed Reports
Request


*Full Name:
          
*Real Estate Office:
          
*Email:
          
*City:


Number of visits on this page: 3,809. Number of visits on this site: 18,927,611.