|
Coquitlam Real Estate Market Analysis Reports
April 7th 2011
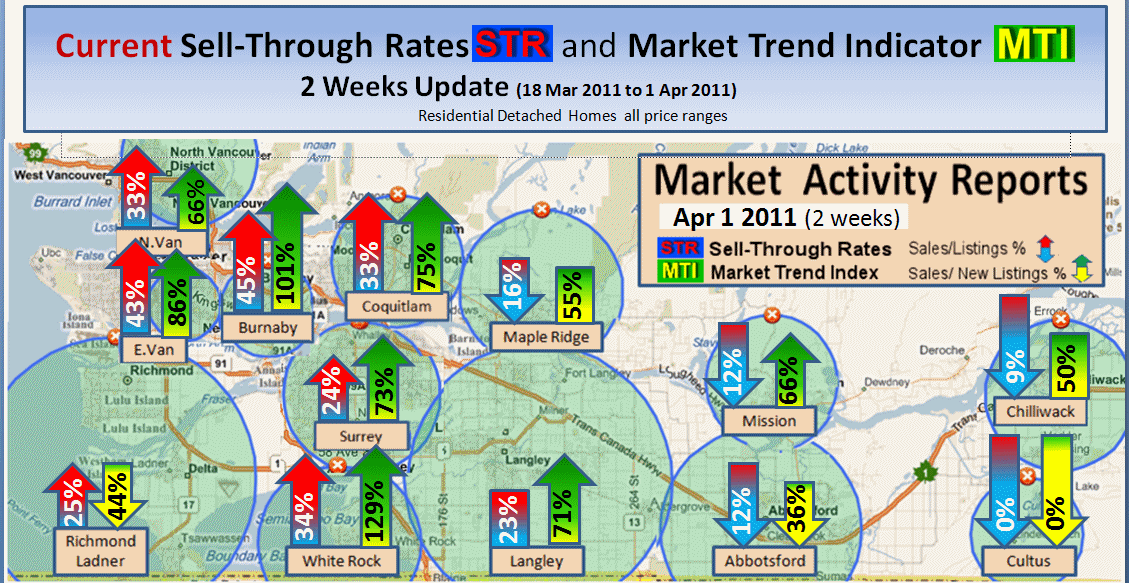
We watched with envy as Richmond, White Rock, then Burnaby and now Coquitlam all experience a hot market . Meanwhile any city east of the Port Man bridge is barely hanging in there. Abbotsford has the worst sell through in the Valley at 12% last month.
I will determine the current values changes by April 11. Meanwhile check the sell through rates below.
Disclaimer: Market predictions are exactly that: predictions. Market conditions are changing daily and you should consult with your local expert to confirm facts before making any decisions.
Index
-
Index
-
Price changes (semi-annual))
-
Sales/Listings .. Current Supply Demand STR
-
Market Trend Index (MTI)
-
Study Criteria and data reports
-
Study Map
top
Home Price Index HPI
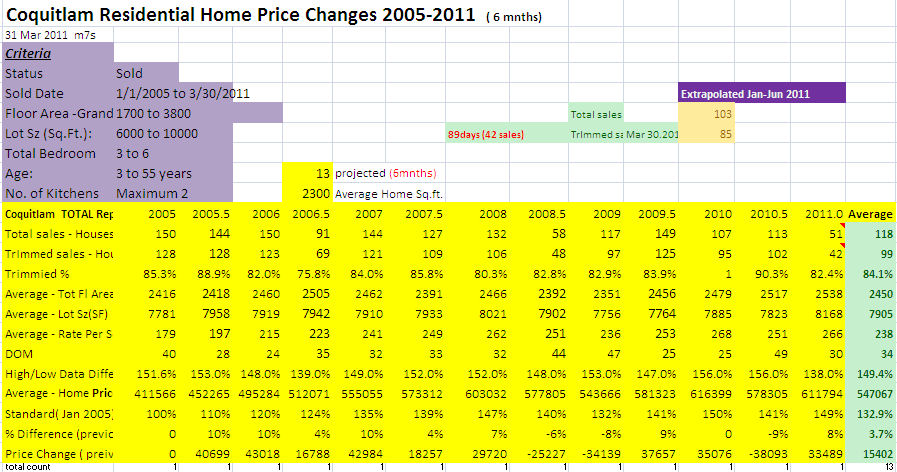
Study Criteria Home size: 1700-3800 sqft, Lot: 6000 to 10000 sqft, Bed Room: 3 to 6, Age: 3-55 yr, Kitchen: Maximum 2
top
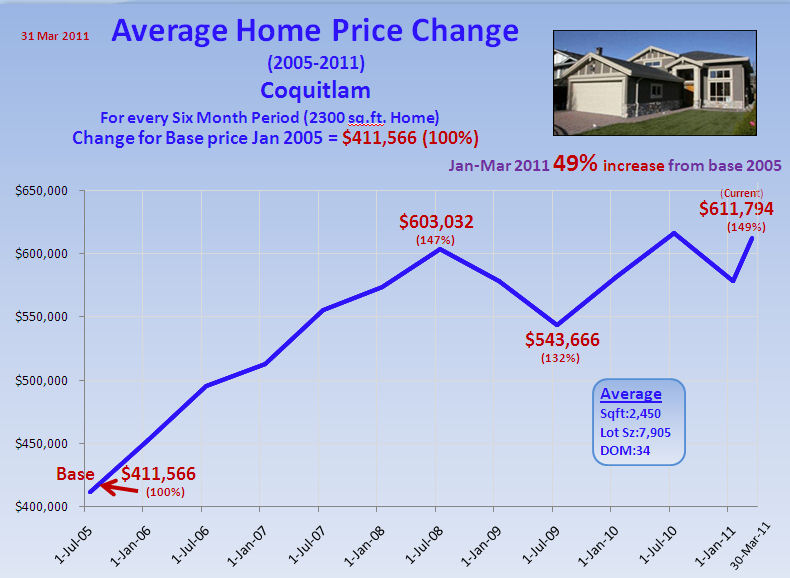
Coquitlam Average Home Price Difference 2005-2011 Six Month periods (2300 SqFt)
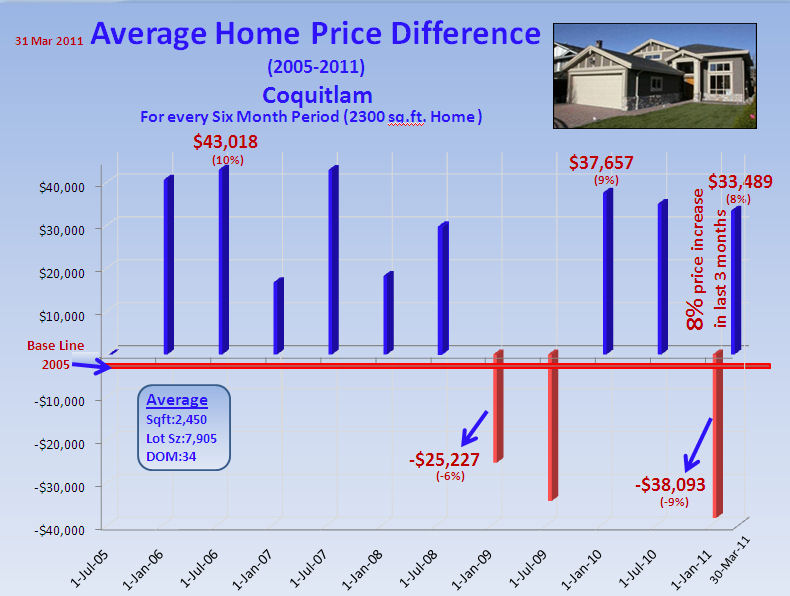
Study Criteria Home size: 1700-3800 sqft, Lot: 6000 to 10000 sqft, Bed Room: 3 to 6, Age: 3-55 yr, Kitchen: Maximum 2
top
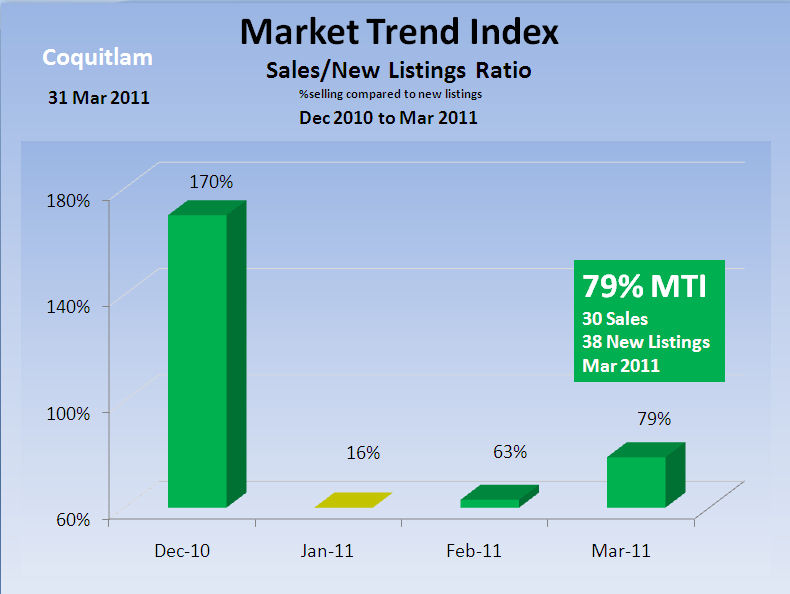
Market Trend Index: Mar 31 2011
When you sell more than you list for a given month then soon you will run out of listings and have more demand than supply thus forcing prices up.
Stability ratios based on a 6 year study from 2005 to 2010 show that we need about 65% sales-to-new-listing/mnth ratio to stabilize the market
In the Surrey area for the outlined search criteria we had a very low MTI ratio in January thus indicating a poor February market. Now finally we are seeing the effect of the hot sell- through activity in Richmond finally spill over.
Our 72% MTI which is higher than the 40-63% range we need to stabilize the market. This market is warming up and indicators are it will just now moving into positive territory. .
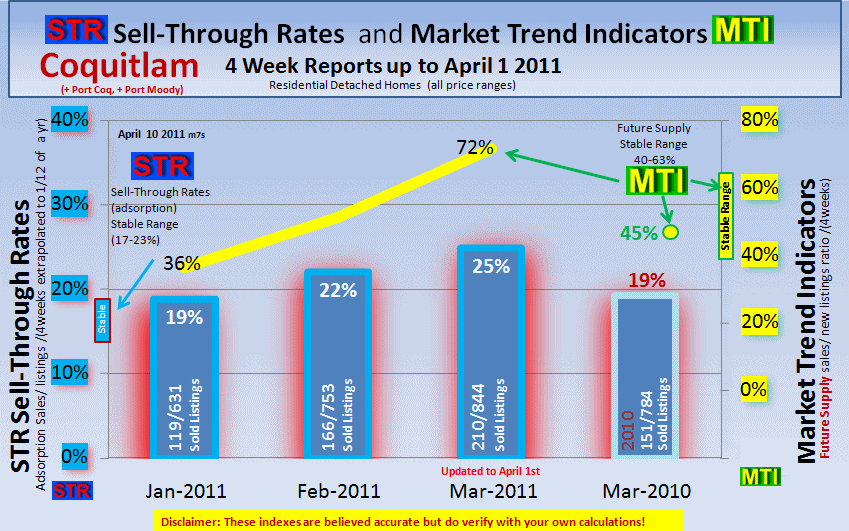
Study Criteria Home size: 1700-3800 sqft, Lot: 6000 to 10000 sqft, Bed Room: 3 to 6, Age: 3-55 yr, Kitchen: Maximum 2
top
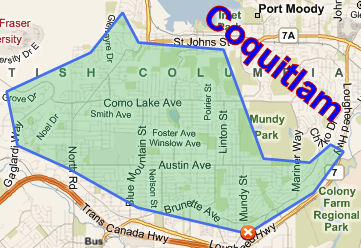
The Study Map Area
top
The Study Criteria and Research Data
Disclaimer: Market predictions are exactly that: predictions. Market conditions are changing daily and you should consult with your local expert to confirm facts before making any decisions.
Index
top
Bill Coughlin
"Realtor and Lifestyle Consultant"
604-217-3992 cell
1-888-539-4664 Toll free
[email protected]
CoughlinTeam.com
Re/Max Little Oak Realty
Abbotsford, Mission BC
|