|
Richmond
Ladner Real Estate Market Analysis Reports
The Chinese Investors are coming, ~20-33% price jump in 6 weeks!
March 2 2011 w8c
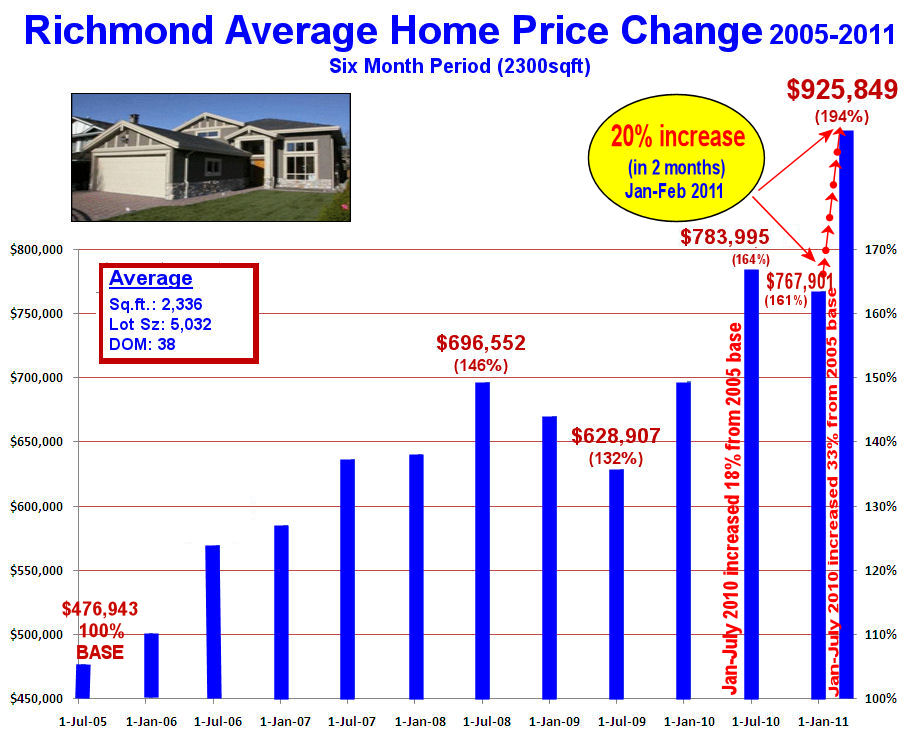
The Richmond Residential Market has jumped ~20-33%, an all time price increase, nearly $158,000 for the average home* in just 6 short weeks with no end in sight.
Listen to the "Entrepreneur of the Week" as Bob Cooke, ReMax Progroup, Ladner, Richmond area, does an interview on "The Chinese Buying Frenzy" as to how this price surge could affect your home value and how you can make informed decisions . Live podcast: click here
Feb 27 2011 w8c zzz
Richmond has shocked our Real Estate industry with an all time price increase record of 20%-33% in just 6 weeks. Is it sustainable? Will it affect your home valuation?
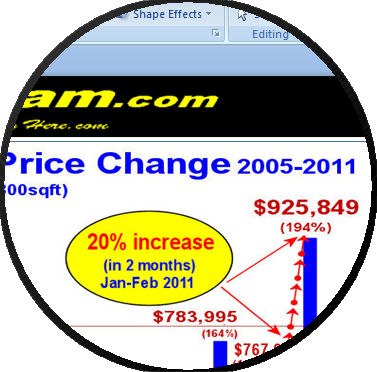 The fact is that are we have an increased buyer demand coming from mainland China. It is our understanding that China has changed some government rules making many wealthy Chinese consider investing outside China. So as the story unfolds, we had just experienced a quiet market in most of BC's cities up until January 15th or thereabouts when Chinese investors started arriving by the plane load. Prior to their arrival, their agents pre-purchased many homes with assignment clauses and then drove and helicoptered them around the Richmond and surrounding coastal areas and purchased many of these homes. As a trend our new home sales each month have exceeded our new listings for the month. This has caused a record 20% price increase in just 2 months, and a 33% price increase from our 2005 base price of $477,000. The fact is that are we have an increased buyer demand coming from mainland China. It is our understanding that China has changed some government rules making many wealthy Chinese consider investing outside China. So as the story unfolds, we had just experienced a quiet market in most of BC's cities up until January 15th or thereabouts when Chinese investors started arriving by the plane load. Prior to their arrival, their agents pre-purchased many homes with assignment clauses and then drove and helicoptered them around the Richmond and surrounding coastal areas and purchased many of these homes. As a trend our new home sales each month have exceeded our new listings for the month. This has caused a record 20% price increase in just 2 months, and a 33% price increase from our 2005 base price of $477,000.
Meanwhile outside this narrow geographical corridor, our general real estate market appears to reflect normal to below normal sales / listings volumes. NOTE : areas just 10 miles apart can experience dramatically different market activities. So read and listen to the podcasts to see how this phenomena could affect your market.
Advanced Market Reports: to access the current Supply-and-Demand and the next "30 Day Market Projections" reports members click here.
.
Disclaimer: Market predictions are exactly that: predictions. Market conditions are changing daily and you should consult with your local expert to confirm facts before making any decisions.
Index
- Index
- Price changes (semi-annual))
- Sales/Listings .. Current Supply Demand
- Market Trend Index (MTI)
- Study Criteria and data reports
- Study Map
top
Home Price Index HPI
Study Criteria Home size: 1500-3500 sqft,, Lot: 3800 7000 sqft, Age: 10-50 yrs, Bedrooms: 3-6 resulting in a sample size = 541/1361=25%
top
Richmond Average Home Price Difference 2005-2011
Six Month periods (2300 Sq Ft)
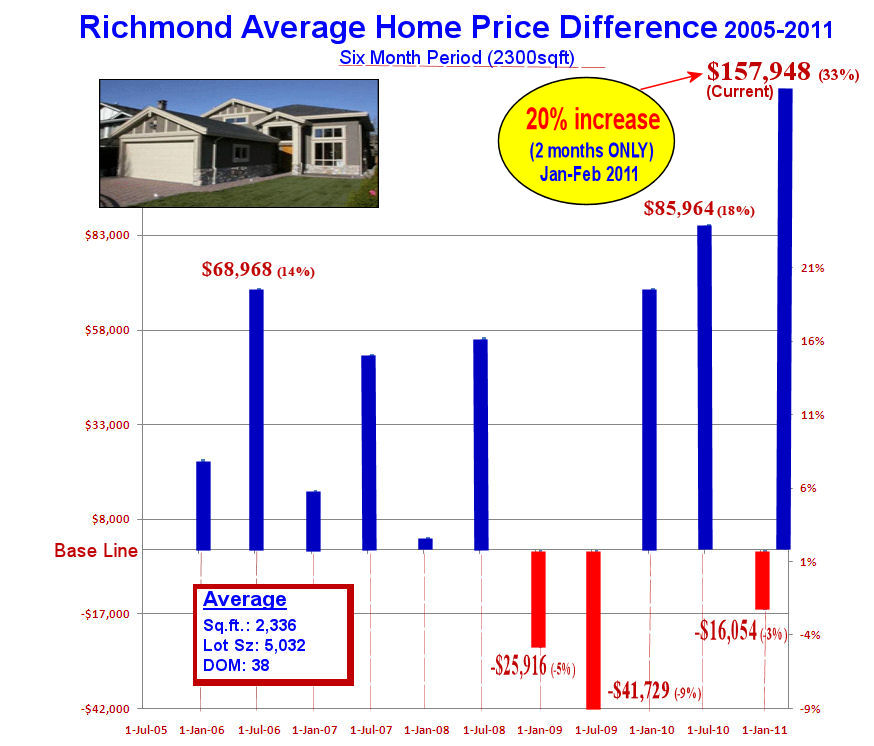
Study Criteria Home size: 1500-3500 sqft,, Lot: 3800 7000 sqft, Age: 10-50 yrs, Bedrooms: 3-6 resulting in a sample size = 541/1361=25%
top
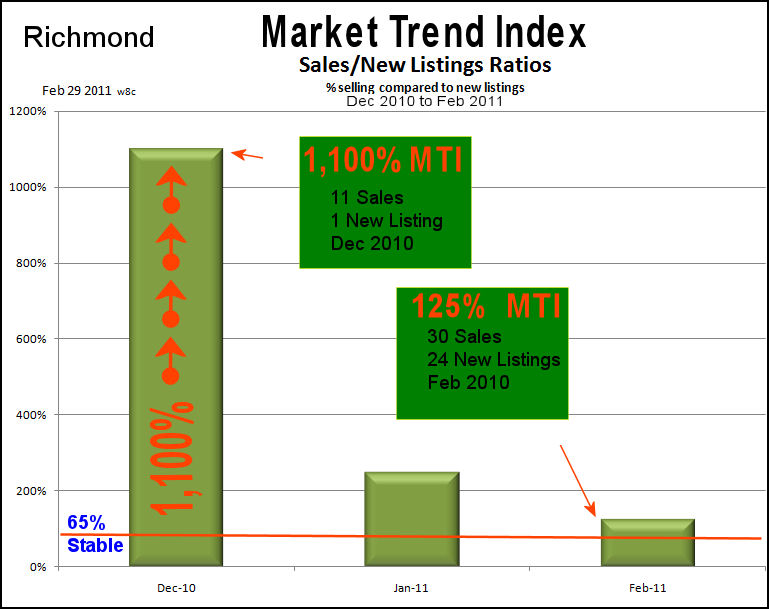
Market Trend Index: Feb 29 2011
When you sell more than you list for a given month then soon you will run out of listings and have more demand than supply thus forcing prices up.
Stability ratios based on a 6 year study from 2005 to 2010 show that we need about 65% sales-to-new-listing/mnth ratio to stabilize the market
In the Richmond area for the outlined search criteria we had only 1 listing at a time when we had a strong sell through of 11 sales, and then in January we had only 6 listings with 15 sales in the same month. Both of these ratios - 1,100%, and 250% - are much higher than the 65% ratio needed for market stability and have put all time record upward pressure on home prices. Our analysis shows that these home prices have risen 33% in about 6-8 weeks.
In February we saw 24 new listings on the market and 30 sales giving us a 125% MTI which is double the 65% needed to stabilize the market. This market is still setting record price increases with no end in sight.
Study Criteria Home size: 1500-3500 sqft,, Lot: 3800 7000 sqft, Age: 10-50 yrs, Bedrooms: 3-6 resulting in a sample size = 541/1361=25%
top
The Study Map Area

top
The Study Criteria and Research Data
Bill Coughlin
"Realtor and Lifestyle Consultant"
604-217-3992 cell
1-888-539-4664 Toll free
Bill@coughlinteam.com
CoughlinTeam.com
Re/Max Little Oak Realty
Offices: Abbotsford, Mission, Surrey, BC
|