|
The Richmond City Real Estate Market update which includes sub-areas such as Granville, Seafair, Broadmoor, Lackner, Riverdale are Sponsored by Biggar Group, RE/MAX West Coast.
We thank Taylor and Larry Biggar for their support of these Market Updates. Contact Biggar Group as the Local Expert. more details
Download the full RichmondMarketupdatereport.PDF
The Richmond City Real Estate Market report includes sub-areas such as Riverdale RI, Granville, Broadmoor, Lackner, Seafair etc

Click Image to compare previous STR/ MTI graphs
Trying to do the math? Lessons: STR MTI
The Richmond City Market Statistics includes sub-areas such as Seafair, Riverdale RI, Granville, Lackner, Broadmoor etc. See the analytics to forecast the investment risks. Link
Hi from Sunny Richmond ...Talyor Biggar Go to our website for more info at Steveston Real Estate & Steveston Community Info
Larry and Taylor Biggar
Richmond + Ladner STR
|
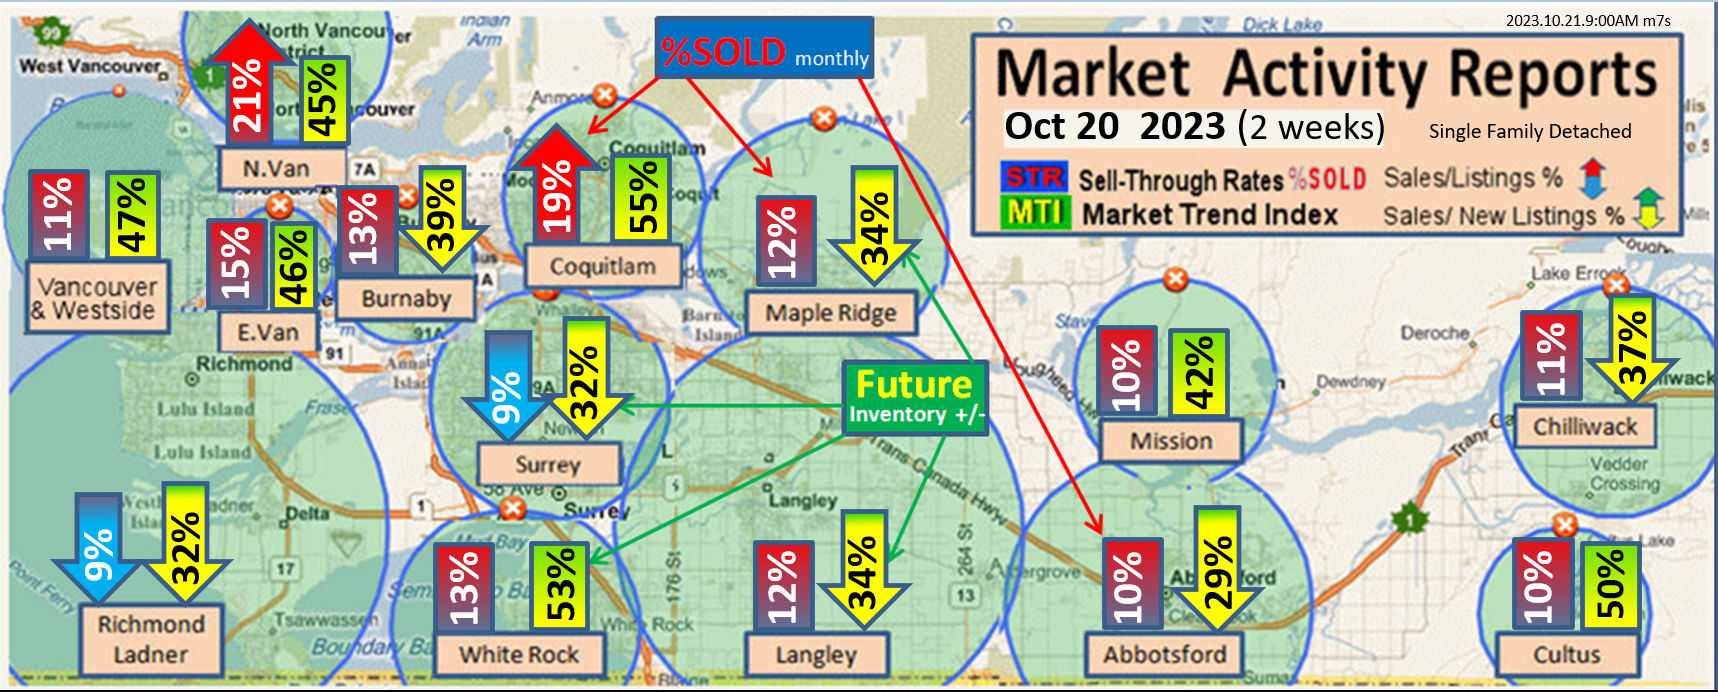
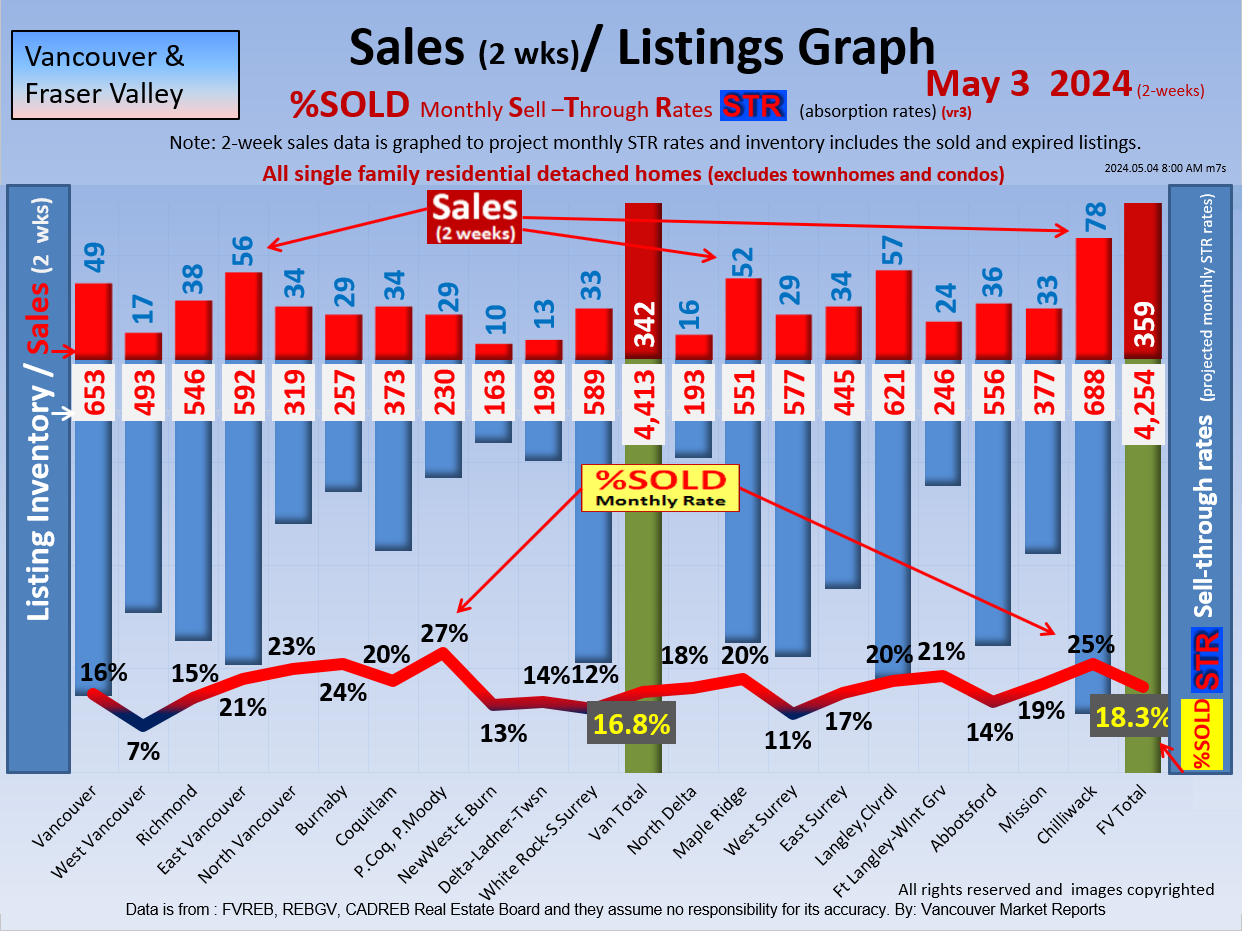
This is the most accurate %SOLD-Monthly Sell Through Rates (STR Graph) using a 4 week time period to analysis the housing prices and Market trends. This Market Report is derived from the exact Sat to Friday 4 week time periods and this is dramatically more accurate than the month to month comparisons that vary based on actual working days eg month, weekends. These trends enable Real Estate Market predictions and forecast outlooks. |
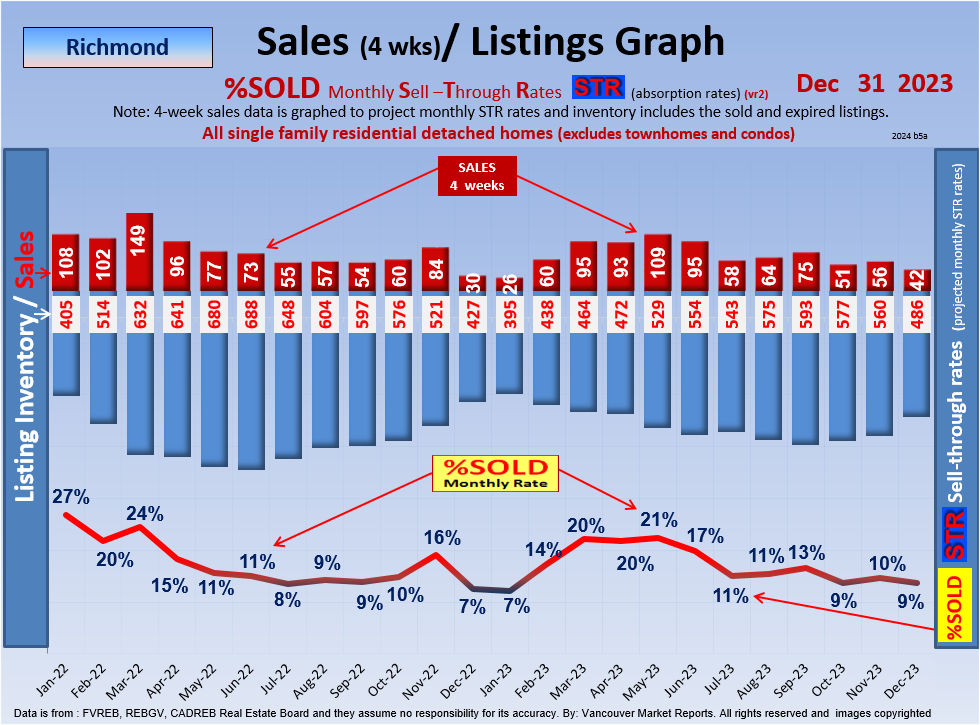
Richmond Proper
Study Criteria (Richmond Proper) Home size: 1500-2800 sqft,, Lot: 3800 7000 sqft, Age: 10-50 yrs, Bedrooms: 3-6
Disclaimer: Market predictions are exactly that: predictions. Market conditions are changing daily and you should consult with your local expert to confirm facts before making any decisions.
Archives March 2. 2011: May 15 2011
|
Registration for Monthly and Bi-Monthly Market Reports

|
Vancouver and FV Market Reports and Forecasts
Developers, Investors, Realtors or Financial Advisers.
- Now you can be informed of the market changes as they happen.
- Now you can receive bi-monthly updates.=
- Each month we analyze the Real Estate Supply and Demand for 22 cities in the lower mainland: Vancouver to Chilliwack and we make the forecasts for the following month or more.
Membership Free, (Sponsored Realtors Click here )
This is a free service to over 5 million viewers today!!! (
|
|
|
|
Hot New Listings
Richmond's
Instant MLS Search
Richmond Homes
for Sale
- Today's New Listings
- $1,350,000 or Less
- $1,350,000 - $1,500,000
- $1,500,000 - $1,650,000
- $1,650,000 - $1,775,000
- $1,775,000 - $1,900,000
- $1,900,000 - $2,100,000
- $2,100,000 - $2,350,000
- $2,350,000 - $2,500,000
- $2,500,000 - $2,750,000
- $2,750,000 - $3,000,000
- $3,000,000 - $3,750,000
- $3,750,000 and More
- Richmond Foreclosures
Richmond
Condos for Sale
- Today's New Listings
- $375,000 or Less
- $375,000 - $425,000
- $425,000 - $475,000
- $475,000 - $500,000
- $500,000 - $530,000
- $530,000 - $550,000
- $550,000 - $590,000
- $590,000 - $625,000
- $625,000 - $650,000
- $650,000 - $690,000
- $690,000 - $725,000
- $725,000 - $775,000
- $775,000 - $825,000
- $825,000 - $900,000
- $900,000 - $1,050,000
- $1,050,000 - $1,500,000
- $1,500,000 and More
- Condo Foreclosures
Richmond
Townhouses
- Today's New Listings
- $700,000 or Less
- $700,000 - $775,000
- $775,000 - $875,000
- $875,000 - $940,000
- $940,000 - $1,000,000
- $1,000,000 - $1,150,000
- $1,150,000 and More
- Townhouse Foreclosures
Richmond
Building Lots
Richmond
Farms
|

Real Estate
Market Reports
Index


Members Login
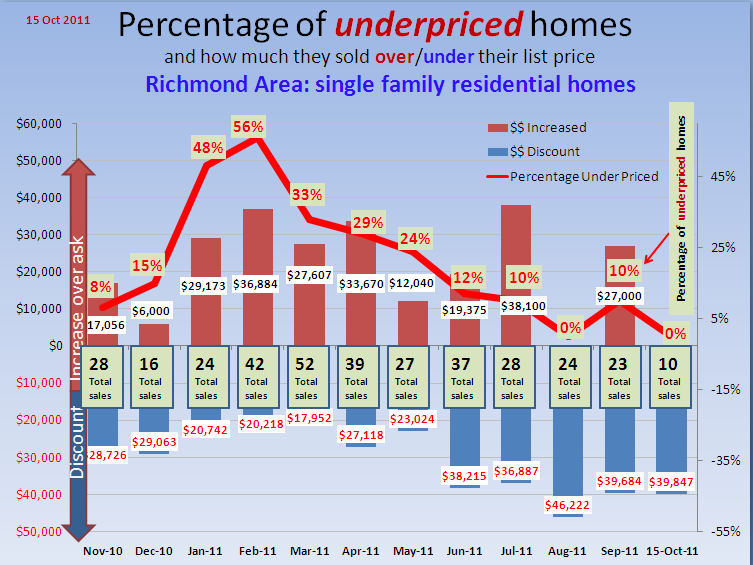
DiscountOverlist Stats
|
Adian's Blog: news on Baby Boomers retirement issues Click here |


Bill Coughlin
EXP Realty

For Real Estate in Abbotsford, Mission, Langley, Surrey and Chilliwack
call me
1-778-374-3744
Coughlinb@gmail.com
|